


Abstract
Using single cell, real-time imaging, this study compared the impact of members of the B/R4 subfamily of the regulators of G-protein signaling (RGS) (RGS2, -3, and -4) on receptor-mediated inositol 1,4,5-trisphosphate [Ins(1,4,5)P3], diacylglycerol, and Ca2+ signaling. In human embryonic kidney (HEK) 293 cells expressing recombinant Gαq/11-coupled muscarinic M3 receptors, transient coexpression of RGS proteins with fluorescently-tagged biosensors for either Ins(1,4,5)P3 or diacylglycerol demonstrated that RGS2 and 3 inhibited receptor-mediated events. Although gross indices of signaling were unaffected by RGS4, it slowed the rate of increase in Ins(1,4,5)P3 levels. At equivalent levels of expression, myc-tagged RGS proteins showed inhibitory activity on the order RGS3 ≥ RGS2 > RGS4. In HEK293 cells, stable expression of myc-tagged RGS2, -3, or -4 at equivalent levels also inhibited phosphoinositide and Ca2+ signaling by endogenously expressed muscarinic M3 receptors in the order RGS3 ≥ RGS2 > RGS4. In these cells, RGS2 or -3 reduced receptor-mediated inositol phosphate generation in cell populations and reduced both the magnitude and kinetics (rise-time) of single cell Ca2+ signals. Furthermore, at low levels of receptor activation, oscillatory Ca2+ signals were dampened or abolished, whereas at higher levels, RGS2 and -3 promoted the conversion of more stable Ca2+ elevations into oscillatory signals. Despite little or no effect on responses to maximal receptor activation, RGS4 produced effects on the magnitude, kinetics, and oscillatory behavior of Ca2+ signaling at submaximal levels that were consistent with those of RGS2 and -3.
The family of regulators of G-protein signaling (RGS) negatively regulate signaling by G-protein-coupled receptors (GPCRs) by binding to activated Gα-subunits and acting as either GTPase-activating proteins (GAPs) or effector antagonists (Hepler, 1999; Ross and Wilkie, 2000; Hollinger and Hepler, 2002). More than 30 distinct proteins are now known to exist that contain an RGS or RGS-like domain. This is an approximately 120-amino acid region through which these proteins can increase the intrinsic GTPase activity of GTP-bound Gα subunits. It is interesting that many RGS proteins contain other recognizable protein binding domains, such as the G-protein γ-like (RGS6, -7, -9, -11) (Snow et al., 1998a), which confers binding to the G-protein subunit Gβ5, PDZ (RGS12, PDZ-RhoGEF) (Snow et al., 1998b; Hollinger and Hepler, 2002), DEP (disheveled, Egl-10, pleckstrin) (RGS6, -7, -9, -11) (Snow et al., 1998a), DH (dbl homology) and PH (pleckstrin homology) domains (p115RhoGEF, PDZ-RhoGEF) (reviewed in Hollinger and Hepler, 2002). These domains may be involved in determining cellular localization and RGS specificity toward Gα subunits, and they may also confer signaling roles distinct from inhibition of Gα-subunits (Hollinger and Hepler, 2002).
RGS and RGS-like proteins have been classified into subfamilies based on the alignment of the RGS domain amino acid sequences (Zheng et al., 1999; Ross and Wilkie, 2000). According to this scheme, RGS2, -3, and -4 each belong to the B/R4 RGS subfamily, of which RGS4 is considered the prototypical member. Except for RGS3, the B/R4 subfamily are small proteins (20-30 kDa) that contain an N-terminal cationic amphipathic α-helix that, at least for RGS4, is responsible for membrane attachment. Although RGS3 also contains an amphipathic α-helix adjacent to its RGS domain, it is a relatively large (∼70 kDa) protein with an N-terminal region three times larger than the RGS domain. The function of this N-terminal region, however, is poorly understood (Castro-Fernandez and Conn, 2002). RGS3 has previously been shown to inhibit signaling by several receptors [e.g., the Gαq/11-coupled gonadotropin-releasing hormone receptor) (Castro-Fernandez and Conn, 2002; Neill et al., 1997). RGS4 has previously been shown to inhibit signaling by both Gαi- and Gαq/11-coupled receptors (e.g., the muscarinic M2 and M3 receptors, respectively) (Doupnik et al., 1997; Rumenapp et al., 2001). In contrast, RGS2 lacks GAP activity toward Gαi, at least in vitro, but is 5- to 10-fold more potent than RGS4 in blocking Gαq-mediated activation of phospholipase Cβ (Heximer et al., 1997).
Many previous studies that have assessed the impact of RGS protein expression on the function of Gαq/11-coupled receptors have relied upon transient overexpression of RGS proteins and analysis of their effects in population-based assays (such as total inositol phosphate accumulation). The recent advent of novel biosensors to detect the generation of either inositol 1,4,5-trisphosphate [Ins(1,4,5)P3] (eGFP-PHPLCδ1) or diacylglycerol (eGFP-PKCγC12) has allowed examination of phospholipase C (PLC) activity at the single-cell level (Oancea and Meyer, 1998; Oancea et al., 1998; Stauffer et al., 1998; Nash et al., 2001). In particular, Ins(1,4,5)P3 and diacylglycerol production can be determined at the single-cell level in real-time and at a spatial resolution previously unimaginable (Nahorski et al., 2003). The eGFP-PHPLCδ1 construct represents a fusion protein of enhanced green fluorescent protein (eGFP) with the pleckstrin homology domain of PLCδ1. At rest, eGFP-PHPLCδ1 is localized to the plasma membrane, where it binds with high affinity and selectivity to phosphatidylinositol 4,5-bisphosphate (Stauffer et al., 1998; Nash et al., 2001); upon agonist stimulation, however, it becomes cytosolic as Ins(1,4,5)P3 is produced and binds to it with high affinity, thereby displacing it from the membrane (Nash et al., 2001). The eGFP-PKCγC12 construct represents eGFP coupled to the diacylglycerol binding domain of the C12 region of PKCγ. Under resting conditions, it has a cytosolic localization, but upon agonist stimulation and diacylglycerol production, it is recruited to the plasma membrane (Oancea and Meyer, 1998; Oancea et al., 1998).
In the present study, we show for the first time that novel protein-based biosensors that detect Ins(1,4,5)P3 and diacylglycerol production can be used to examine how RGS proteins differentially regulate Gαq/11-mediated signaling via the muscarinic M3 receptor at the single-cell level. Furthermore, we also show how RGS proteins differentially influence the pattern and kinetics of Ca2+ signaling at the single cell level.
Materials and Methods
Materials. Cell culture plasticware was from Nalge Nunc International (Roskilde, Denmark) and cell culture reagents were from Invitrogen (Paisley, UK). [myo-3H]Inositol was from Amersham Biosciences (Little Chalfont, Buckinghamshire, UK). Unless stated otherwise, other reagents were supplied by either Sigma Aldrich (Poole, UK), Fisher Scientific (Loughborough, UK), Merck (Darmstadt, Germany), or BDH Laboratory Supplies (Poole, UK).
Original RGS DNA Constructs. Plasmids containing full-length constructs encoding human RGS2 (L13463), human RGS3 (U27655), and rat RGS4 (U27767) were gifts from Dr. Craig Doupnik (University of South Florida College of Medicine, Tampa, FL). The plasmids for RGS2 and RGS3 in the mammalian expression vector pRcCMV (Invitrogen) were originally from Drs. Kirk Druey and John Kehrl (National Institutes of Health, Bethesda, MD), whereas the plasmid for RGS4 in the mammalian expression vector pcDNA3.1 (Invitrogen) originated from Dr. Henry Lester (California Institute of Technology, Pasadena, CA). The plasmid containing a constitutively active Gαq mutant (Q209L) (CA-Gαq) was a gift from Dr. Scott Heximer (University of Washington, St. Louis, MO) and originated from Dr. John Hepler (Emory University, Atlanta, GA). The vectors for the Ins(1,4,5)P3 (eGFP-PHPLCδ1) and diacylglycerol (eGFP-PKCγC12) biosensors were provided by Professor T. Meyer (Stamford University, Stanford, CA).
Generation of myc-Tagged Constructs. RGS2, -3, and -4 were PCR amplified from their original vectors to incorporate KpnI and XhoI restriction sites. The resulting PCR fragments were then column-purified (QIAGEN, Crawley, UK) and subcloned into pcDNA3.1/myc-His (Invitrogen). Expression of these constructs results in the generation of C-terminal myc-epitope-tagged RGS proteins.
Establishing Stable Muscarinic M3 Expression in HEK293 Cells. The generation of HEK293 cells stably expressing the muscarinic M3 receptor was achieved using a standard calcium phosphate method. Wild-type HEK293 cells (HEK293/WT) were transfected with the DNA encoding the human muscarinic M3 receptor that had been cloned (BamHI/EcoRI) into the plasmid pcDNA3 (Invitrogen,). Cells were selected with Geneticin (G-418; 500 μg/ml), and clones were expanded from single foci. Muscarinic receptor expression was determined by the binding of the muscarinic receptor antagonist 1-[N-methyl-3H]scopolamine methyl chloride exactly as described elsewhere (Willars et al., 1998a), and a single clone was selected for further study. These cells (HEK293/M3 cells) express approximately 1.7 pmol of receptor/mg of protein compared with approximately 40 fmol of muscarinic receptor/mg of protein in HEK293/WT cells.
Cell Culture and Transfection. Both HEK293/M3 and HEK293/WT cells were cultured in α minimal essential medium with GlutaMAX-1 and Earles' salts, supplemented with nonessential amino acids (1%), fetal calf serum (10%), and gentamicin (50 μg/ml). Cells were maintained in a humidified atmosphere (95% O2/5% CO2; 37°C) with the culture media replaced every third day and the cells passaged when they reached ∼80% confluence. For single-cell imaging, cells were plated onto 25-mm borosilicate glass coverslips coated with 0.01% poly-d-lysine (Sigma, Poole, UK). After 2 days in culture, cells were transfected with the relevant DNA using Genejuice (Merck Bioscience, Nottingham, UK) at a Genejuice/DNA ratio of 3:1 according to the manufacturer's guidelines. Cells were used for imaging experiments 48 h after transfection.
Establishing Stable RGSmyc Expression in HEK293 Cells. Stable RGSmyc-expressing cell lines were made according to established protocols (Willars et al., 1998a). In brief, HEK293/WT cells were grown to ∼50% confluence on 100-mm cell culture dishes. Cells were then transfected with 3 μg of RGSmyc DNA using Genejuice as described above. After 48 h, transfected cells were selected using G-418 (500 μg/ml). Cells on transfected plates were allowed to grow until all cells on a control plate of untransfected cells had died. Transfected cells were then serially diluted and seeded into 96-well plates. Single colonies originating from individual cells were then selected and expanded for screening by Western blotting with an anti-myc antibody (New England Biolabs, Hitchin, UK). The stable expression of RGSmyc proteins in selected clones was then confirmed throughout the experimental period using Western blotting.
Western Blotting of RGSmyc Proteins. Cells grown in 24- or six-well plates were solubilized (10 mM Tris, 10 mM EDTA, 500 mM NaCl, 1% Igepal CA630, 0.1% SDS, 0.5% deoxycholate, 1 mM phenylmethylsulfonyl fluoride, 100 μg/ml iodoacetamide, and 100 μg/ml benzamidine, pH 7.4) and proteins (∼30 μg/lane) separated by SDS-polyacrylamide gel electrophoresis using 8 to 12% running gels. Proteins were transferred onto nitrocellulose membranes, which were then blocked for 1 h in 5% (w/v) nonfat dry milk in TTBS (137 mM NaCl, 20 mM Tris, pH 8.0, and 0.05% Tween 20, pH 8.0) and incubated overnight at 4°C with primary antibody against the myc epitope (New England Biolabs) at 1:1000 in 3% bovine serum albumin (BSA) in TTBS. Blots were then washed three times (for 10 min each) in TTBS and incubated for 1 h with an anti-rabbit horseradish peroxidase-conjugated secondary antibody (1:3000 in blocking buffer; Sigma). After three further washes in TTBS (10 min each), the blots were exposed to ECL Plus detection reagents (Amersham Biosciences) according to the manufacturer's guidelines, and bands were visualized using Hyperfilm (Amersham Biosciences).
Immunostaining of RGSmyc Proteins. Cells were plated onto 22-mm diameter glass coverslips and allowed to adhere for 48 h before transfection. Immunostaining was carried out as described previously (Tovey et al., 2001). In brief, cells were washed with phosphate-buffered saline (PBS) and then immediately fixed for 30 min in 4% paraformaldehyde in PBS. After fixation, cells were permeabilized in PBS with 0.2% Triton-X100 (10 min); thereafter, non-specific sites were blocked by a 45-min incubation with PBS containing 3% BSA and 0.2% Triton-X100. Cells were then incubated overnight at 4°C in primary antibody (anti-myc; 1:100 in PBS with 3% BSA). On the following day, cells were washed three times in PBS (10 min each) and then incubated for 1 h with an anti-rabbit FITC-conjugated secondary antibody (1:250 in PBS with 10% goat serum; Vector Labs, Peterborough, UK). After three further washes (10 min each) in PBS, coverslips were mounted onto microscope slides using Vectorshield Fluorescence Preservative (Vector Labs). FITC labeling was then visualized using a Fluoview confocal microscope (Olympus, Tokyo, Japan).
Confocal Imaging of eGFP-Tagged Biosensors and Intracellular Ca2+ Signals. Cells were transfected with eGFP-tagged biosensor DNA with or without RGS/RGSmyc DNA 48 h before imaging as described above. In general, an individual well of a six-well multidish was transfected with 0.5 μg of biosensor DNA alone or cotransfected with 0.5 μg of biosensor DNA and an excess of RGS/RGSmyc DNA (1.5 μg) to ensure that all cells transfected with biosensor were cotransfected with RGS/RGSmyc DNA. Before imaging, the culture medium was replaced with a Krebs-HEPES buffer (KHB) [10 mM HEPES, 4.2 mM NaHCO3, 11.7 mM d-glucose, 1.18 mM MgSO4·7H2O, 1.18 mM KH2PO4, 4.69 mM KCl, 118 mM NaCl, 1.29 mM CaCl2·2H2O, and 0.01% (w/v) BSA, pH 7.4]. Cells were then mounted onto the stage of an Olympus IX50 inverted microscope and maintained at 37°C using a Peltier heated coverslip holder. Confocal imaging of the eGFP-tagged biosensors was monitored using either an Olympus FV500 or an UltraVIEW confocal microscope (PerkinElmer Life and Analytical Sciences, Boston, MA) as described previously (Nash et al., 2002; Witherow et al., 2003). In brief, eGFP was excited using the 488 nm laser line, and the emitted fluorescence was captured at wavelengths >505 nm, with images collected at 1-s intervals. Analysis was carried out using software supplied by the confocal manufacturer (Olympus Fluoview or PerkinElmer Imaging Suite), with raw fluorescence data exported to Microsoft Excel and expressed as F/Fo (eGFP fluorescence/basal eGFP fluorescence) for each cell. For Ca2+ imaging, cells were loaded with fluo-3 in KHB by incubation with fluo-3-acetoxymethyl ester (2 μM prepared in anhydrous dimethyl sulfoxide; TEF Laboratories, Austin, TX) for 45 min at 20°C followed by a further 45-min incubation in KHB to allow de-esterification of the indicator. Measurement of the intracellular Ca2+ concentration ([Ca2+]i) was performed using either an Olympus FV500 or a PerkinElmer UltraVIEW confocal microscope with images collected every second. Analysis and data processing was performed as described previously for eGFP. For imaging experiments, data are reported as the average ± S.E.M. for n cells from at least three individual coverslips.
Measurement of Total PLC Activity. Agonist-induced accumulation of 3H-labeled mono- and polyphosphates of inositol ([3H]InsPx) was determined in cells prelabeled with [myo-3H]inositol in which inositol monophosphatase activity was blocked with Li+. Cells were prelabeled with 3 μCi/ml of [myo-3H]inositol (76 Ci/mmol) for 48 h in 24-well multidishes to ensure equilibrium labeling. On the day of experiments, the media was removed and replaced with 250 μl of KHB supplemented with 10 mM LiCl. After a 10-min incubation, cells were stimulated by the addition of 250 μl of KHB containing Li+ and agonist at twice the required concentration. Stimulations were carried out in triplicate; after a 20-min incubation, reactions were terminated by the addition of an equal volume of 1 M trichloroacetic acid. [3H]InsPx were extracted and separated by anion exchange chromatography exactly as described previously (Wheldon et al., 2001). Experimental data are reported as the mean ±/+ S.E.M. of n experiments.
Data Analysis. In all cases, data are reported as the mean ±/+ S.E.M. for n experiments. For imaging experiments, n refers to the number of cells for each condition taken from n different coverslips. For experiments measuring total PLC activity, n refers to the number of different accumulations. Statistical analysis was carried out using one-way ANOVA; where P was < 0.05, it was followed by Dunnett's range test. In all cases, * represents P < 0.05; **, P < 0.01; and ***, P < 0.001 by the range test.
Results
Transient Expression of myc-Tagged rgs Proteins. To determine the expression of RGS proteins and allow expression at equivalent levels where required, a C-terminal myc-epitope tag was incorporated into the DNA sequence encoding RGS2, RGS3, and RGS4. Expression of the RGSmyc fusion proteins allowed subsequent immunoblotting of the myc-epitope tag (and hence RGS protein) with an anti-myc antibody. In HEK293/M3 cells transiently transfected with plasmid DNAs, the anti-myc antibody recognized proteins at the expected molecular masses for RGS2myc (∼28 kDa), RGS3myc (∼80 kDa), and RGS4myc (∼28 kDa) (Fig. 1). After transfection of either HEK293/M3 cells (Fig. 1) or HEK293/WT cells (data not shown) with identical amounts of plasmid DNAs encoding either RGS2myc, RGS3myc, or RGS4myc, the expression level of RGS3myc (and the LacZ-myc control) was consistently 2- to 3-fold greater than either RGS2myc or RGS4myc.
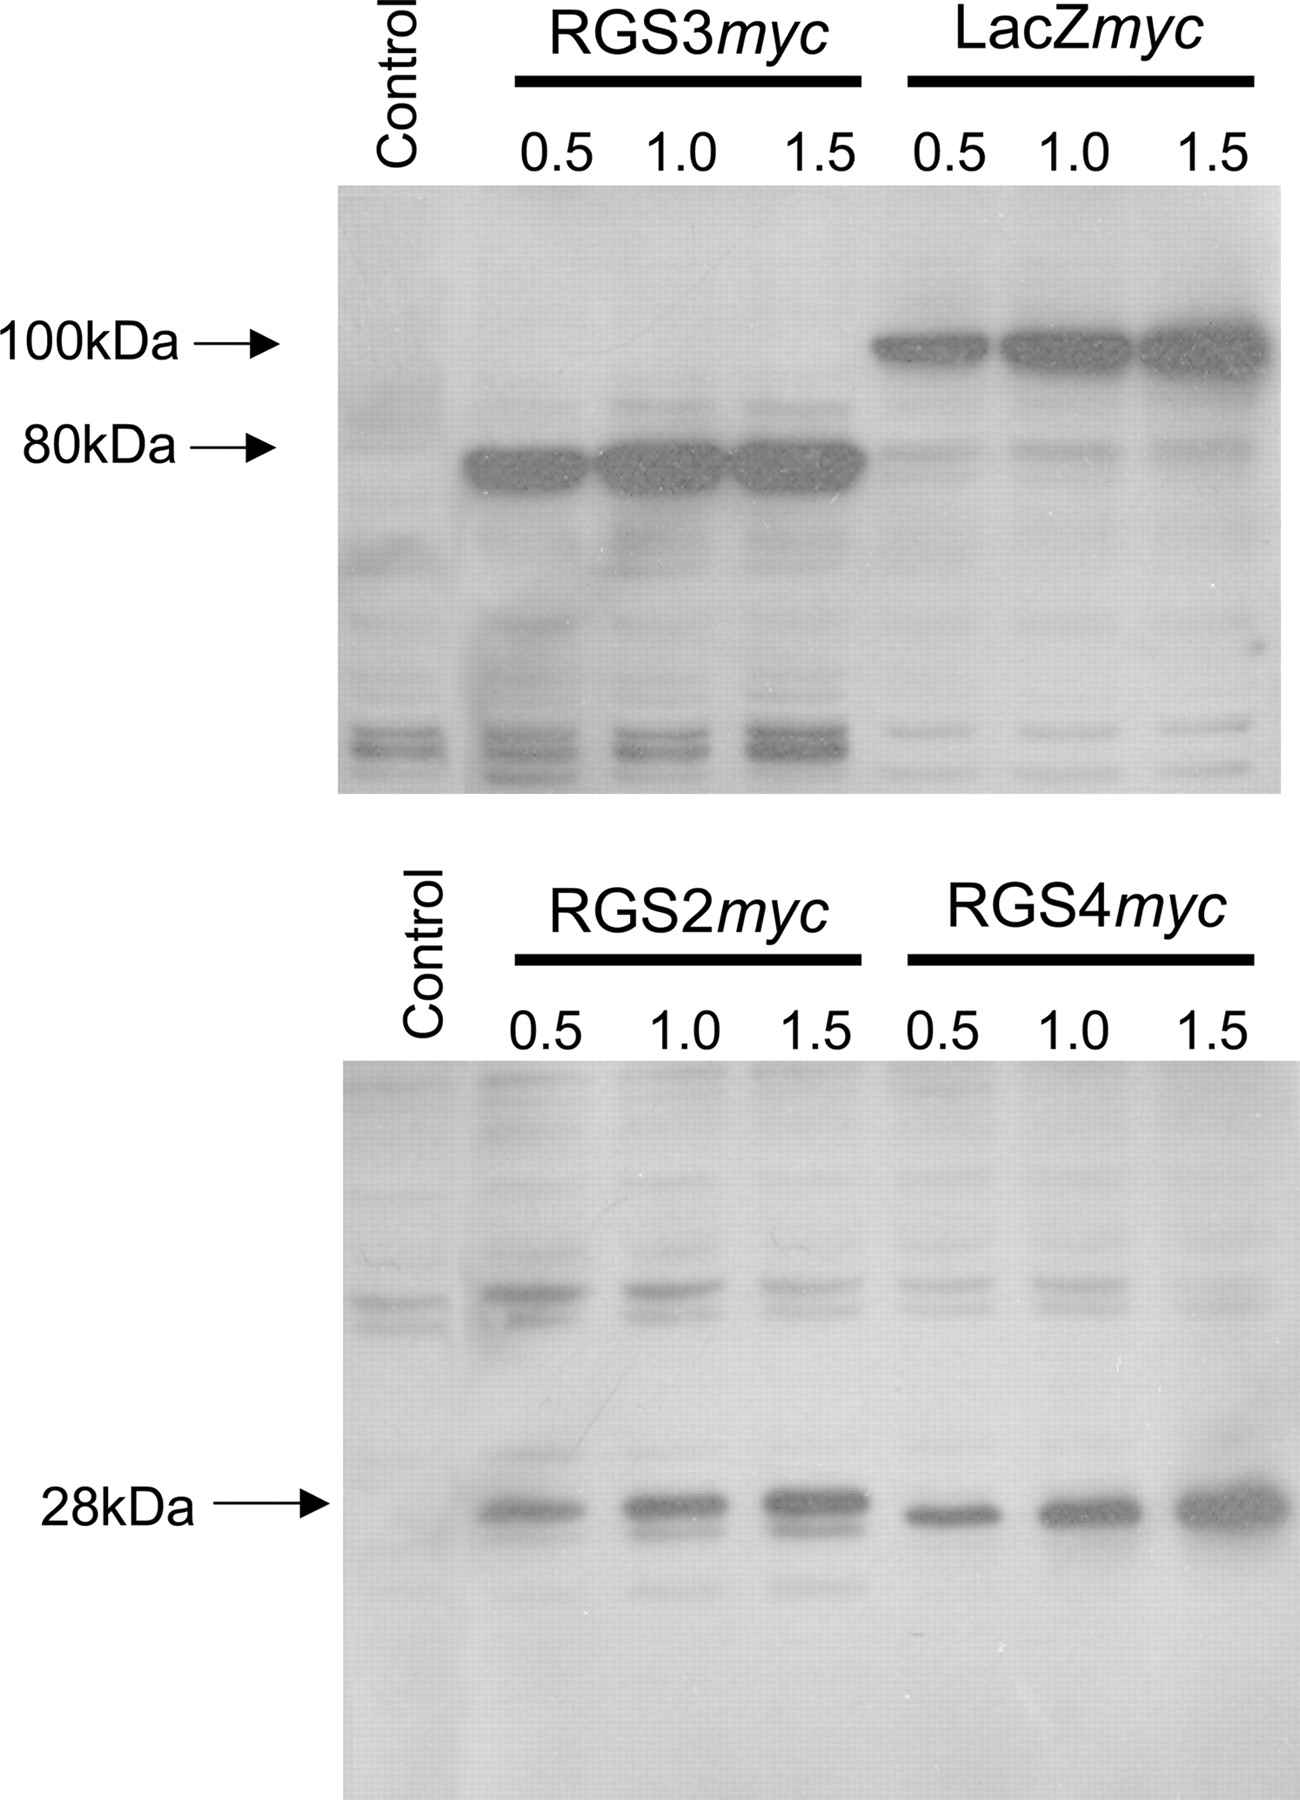
Transient overexpression of myc-tagged RGS proteins. Western blot of HEK293/M3 cell lysates (30 μg of protein/lane), showing the transient over-expression of myc-tagged RGS proteins. The number above each lane corresponds to the amount of RGSmyc DNA transfected. Control lanes are samples from untransfected HEK293/M3 cells. Blots are representative of cell lysates obtained from at least three different transient transfections.
Subcellular Localization of RGS Proteins. To evaluate the subcellular distribution of expressed recombinant RGS proteins, HEK293/M3 cells were transiently transfected with the RGSmyc DNA constructs, and protein localization was determined by immunocytochemistry using an anti-myc primary antibody and a FITC-labeled secondary antibody. The distribution of fluorescence indicated that RGS2myc was expressed at high levels in the nucleus compared with the cytoplasm (Fig. 2a). In contrast, both RGS3myc and RGS4myc were predominantly cytosolic (Fig. 2, b and c). Immunocytochemistry of untransfected cells or addition of the secondary antibody only to transfected cells revealed no cellular staining under conditions identical to those used above (data not shown).
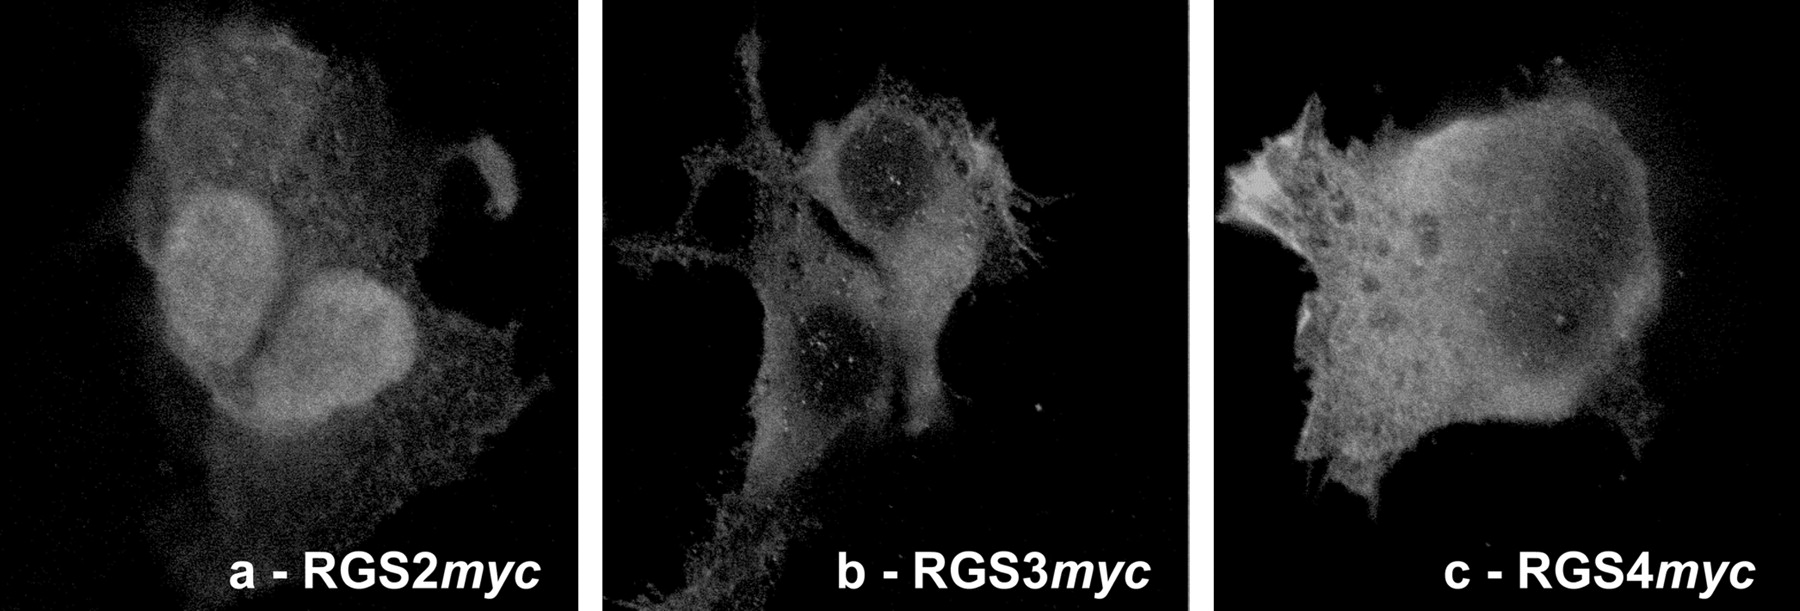
Subcellular localization of RGS proteins. Immunolocalization of RGS2myc, RGS3myc, or RGS4myc transiently overexpressed in HEK293/M3 cells. The myc-tag was detected using an anti-myc antibody, which was subsequently labeled with a FITC-conjugated secondary antibody. Images are typical of at least three different transient transfections and immunolabeling experiments.
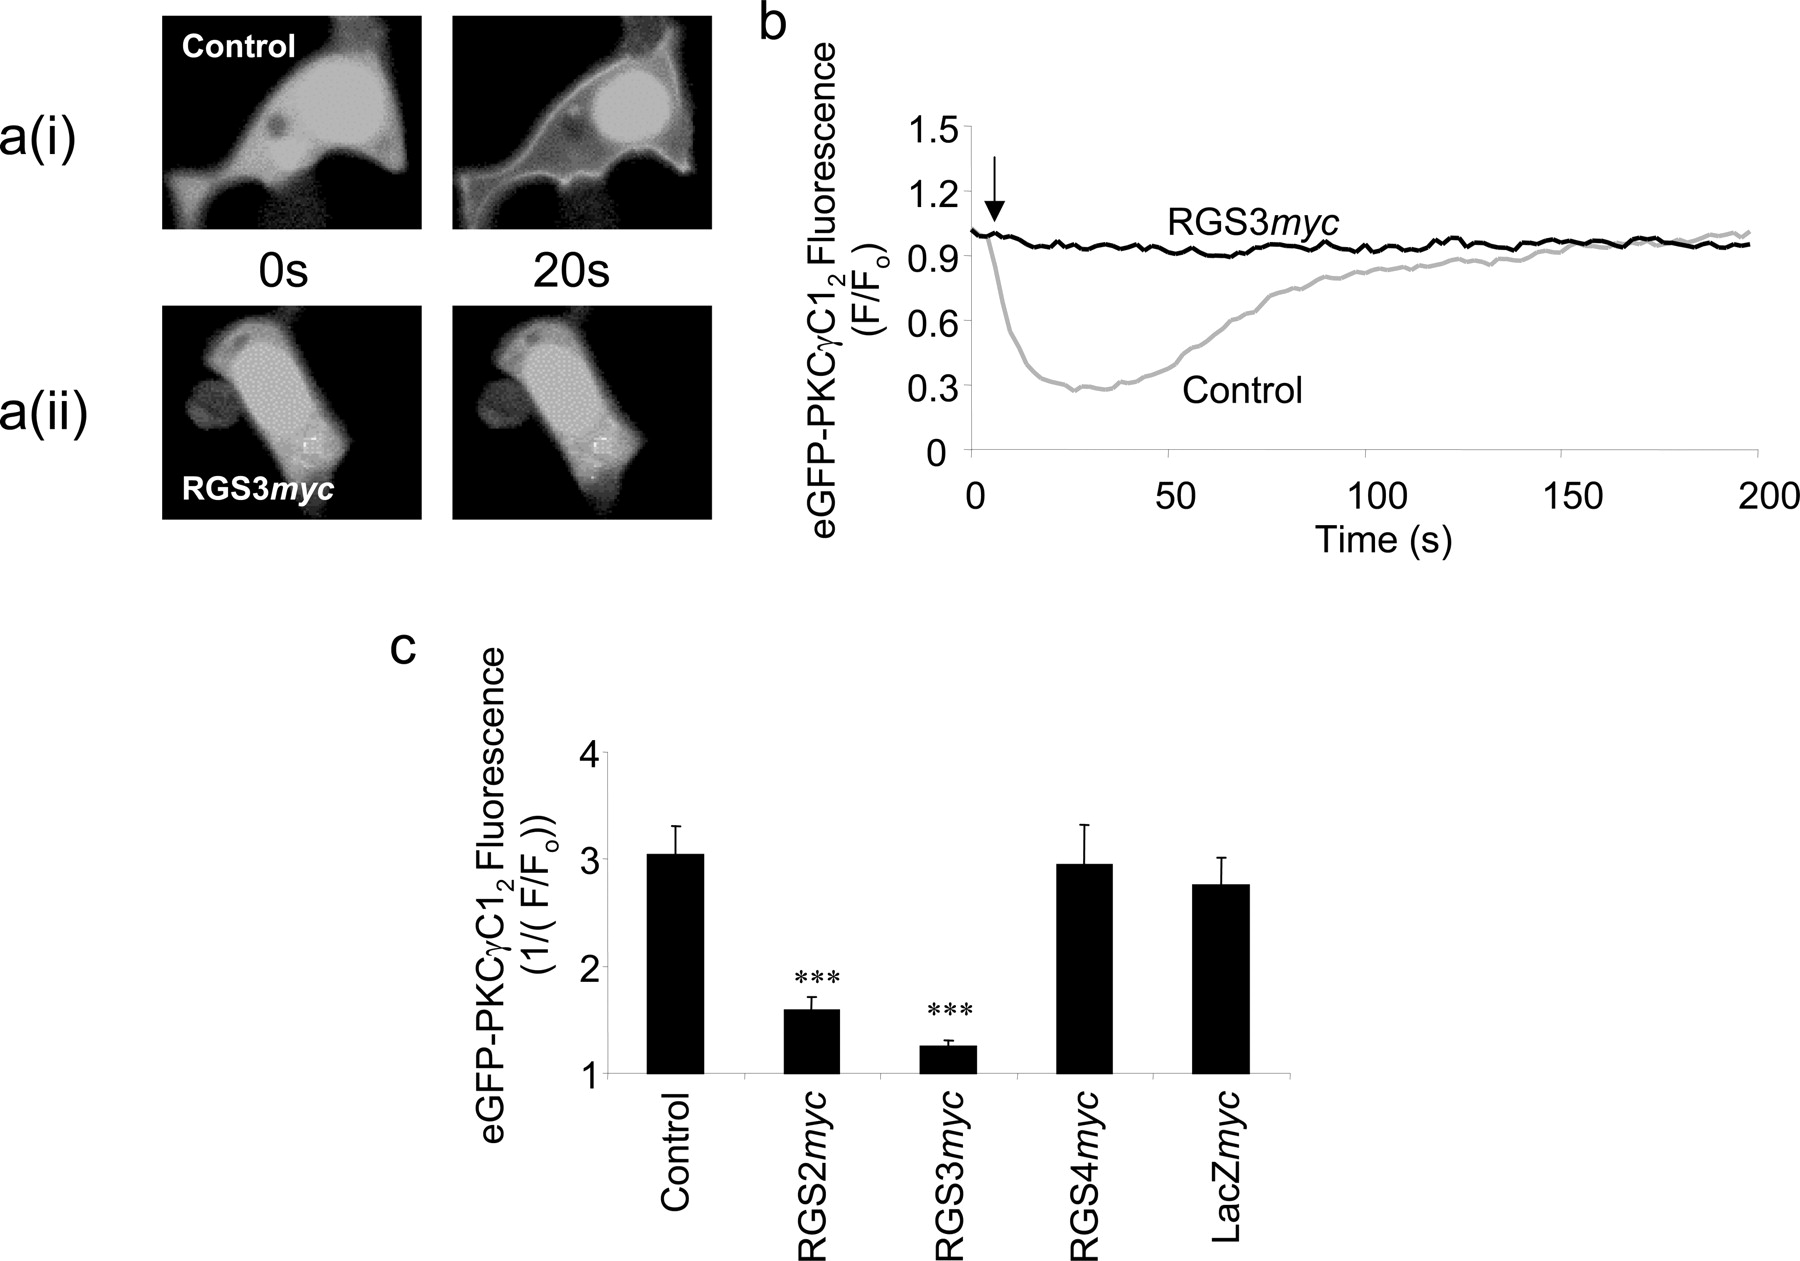
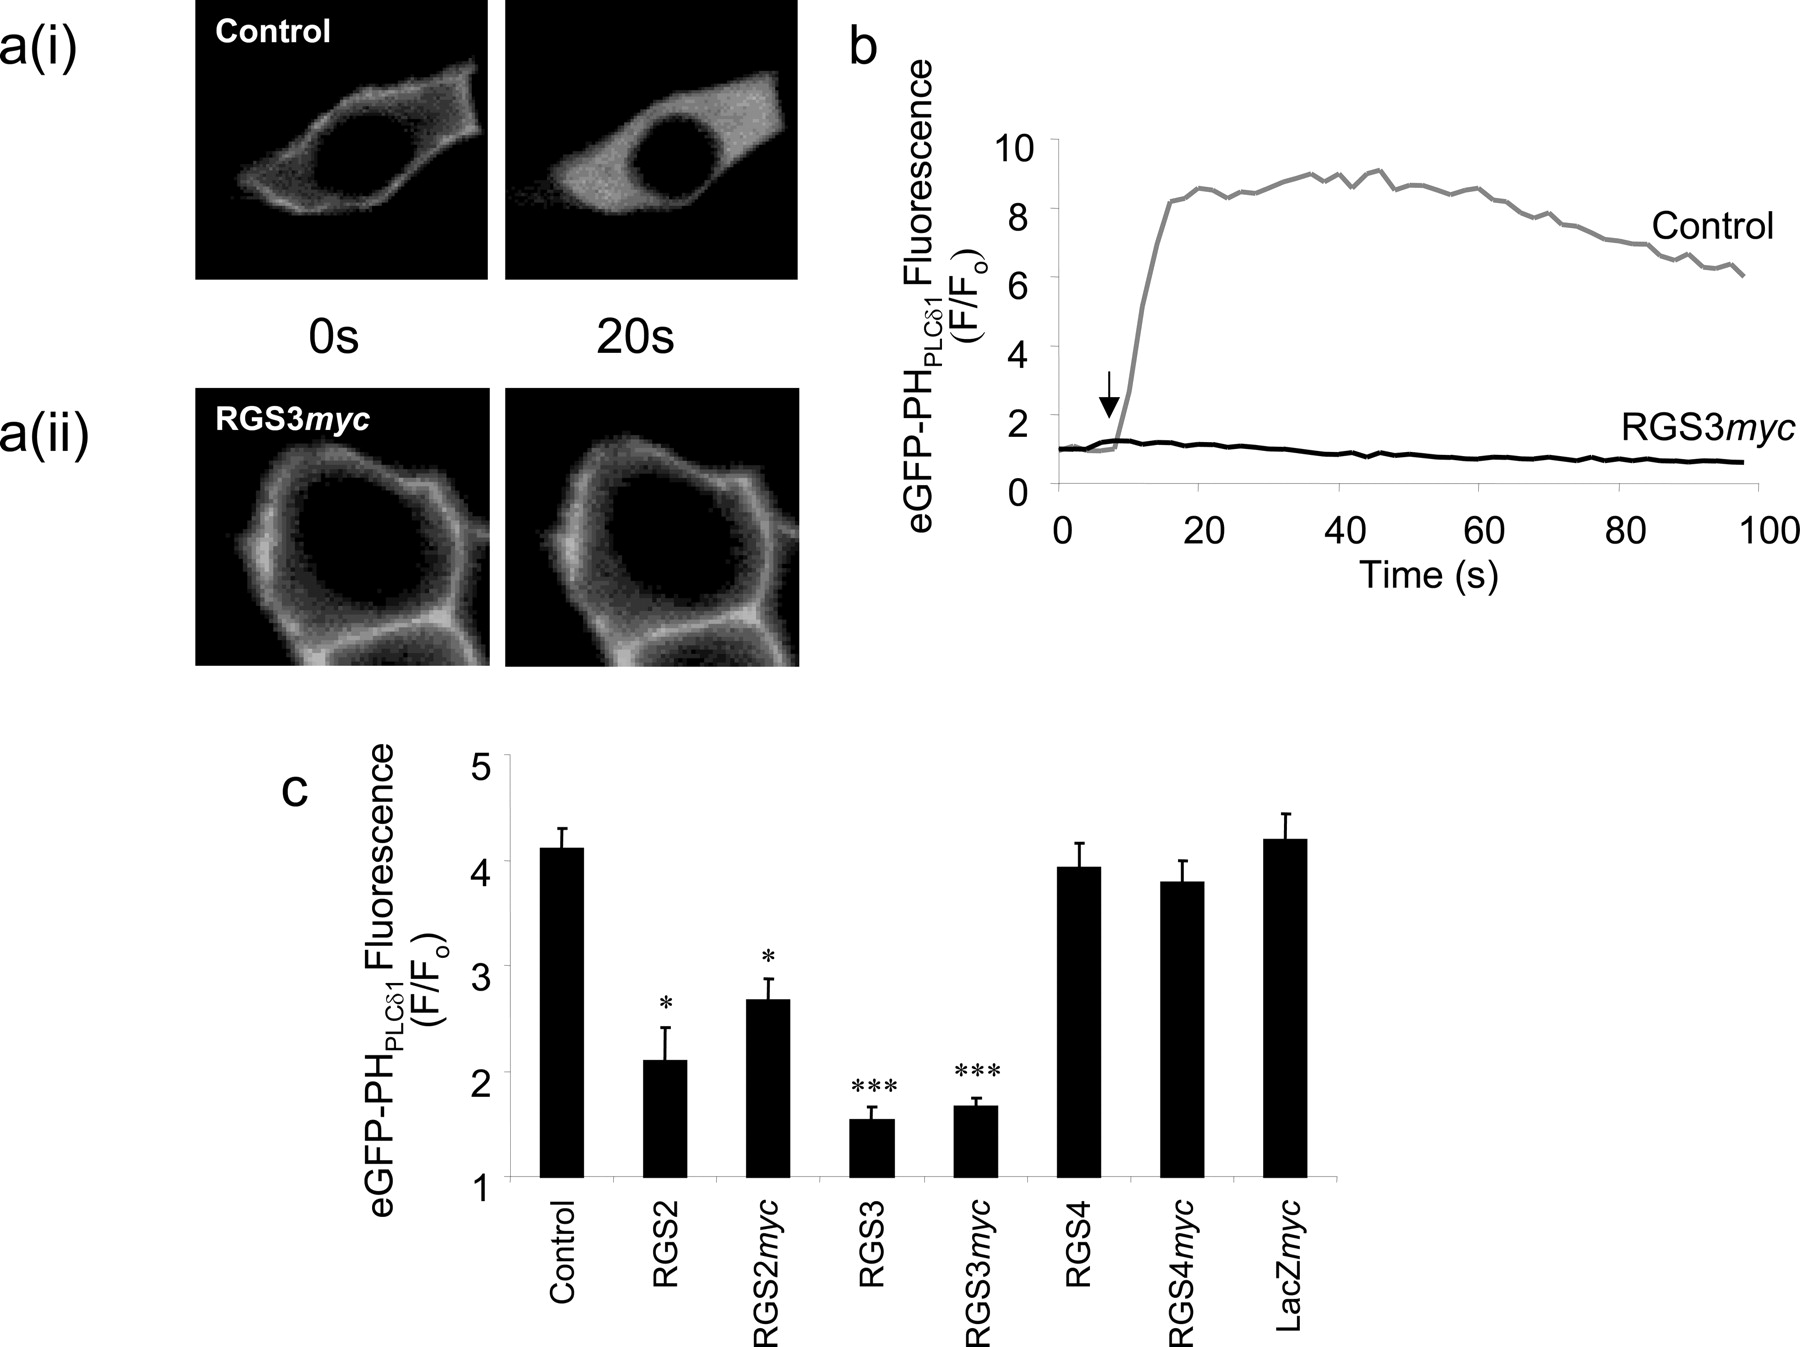
Single-Cell Imaging of Ins(1,4,5)P3 Generation. Protein-based biosensors have recently been developed that can detect the generation of either Ins(1,4,5)P3 (eGFP-PHPLCδ1) or diacylglycerol (eGFP-PKCγC12) in real time at the single-cell level. In this study, we first used eGFP-PHPLCδ1 to determine the ability of either untagged or myc-tagged RGS2, RGS3, and RGS4 to inhibit muscarinic receptor-mediated generation of Ins(1,4,5)P3 in HEK293/M3 cells. In cells transiently transfected with the eGFP-PHPLCδ1 biosensor alone, challenge with 100 μM methacholine resulted in a rapid and robust translocation of eGFP fluorescence from the membrane to the cytoplasm in all cells examined [e.g., Fig. 3a(i)]. Determination of the cytosolic fluorescence indicated a rapid, marked, and sustained increase in the level of cytosolic fluorescence (Fig. 3b) reflective of agonist-mediated Ins(1,4,5)P3 accumulation (Nash et al., 2001, 2002). In contrast, in cells cotransfected with both the eGFP-PHPLCδ1 biosensor and RGS3myc, 100 μM methacholine had no effect on the plasma membrane localization of eGFP fluorescence (Fig. 3, a(ii) and b) demonstrating a marked inhibition of muscarinic receptor-mediated Ins(1,4,5)P3 accumulation. Quantification of the maximal increase in cytosolic fluorescence in the 60 s after agonist addition provides an index of the maximal extent of Ins(1,4,5)P3 accumulation. Data collected over a series of experiments demonstrated that expression of untagged or myc-tagged versions of either RGS2 or RGS3 markedly inhibited Ins(1,4,5)P3 responses to maximal activation of muscarinic receptors in HEK293/M3 cells (Fig. 3c). In contrast, expression of either RGS4 or RGS4myc did not affect the magnitude of Ins(1,4,5)P3 responses to 100 μM methacholine (Fig. 3c).

Single-cell imaging of Ins(1,4,5)P3 production. a(i), typical single-cell confocal images of HEK293/M3 cells transiently transfected with the Ins(1,4,5)P3 biosensor, eGFP-PHPLCδ1. Under resting conditions (0 s), the eGFP-tagged biosensor is localized to the plasma membrane, but upon agonist stimulation (100 μM methacholine), eGFP-PHPLCδ1 translocates to the cytosol (20 s) corresponding to the production of Ins(1,4,5)P3. a(ii), in HEK293/M3 cells transiently cotransfected with eGFP-PHPLCδ1 and RGS3myc, the translocation of the eGFP-tagged biosensor is reduced, corresponding to an inhibition of Ins(1,4,5)P3 production. b, sample traces of the change in cytoplasmic eGFP fluorescence with time upon muscarinic M3 receptor stimulation in HEK293/M3 cells. Traces represent HEK293/M3 cells transiently transfected with either eGFP-PHPLCδ1 alone (upper trace) or cells transiently cotansfected with both eGFP-PHPLCδ1 and RGS3myc (lower trace). The arrow represents the time point for the addition of methacholine (100 μM). c, summary of data from the type of experiments described above. Data represent the mean peak increase in cytoplasmic eGFP fluorescence + S.E.M. for 20 to 40 cells from at least four different coverslips. Statistical comparisons were by one-way ANOVA with Dunnett's range test; *, P < 0.05; ***, P < 0.001 versus control.
The Expression Level of RGS3myc Determines the Extent of Inhibition of Agonist-Mediated Ins(1,4,5)P3 Generation. In the experiments described above, the transient transfection of HEK293/M3 cells with matched levels of DNA for the different RGSmyc constructs resulted in a higher level of expression of RGS3myc compared with either RGS2myc or RGS4myc (Fig. 1). In additional experiments, we therefore reduced the amount of RGS3myc plasmid DNA used in the transfection in an effort to lower the expression level of RGS3myc to levels equivalent with RGS2myc and RGS4myc. Western blotting of cell lysates after transfection demonstrated that reducing the amount of RGS3myc plasmid DNA resulted in a reduced level of RGS3myc expression (Fig. 4a). Densitometric analysis of Western blots indicated that HEK293/M3 cells transfected with 0.5 μg/well of RGS3myc plasmid DNA expressed levels of RGSmyc protein approximately equivalent to those expressed by cells transfected with 1.5 μg/well of either RGS2myc or RGS4myc DNA (data not shown). Functional experiments with eGFP-PHPLCδ1 demonstrated that with increasing amounts of transfected RGS3myc plasmid DNA, the degree of inhibition of Ins(1,4,5)P3 production increased (Fig. 4b). At a concentration of 0.5 μg/well of RGS3myc plasmid DNA, there was partial (∼50%) inhibition of Ins(1,4,5)P3 accumulation in response to a maximal concentration of methacholine (100 μM) but a complete inhibition of signaling in response to a submaximal (∼EC50) concentration of methacholine (1 μM) (Fig. 4b). One consideration is that at lower amounts of RGS3myc plasmid DNA, there were fewer cells expressing both the eGFP-PHPLCδ1 biosensor and RGS3myc. However, in similar studies in which we varied the amount of RGS3myc plasmid DNA, the proportion of cells expressing RGS3myc, as assessed by immunocytochemistry, were similar (data not shown). Furthermore, in the functional studies using the eGFP-PHPLCδ1 biosensor, there was no evidence for the emergence of two distinct populations of cells (i.e., those in which signaling was inhibited and those in which it was not) (Fig. 4c). Concentration-response curves for methacholine-mediated membrane to cytosol translocation of the eGFP-PHPLCδ1 biosensor demonstrated that the expression of either LacZmyc or RGS4myc (1.5 μg of plasmid DNA/well) did not affect agonist-mediated Ins(1,4,5)P3 accumulation (Fig. 5). This was reflected in Emax values and pEC50 values that were not significantly different from those in cells transfected with the biosensor alone [pEC50 values: control, 6.4 ± 0.1 (n = 3); LacZmyc, 6.1 ± 0.1 (n = 3); RGS4myc, 6.3 ± 0.3 (n = 3)]. The expression of RGS2myc and RGS3myc (1.5 μg of plasmid DNA/well), however, did reduce the Emax of methacholine-mediated Ins(1,4,5)P3 accumulation (Fig. 5). The extent of the inhibitory effect of RGS3myc was dependent upon the level of expression. Thus, when the expression levels of RGS2myc and RGS3myc were matched (by reducing the RGS3myc plasmid DNA to 0.5 μg of plasmid DNA/well), the extent of inhibition by RGS2myc and RGS3myc were approximately equivalent (Fig. 5). Although both RGS2myc and RGS3myc reduced the Emax of responses, agonist potency was unaffected compared with controls [pEC50 values: RGS2myc, 6.4 ± 0.1 (n = 3); RGS3myc 0.5 μg of plasmid DNA/well, 6.3 ± 0.3 (n = 3); RGS3myc 1.5 μg of plasmid DNA/well, 5.8 ± 0.1 (n = 3)]. In addition to inhibiting the magnitude of muscarinic receptor-mediated Ins(1,4,5)P3 responses, RGS2myc and RGS3myc inhibited the rate of Ins(1,4,5)P3 generation at both submaximal (1 μM) and maximal (100 μM) concentrations of methacholine, as implied by reductions in the rate of change of the cytosolic fluorescence (Table 1). Although RGS4myc did not influence the maximal change in cytosolic fluorescence at any concentration of methacholine, it did reduce the rate of change at both submaximal and maximal concentrations of methacholine (Table 1).

Decreasing RGS3myc expression relieves inhibition of Ins(1,4,5)P3 generation. a, immunoblot showing increasing transient expression of RGS3myc in HEK293/M3 cells with increasing amounts of RGS3myc DNA. The blot is representative of blots from three different transient transfections. b, increasing the level of RGS3myc expression in HEK293/M3 cells leads to a decreased level of Ins(1,4,5)P3 production. Data represent the mean change in peak cytoplasmic eGFP fluorescence + S.E.M. for 20 to 30 cells from at least three different coverslips. c, scatter plot of data from b (100 μM methacholine).

The effect of RGSmyc protein expression on the concentration-dependence of methacholine-mediated Ins(1,4,5)P3 generation. Concentration-response curves (0.01-100 μM methacholine) for single-cell Ins(1,4,5)P3 production in control HEK293/M3 cells and HEK293/M3 cells transiently transfected with either RGS2myc, RGS3myc, RGS4myc, or a LacZmyc control vector. Data represent the mean change in cytoplasmic eGFP fluorescence + S.E.M. for 20 to 30 cells from at least three different coverslips.
Kinetics of increases in cytosolic fluorescence in response to agonist stimulation in HEK/M3 cells expressing the Ins(1,4,5)P3 biosensor, eGFP-PHPLCδ1
Cells transiently transfected with eGFP-PHPLCδ1 either alone (control) or with an RGSmyc construct or with a control vector (LacZmyc), were imaged by confocal microscopy and challenged with either 1 or 100 μM methacholine. Data are presented as 1/rise time (s−1), where the rise time was taken to be the time to reach a peak response from the initial point of inflection. Data are mean ± S.E.M., with the number of cells analyzed in parentheses. Statistical comparisons were by one-way ANOVA with Dunnett's range test.
Single-Cell Imaging of Diacylglycerol Production. To assess the potential impact of the RGS proteins on the other limb of the signaling pathway resulting from PLC-mediated hydrolysis of phosphatidylinositol 4,5-bisphosphate, and to confirm that the effects were not specific to the eGFP-PHPLCδ1 biosensor, we next assessed the effects of RGSmyc proteins on muscarinic receptor-mediated diacylglycerol production using the eGFP-PKCγC12 biosensor. Transient transfection of eGFP-PKCγC12 in HEK293/M3 cells resulted in the expression of cytosolic fluorescence that translocated to the plasma membrane upon addition of 100 μM methacholine in all cells (Fig. 6a(i)). Determination of the cytosolic fluorescence showed that the agonist-mediated loss of cytosolic fluorescence occurred immediately on agonist addition, was maximal by approximately 20 s but largely restored over the subsequent 140 s despite the continued presence of methacholine (Fig. 6b). The coexpression of RGS3myc with the eGFP-PKCγC12 biosensor abolished the cytosol to membrane translocation of eGFP fluorescence upon addition of 100 μM methacholine (Fig. 6, a(ii) and b), indicating marked inhibition of diacylglycerol accumulation. The expression of RGS2myc also significantly inhibited translocation of eGFP fluorescence in response to 100 μM methacholine (Fig. 6c). In contrast, expression of RGS4myc did not influence the response (Fig. 6c).
Single-cell imaging of diacylglycerol production. a(i), typical single-cell confocal images of HEK293/M3 cells transiently transfected with the diacylglycerol biosensor eGFP-PKCγC12. Under resting conditions (0 s), the eGFP-tagged biosensor is localized homogeneously across the cell cytoplasm and nucleus, but upon agonist stimulation (100 μM methacholine), the eGFP translocates to the plasma membrane (20 s) corresponding to the production of diacylglycerol. a(ii), in HEK293/M3 cells transiently cotransfected with both eGFP-PKCγC12 and RGS3myc, the translocation of the eGFP-tagged biosensor is reduced, corresponding to an inhibition of diacylglycerol production. b, sample traces of the change in cytoplasmic eGFP fluorescence with time upon muscarinic M3 receptor stimulation in HEK293/M3 cells. Traces represent HEK293/M3 cells transiently transfected with eGFP-PKCγC12 alone (lower trace) and cells transiently cotransfected with both eGFP-PKCγC12 and RGS3myc (upper trace). The arrow represents the time point for the addition of methacholine (100 μM). c, summary of data from the type of experiments described above. Data represent the mean + S.E.M. for 13 to 30 cells from at least three different coverslips. Statistical comparisons were by one-way ANOVA with Dunnett's range test; ***, P < 0.001 versus control.
Generation of HEK293 Cell Lines with Stable Expression of RGSmyc Proteins. To overcome the limitations of transient transfection protocols (e.g., potentially variable transfection efficiency and a limited ability to carry out population-based measurements), we generated HEK293 cell lines with stable expression of RGS2myc, RGS3myc, or RGS4myc. Transfection of HEK293/WT cells with RGSmyc plasmid DNAs resulted in the generation of cell lines from which single clones of cells expressing either RGS2myc (HEK293/RGS2myc), RGS3myc (HEK293/RGS3myc), or RGS4myc (HEK293/RGS4myc) were selected on the basis of similar expression levels of the myc-tagged proteins (Fig. 7a). HEK cells endogenously express the muscarinic M3 receptor (Ancellin et al., 1999). After selection, the expression of endogenous muscarinic receptors was assessed using [N-methyl-3H]scopolamine methyl chloride binding to intact cells. Each of the cell lines had expression levels similar to HEK293/WT (∼40 fmol/mg of total cell protein; data not shown). Furthermore, levels of Gαq/11 were similar as assessed by immunoblotting with a previously characterized antibody (Mitchell et al., 1991) (data not shown). Immunocytochemistry demonstrated that the subcellular distribution of the stably expressed RGSmyc proteins was identical to their distribution when expressed transiently (see Fig. 2).
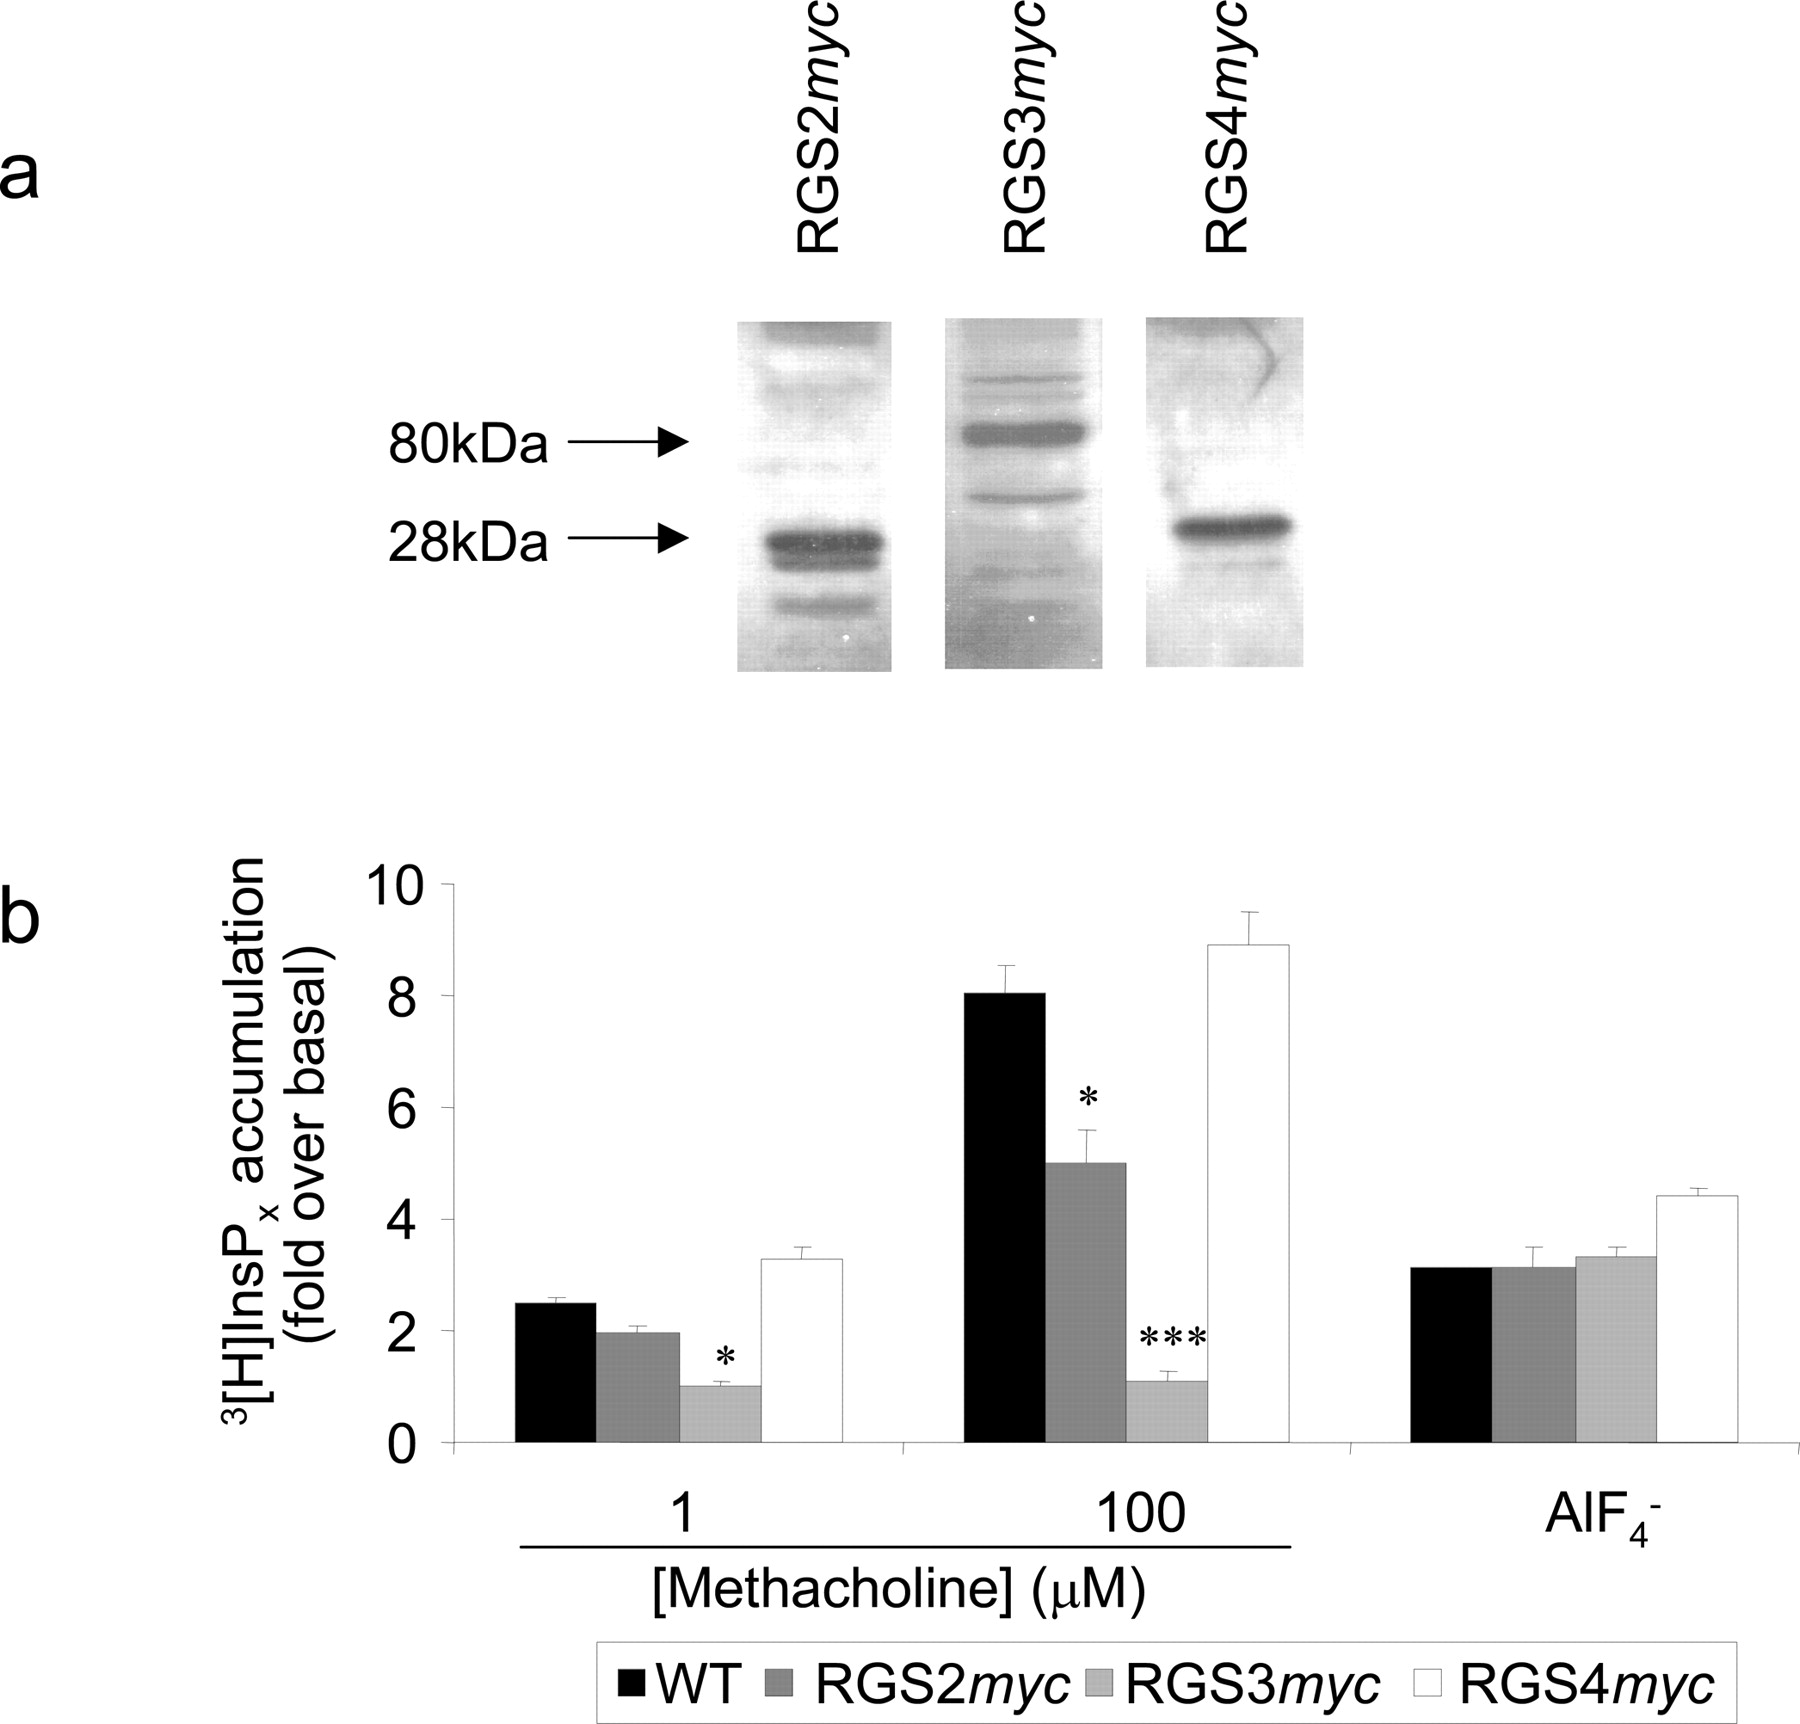
Generation of stable RGSmyc expression in HEK293 cells. a, Western blot of whole cell lysates (20 μg of protein/lane) from HEK293 cells illustrating stable expression of either RGS2myc, RGS3myc, or RGS4myc. The blot is representative of at least three different blots for each cell line. b, total inositol phosphate ([3H]InsPx) accumulation under a Li+ block in HEK293/WT, HEK293/RGS2myc, HEK293/RGS3myc, and HEK293/RGS4myc cells. Data are shown for stimulation of the endogenous muscarinic M3 receptor with either 1 or 100 μM methacholine and also for receptor-independent activation of G-proteins with  (50 mM NaF; 50 μM AlCl3). Data are represented as the mean + S.E.M. for at least three separate accumulations. Statistical comparisons were by oneway ANOVA with Dunnett's range test; *, P < 0.05; ***, P < 0.001 versus control.
Receptor- and  -Mediated PLC Activity in Cell Lines That Have Stable Expression of RGSmyc Proteins. Transfection of the eGFP-PHPLCδ1 biosensor plasmid DNA into HEK/WT cells results in the expression of membrane-localized fluorescence identical to that seen in HEK293/M3 cells. However, activation of the endogenously expressed muscarinic receptors with 100 μM methacholine caused little or no membrane-to-cytosol translocation in these cells. This is consistent with a lack of methacholine-mediated accumulation of Ins(1,4,5)P3 mass in populations of these cells (data not shown) measured using a well characterized radioreceptor assay (Willars and Nahorski, 1995). In contrast, 100 μM methacholine evoked an accumulation of [3H]InsPx against a Li+-block of inositol monophosphatase in these cells. Accumulation of [3H]InsPx in such experiments is independent of the metabolism of Ins(1,4,5)P3 and reflects total PLC activity (Willars et al., 1998a,b). A 20-min stimulation of HEK293/WT cells with either 1 or 100 μM methacholine resulted in a 2.5 ± 0.1 (n = 5) and 8.1 ± 0.5 (n = 5) fold-over basal accumulation of [3H]InsPx, respectively (Fig. 7b). The extent of accumulation was similar in cells expressing RGS4myc but significantly reduced in cells expressing RGS2myc and essentially abolished in cells expressing RGS3myc (Fig. 7b). The direct stimulation of G-proteins with aluminum fluoride (
 ) also caused a 3.1 ± 0.1-fold (n = 3) increase over basal accumulation of [3H]InsPx over a 30-min period (Fig. 7b). This
  -mediated accumulation of [3H]InsPx, however, was unaffected by the expression of RGS2myc, RGS3myc, or RGS4myc in the clonal cell lines (Fig. 7b).
The Effect of RGS Proteins on the Amplitude, Kinetics, and Pattern of Receptor-Mediated Ca2+ Signals. Single-cell imaging of intracellular Ca2+ signaling in HEK293/WT cells revealed that low concentrations of methacholine (1 μM) caused repetitive whole-cell Ca2+ oscillations that subsided gradually with time and in which the [Ca2+]i returned to approximately basal levels between oscillations (Fig. 8a(i)). In cells expressing either RGS2myc, RGS3myc, or RGS4myc, there were significant reductions in both the magnitude of the initial Ca2+ response (Figs. 8, a(i-iv), and 9a) and the rise-time of the initial peak (Fig. 9b) in response to this submaximal concentration of methacholine (1 μM). Expression of the RGS proteins was also associated with a dampening of the magnitude and frequency of subsequent oscillations (Figs. 8, a(i-iv) and 9c). A higher concentration of methacholine (100 μM) resulted in more robust Ca2+ signaling in HEK293/WT cells (Fig. 8, compare a(i) and b(i)). The majority of cells responded with a rapid peak of Ca2+ elevation followed by a more sustained phase, although some cells oscillated around this elevated level. In cells expressing either RGS2myc or RGS3myc, there were significant reductions in the amplitude and rise-time of the initial peak response (Fig. 9, a and b). However, expression of these RGS proteins resulted in an increase in oscillatory behavior (Figs. 8, b(i-iii), and 9c). RGS4myc affected neither the amplitude nor the rise time of the initial peak Ca2+ response to 100 μM methacholine (Figs. 8, b(i) and b(iv), and 9, a and b), although a slight increase in oscillatory behavior was observed (Fig. 8, b(i) and b(iv)).
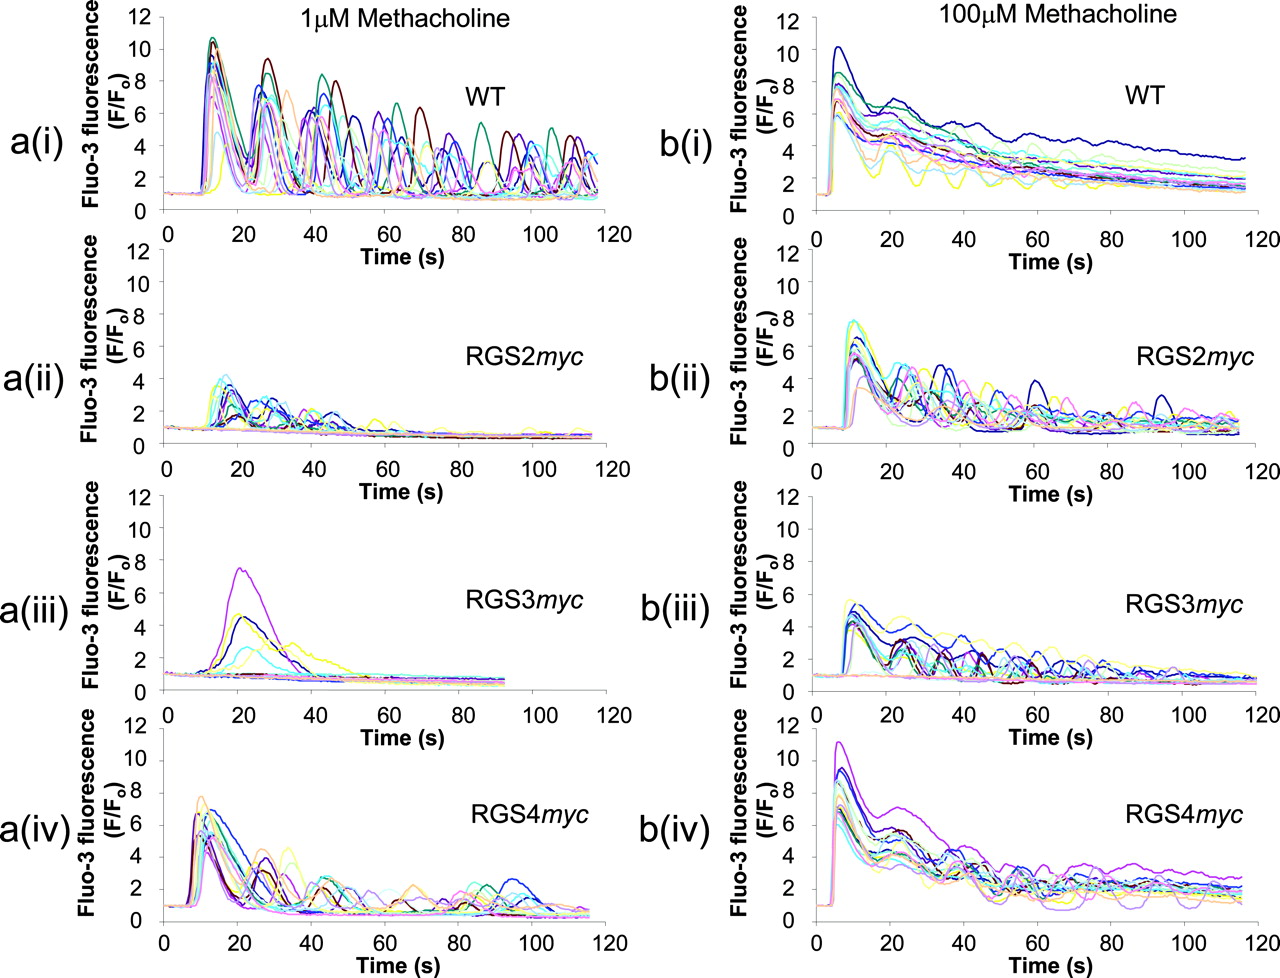
RGS proteins alter the amplitude, kinetics, and pattern of Ca2+ signals generated by Gαq/11-coupled receptors. a (i-iv), sample traces of Ca2+ responses seen in fluo-3 loaded cells [HEK293/WT (i), HEK293/RGS2myc (ii), HEK293/RGS3myc (iii), and HEK293/RGS4myc (iv)] in response to stimulation of the endogenous muscarinic M3 receptor with a submaximal concentration of methacholine (1 μM). b(i-iv), sample traces as described in a(i-iv), but using a maximal concentration of methacholine (100 μM) as the stimulus. The traces illustrate responses from 15 to 20 cells from one field of view and are typical of traces obtained from at least four different coverslips.

RGS proteins alter the amplitude, kinetics and pattern of Ca2+ signals generated by Gαq/11-coupled receptors: summary data. a, the effect of RGSmyc protein expression on the amplitude of the initial Ca2+ transient generated in response to stimulation with either 1 or 100 μM methacholine. b, the effect of RGS protein expression on the kinetics of the initial Ca2+ response upon stimulation with 1 or 100 μM methacholine. Data are plotted as 1/rise time (s-1), where the rise time was taken to be the time to reach a peak response from the initial point of inflection. c, the effect of RGS protein expression on Ca2+ oscillations generated in response to prolonged agonist stimulation (1 or 100 μM methacholine). Data represent the number of oscillations seen during a 60-s period after the initial Ca2+ response. d, the effect of RGS protein expression on the amplitude of the initial Ca2+ signal generated in response to stimulation of endogenous P2Y2 receptors with 100 μM UTP. In all cases, the data represent the mean + S.E.M. for between 40 and 100 cells from at least four different coverslips. In a and d, data are expressed as the percentage response relative to control (HEK293/WT cells). Statistical comparisons were by one-way ANOVA with Dunnett's range test; ***, P < 0.001 versus control.
RGS Proteins Inhibit Ca2+ Signals Mediated by the Endogenous Gαq/11-Coupled P2Y2 Receptor. There is some evidence that RGS proteins are selective among different receptor types that couple to Gαq/11 (Zeng et al., 1998; Xu et al., 1999), and recent evidence has suggested that this may be a consequence of interactions between the GPCR and RGS protein (Bernstein et al., 2004). HEK293 cells also express endogenous P2Y2 nucleotide receptors that couple to Gαq/11 (Werry et al., 2002), and we therefore carried out a preliminary investigation of the impact of RGS protein expression on signaling by these receptors. Stimulation of P2Y2 nucleotide receptors with a maximal concentration of UTP resulted in [Ca2+]i responses similar to those seen with 100 μM methacholine (data not shown). UTP-mediated Ca2+ signaling was also inhibited by expression of RGS2myc and even more so by RGS3myc as judged by reductions in the amplitude of the initial peak response (Fig. 9d). However, RGS4myc had no effect on the Ca2+ responses to this maximal concentration of UTP (Fig. 9d).
The Effect of RGS Proteins on  -Medicated CA2+ Signaling. After addition of
  to HEK293/WT cells, there was a lag period of 105 ± 8 s (n = 15) before the appearance of baseline Ca2+ oscillations (Fig. 10a) that were similar to those evoked by a low concentration (1 μM) of methacholine (Fig. 8a(i)). The amplitude of the initial Ca2+ response to
  was not significantly affected by the expression of the RGSmyc proteins (Fig. 10, b and c). Furthermore, oscillation frequency was not affected [HEK293/WT, 1.69 ± 0.09 oscillations in 100 s (n = 48); RGS2myc, 1.67 ± 0.14 oscillations in 100 s (n = 30); RGS3myc, 1.74 ± 0.07 oscillations in 100 s (n = 38); and RGS4myc, 1.54 ± 0.08 oscillations in 100 s (n = 48)]. However, the lag phase between the addition of
  and the first Ca2+ response was significantly longer in the RGSmyc-expressing cell lines [RGS2myc, 173 ± 5 s (n = 27); RGS3myc, 218 ± 8 s (n = 15); RGS4myc, 177 ± 6 s (n = 44); all P < 0.001 versus HEK293/WT cells].

RGS proteins do not alter the amplitude or pattern of Ca2+ signals generated by direct stimulation of G-proteins with  . a and b, sample traces of Ca2+ transients evoked by
  stimulation of HEK293/WT and HEK293/RGS3myc cells, respectively. c, the effect of RGS protein expression on the amplitude of the initial Ca2+ signal generated in response to receptor-independent stimulation of G-proteins with
  . Data represent the mean + S.E.M. for between 40 and 100 cells from at least four different coverslips.
The Effect of RGS Proteins on PLC Signaling Mediated by Constitutively Active Gαq. Next, we sought to establish the impact of RGSmyc protein expression on signaling mediated by a CA-Gαq (Q209L) that is insensitive to the GTPase activity of RGS proteins (Heximer et al., 2001). In HEK293/WT cells transiently transfected with CA-Gαq (0.25 μg/well of a 24-well multidish), the addition of 10 mM Li+ to block inositol monophosphatase activity for 20 min resulted in a 3.6 ± 0.4-fold (n = 3) increase in [3H]InsPx accumulation compared with control, untransfected cells. Addition of Li+ to cells with transient expression of CA-Gαq and stable expression of one of the RGSmyc proteins also resulted in the accumulation of [3H]InsPx (Fig. 11). The accumulation of [3H]InsPx was significantly greater in cell lines expressing either RGS2myc or RGS3myc compared with either HEK293/WT cells or cells expressing RGS4myc (Fig. 11).
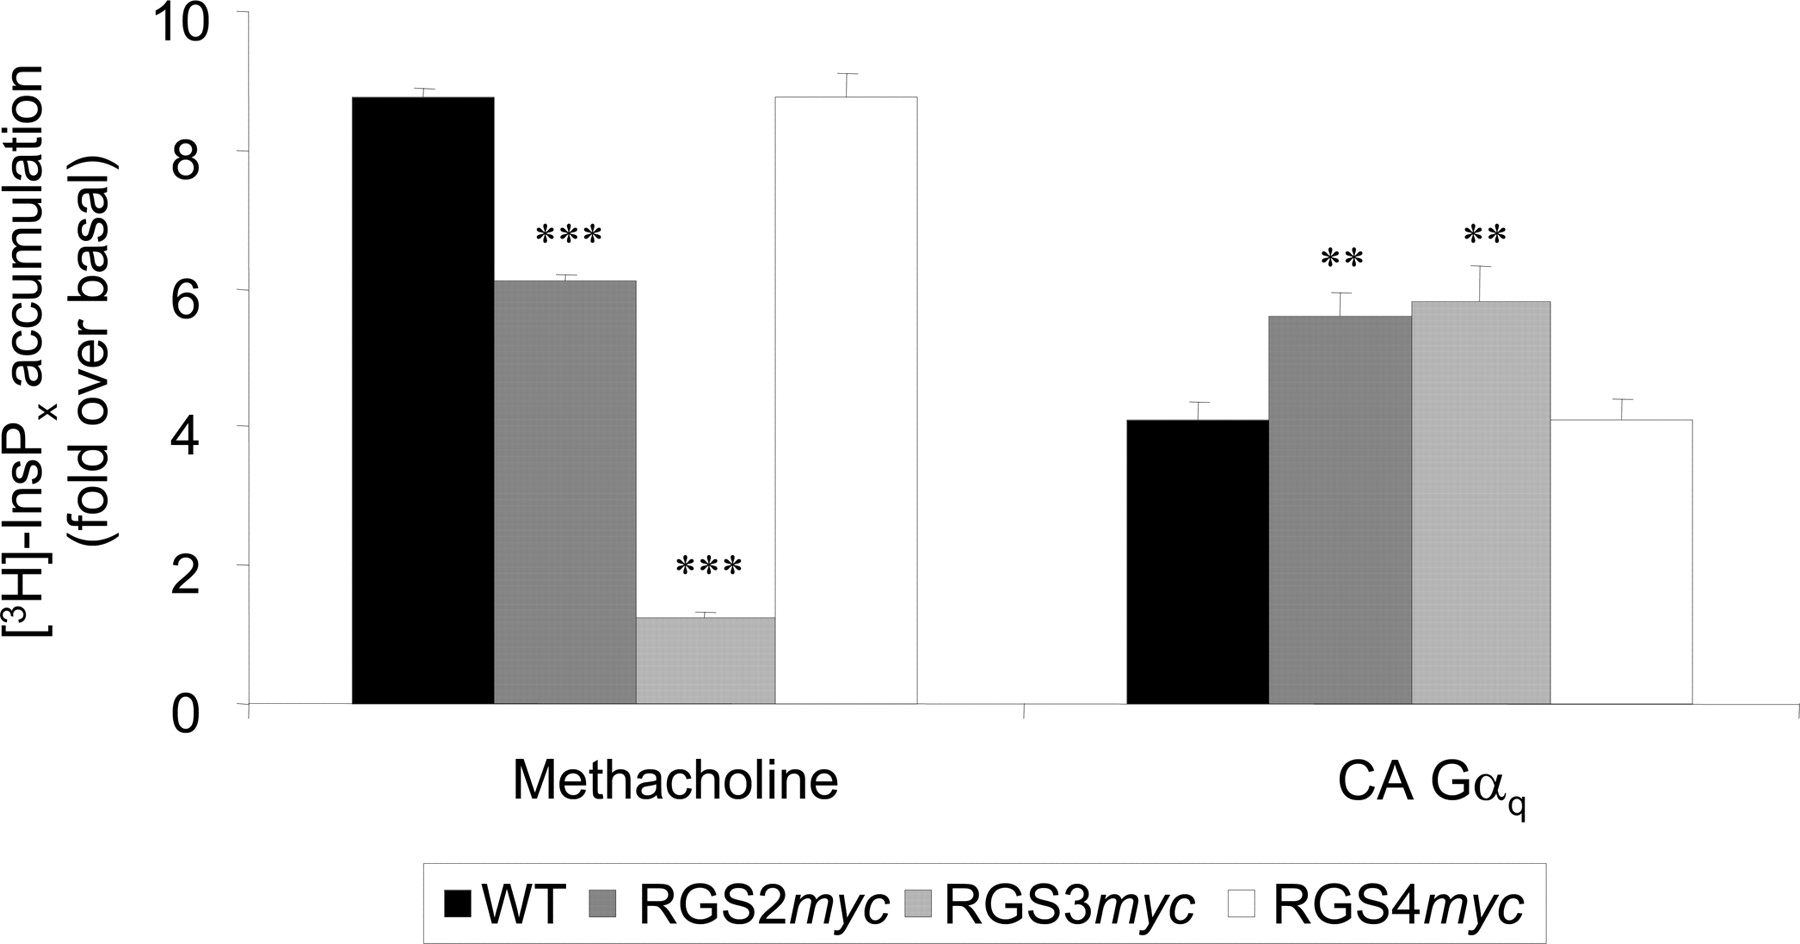
The effect of RGS proteins on the activity of a constitutively active form of Gαq (CA-Gαq). The accumulation of [3H]InsPx in HEK293/WT, HEK293/RGS2myc, HEK293/RGS3myc, and HEK293/RGS4myc transiently transfected with CA-Gαq. Data represent the increase in [3H]InsPx accumulation over a 20-min period under Li+-block in transfected cells compared with untransfected cells. Data are expressed as the mean + S.E.M. for three separate accumulations. Statistical comparisons were by one-way ANOVA with Dunnett's range test; **, P < 0.01; ***, P < 0.001 versus control.
Discussion
In this study, we compared the abilities of members of the B/R4 family of RGS proteins to inhibit Ca2+ and phosphoinositide signaling by Gαq/11-coupled muscarinic receptors. We selected RGS4 as the prototypical member of the B/R4 family along with RGS2, given its high specificity for Gαq (Heximer et al., 1997). We also selected RGS3, in that although its RGS domain has high homology with other family members, it is atypical in that it has a large N terminus of unknown function (Hollinger and Hepler, 2002). Previous studies suggest that each of these RGS proteins influence Gαq/11 signaling (Hollinger and Hepler, 2002) and that RGS2 and RGS4 have different inhibitory activities (Heximer et al., 1997).
In the present study, we used single-cell imaging techniques to enable a more precise understanding of the influence of the RGS proteins on the magnitude and kinetics of signaling. In particular, this has allowed the determination of the effects of RGS proteins on PLC-mediated signaling in the seconds immediately after receptor activation. This is of considerable importance given that the vast majority of PLC-coupled GPCRs undergo either full or partial desensitization within seconds of agonist addition, most probably through receptor phosphorylation. The muscarinic M3 receptor is a well-studied example of such a receptor; it has an initial, rapidly desensitized component of signaling followed by a sustained, desensitization-resistant phase. Many previous studies examining the effects of RGS proteins on PLC have determined inositol phosphate accumulation against a Li+-block of inositol monophosphatase over many minutes. This will neither reflect the levels of the second messenger, Ins(1,4,5)P3, nor reflect the impact of RGS proteins on the immediate, probably physiologically relevant phase of receptor activation. Furthermore, the initial and sustained phases of receptor signaling can be driven with different agonist potencies (Willars and Nahorski, 1995) and are clearly subject to different regulatory features.
RGS2 and RGS3 inhibited both the magnitude and rate of the immediate, agonist-induced Ins(1,4,5)P3 generation in single cells during maximal receptor activation as assessed using the eGFP-PHPLCδ1 biosensor. In contrast, RGS4 had no effect on the magnitude but more subtly reduced the rate of generation. It is noteworthy that the effects of the myc-tagged and untagged RGS proteins were identical. This is consistent with other studies in which RGS2 and RGS4 have been similarly tagged without consequence (Srinivasa et al., 1998; Heximer et al., 1999).
Although muscarinic receptor-mediated Ins(1,4,5)P3 accumulation was inhibited in the order RGS3 > RGS2 > RGS4, immunoblotting showed RGS3myc expression was greater than either RGS2myc or RGS4myc. It is interesting that untagged versions showed levels of inhibition similar to those of their myc-tagged counterparts, suggesting similar differences in expression levels and that these are a feature of the RGS proteins. This could reflect interactions with other proteins, which can result in stabilization of the RGS protein (Witherow et al., 2000). Reducing the amount of transfected DNA reduced both the expression of RGS3myc and the inhibition of receptor-mediated Ins(1,4,5)P3 generation. At approximately equivalent expression levels, inhibition by RGS3myc was more consistent with that of RGS2myc. Despite effects of RGS2myc and RGS3myc on Ins(1,4,5)P3 generation, agonist potency was unaffected.
We also used the eGFP-PKCγC12 biosensor to examine diacylglycerol formation, which is complimentary to Ins(1,4,5)P3 but has distinct signaling consequences. When expressed at similar levels, RGS2myc and RGS3myc but not RGS4myc inhibited diacylglycerol formation as assessed by reduced cytosol to membrane translocation of eGFP-PKCγC12.
To increase the utility of our model, we generated stable cell lines from HEK293/WT cells that expressed the RGSmyc proteins at similar levels. RGS2myc and RGS3myc reduced both the amplitude and kinetics of single-cell Ca2+ events at maximal and submaximal agonist concentrations. In contrast, inhibitory effects of RGS4myc were only apparent at submaximal agonist concentrations. The RGS proteins also influenced the patterns of Ca2+ signaling. At low agonist concentrations that produced oscillatory Ca2+ patterns in HEK293/WT cells, the RGSmyc proteins dampened both the amplitude and frequency of oscillations. In contrast, at high agonist concentrations that produced essentially peak and sustained Ca2+ responses in HEK293/WT cells, RGSmyc expression promoted oscillatory Ca2+ signaling. The pattern of Ca2+ signaling is key in defining the cellular responses to agonist stimulation, and the demonstration that RGS proteins can influence the pattern as well as the extent of Ca2+ signaling has important physiological implications. The precise mechanisms underlying oscillatory Ca2+ signaling are unclear. Low levels of Ins(1,4,5)P3 may sensitize its receptor to Ca2+-induced Ca2+ release and promote regenerative Ca2+ oscillations, whereas at higher levels, a dynamic (oscillatory) uncoupling of the GPCR signaling complex (e.g., receptor phosphorylation/dephosphorylation) may regulate oscillations (Nash et al., 2002). At still higher levels of Ins(1,4,5)P3, its receptors may saturate, causing peak and plateau Ca2+ responses. In our studies, reduced Ins(1,4,5)P3 could account for RGS protein effects at both low and high agonist concentrations. We cannot exclude the possibility, however, that oscillatory changes in Gαq/11 activation caused by cycles of activation and inactivation of RGS proteins cause oscillatory Ca2+ signaling, as suggested recently (Luo et al., 2001).
The greater inhibitory activity of RGS2 compared with RGS4 is consistent with an earlier cellular study that examined inositol phosphate accumulation (Heximer et al., 1999) but contrasts with that observed in vitro (RGS2 > RGS3 = RGS4) (Heximer et al., 1997; Scheschonka et al., 2000). This suggests that other factors may determine RGS protein specificity in vivo, and this could involve interactions with other molecules. An obvious candidate is the GPCR, as recently demonstrated for RGS2 and the third intracellular loop of the Gαq/11-coupled muscarinic M1 receptor (Bernstein et al., 2004). It is interesting that RGS2 but not RGS4 also interacts with this region of the muscarinic M3 receptor (Bernstein et al., 2004). We were unable to obtain, however, any evidence for differences in the subcellular localization of the RGS proteins that could easily account for their different inhibitory properties. Thus, immunocytochemistry revealed that, as in previous studies (De Vries et al., 2000; Roy et al., 2003), RGS2myc is highly expressed in the nucleus, whereas both RGS3myc and RGS4myc are predominantly cytosolic.
To determine whether effector antagonism could account for RGS protein action, we examined their impact on GAP-resistant G-protein activation using either  to directly activate G-proteins or a constitutively active Gαq (CA-Gαq; Q209L) that is resistant to RGS protein GAP activity (Heximer et al., 2001). RGS protein expression did not affect
  -mediated [3H]InsPx accumulation. Furthermore, although RGS proteins increased the delay before
  -evoked Ca2+ oscillations, they did not affect either their frequency or amplitude. This suggests that GAP activity may be required to influence agonist-mediated oscillatory Ca2+ signals. The reason for the increased delay is unclear; it could reflect binding of RGS proteins to inactive G-protein α-subunits (Roy et al., 2003). Thus, the release of α-subunits could be delayed during
  stimulation but not agonist stimulation, when the receptor acts as a guanine-nucleotide exchange factor (i.e., GDP-GTP exchange is not limiting). RGS proteins bind with higher affinity to G-proteins in the GDP-
 -bound state than the GTP-bound state (Ross and Wilkie, 2000), which may complicate interpretation. A final point limiting the usefulness of
  is that it activates all heterotrimeric G-proteins, and those other than Gαq/11 may contribute to the measured responses through, for example, the activation of PLC by Gβγ-subunits. Thus, as an alternative approach, we used CA-Gαq, which in addition to being GAP-resistant has an affinity for RGS proteins consistent with GTP-bound Gα-subunits (Ross and Wilkie, 2000), making it useful in the examination of effector antagonism. Transient transfection of CA-Gαq into HEK293/WT cells markedly increased PLC activity as judged from the accumulation of [3H]InsPx against a Li+-block. Expression of CA-Gαq in the RGSmyc-expressing cell lines similarly enhanced [3H]InsPx accumulation. Direct comparison of stimulation levels may be complicated by reciprocal effects of RGS proteins and Gα-subunits on expression levels (Anger et al., 2004). However, these data demonstrate that effector antagonism is insufficient to fully block G-protein-mediated activation of PLC. It is noteworthy that CA-Gαq caused robust accumulation of [3H]InsPx in RGS3myc-expressing cells despite almost no muscarinic receptor-mediated accumulation. Thus, RGS proteins were unable to efficiently block signaling by CA-Gαq. Extrapolation to the effects of RGS proteins on endogenous G-proteins expressed at lower levels is difficult, and we cannot exclude the possibility that effector antagonism accounts for a proportion of the effects on receptor-mediated signaling. Indeed, a recent study suggested that GAP-independent mechanisms of RGS2 and RGS3 inhibited signaling by muscarinic M3 receptors when overexpressed in COS-7 cells (Anger et al., 2004). However, the contribution of effector antagonism versus GAP activity for endogenously expressed RGS proteins acting on endogenously expressed receptors remains to be defined.
In conclusion, along with population-based biochemical assays, we used a Ca2+-sensitive dye and novel biosensors to detect [Ca2+]i, Ins(1,4,5)P3, and diacylglycerol production to assess RGS-mediated inhibition of Gαq/11-mediated signaling at the single-cell level in live cells and in real time. This allowed a detailed examination of the effects of RGS proteins on not only the magnitude of GPCR-mediated signaling but also the kinetics and temporal profiles.
Footnotes
-
This work was supported financially by the Biotechnology and Biological Research Council (ref. 91/C15897) and the Wellcome Trust (ref. 061050).
-
ABBREVIATIONS: RGS, regulators of G-protein signaling; GPCR, G-protein-coupled receptor; GAP, GTPase-activating protein; Ins(1,4,5)P3, inositol 1,4,5-trisphosphate; eGFP, enhanced green fluorescent protein; HEK, human embryonic kidney; eGFP-PHPLCδ1 eGFP coupled to the pleckstrin homology domain of PLCδ1; eGFP-PKCγC12 eGFP coupled to the diacylglycerol binding domain of the C12 region of PKCγ; HEK293/M3, HEK293 cells expressing recombinant human muscarinic M3 receptors; HEK293/RGS2myc, HEK293 cells expressing recombinant RGS2myc; HEK293/RGS3myc, HEK293 cells expressing recombinant RGS3myc; HEK293/RGS4myc, HEK293 cells expressing recombinant RGS4myc; PLC, phospholipase C; CA, constitutively active; WT, wild-type; TTBS, Tris-buffered saline/Tween 20; BSA, bovine serum albumin; PBS, phosphate-buffered saline; FITC, fluorescein isothiocyanate; KHB, Krebs-HEPES buffer; [3H]InsPx, 3H-labeled mono- and polyphosphates of inositol; ANOVA, analysis of variance.
- Received August 5, 2004.
- Accepted September 17, 2004.
- The American Society for Pharmacology and Experimental Therapeutics


