


Abstract
Azimilide (AZ) is a class III antiarrhythmic drug that has voltage-dependent dual effects on the HERG channel: 1) increasing current amplitude at low-voltage depolarization (agonist effect), and 2) suppressing current at more depolarized voltages (antagonist effect). We examined the mechanism for the agonist effect of AZ on HERG expressed in Xenopus oocytes. The agonist effect resulted from an AZ-induced ‘prepulse potentiation: a strong depolarization prepulse increased the rate and degree of channel activation induced by subsequent depolarization to −50 or −40 mV. The potentiated state decayed slowly in an exponential fashion (time constant, 60–80 s). Degrees of potentiation were proportional to degrees of channel activation during prepulses; hence, the agonist effect of AZ was use dependent. AZ exerted its agonist effect from outside the cell membrane, and the effect did not depend on intracellular G-protein or protein kinase activity. Mutations made in the outer mouth or an extracellular loop connecting the S5 and P regions of HERG, which could hinder or modify conformational changes in the pore region during membrane depolarization, reduced or abolished AZ-induced prepulse potentiation. Importantly, these same mutations also increased the rate and degree of channel activation in the negative voltage range, and the degree of change in the activation properties was inversely correlated with the degree of AZ-induced prepulse potentiation. We propose that conformational changes in the outer mouth and neighboring extracellular domain of HERG during membrane depolarization can affect the process of channel activation. In the presence of AZ, channel activation allowed drug modification of these conformational changes, which subsequently facilitated HERG activation by low-voltage depolarization.
Several agents can decrease or increase currents through ion channels, depending on the voltage clamp protocols. This is the case for the dihydropyridine Ca channel antagonists/agonists (Hess et al., 1984). For K channels, several such cases have been described. These include the effects of almokalant on the rapid component of delayed rectifier (IKr) K channels in rabbit ventricular myocytes (Carmeliet, 1993), azimilide (AZ) on the slow component of delayed rectifier channels in guinea pig cardiac myocytes (Davies et al., 1996), and quinidine on Kv1.2 expressed inXenopus oocytes (Tseng et al., 1996). The agonist effects (increasing current amplitudes) of all these K channel drugs manifest one common feature: they are associated with a hyperpolarizing shift in the voltage dependence of channel activation, suggesting that drug-induced modifications of channels’ gating processes may be involved. This is supported by the observations that the agonist effect of quinidine on Kv1.2 is accompanied by a slowing of channel deactivation, indicating that quinidine can stabilize Kv1.2 channels in the open state versus closed or rested states (Tseng et al., 1996). This voltage shift in the activation curves, in conjunction with the drugs' antagonist effects (decreasing current amplitudes) that are enhanced by membrane depolarization, makes the agonist effects more prominent when tested at low-voltage depolarization than at strong depolarization.
In this study, we describe the agonist effect of AZ, a potent blocker of HERG and its native counterpart, IKr, in cardiac myocytes (Fermini et al., 1995; Fan et al., 1997; Yao and Tseng, 1997), on the HERG channel expressed in Xenopusoocytes. Similar to the other drug actions described above, the agonist effect of AZ on HERG was best seen at low-voltage depolarization close to the activation threshold (−50 or −40 mV). However, unlike the above agonist effects that are stationary features of drug-channel interactions, the agonist effect of AZ on HERG was dynamic: it was induced by depolarization pulses in a use-dependent manner. After initiation, the agonist effect decayed slowly in the absence of depolarization pulses. Therefore, the agonist effect of AZ on HERG was due to a depolarization-induced potentiation of channel activity similar to the well-described phenomenon of prepulse potentiation of Ca channels (Sculptoreanu et al., 1993; Herlitze et al., 1996).
We further tested possible mechanisms for the agonist effect of AZ on HERG. Unlike prepulse potentiation of Ca channels that involves G-protein or protein kinase activities (Sculptoreanu et al., 1993;Herlitze et al., 1996), the agonist effect of AZ did not depend on these intracellular factors. We then used the site-directed mutagenesis technique to perturb the gating function of HERG and examined the resulting effects on the actions of AZ. Because AZ exerted its agonist effect on HERG from outside the cell membrane, mutations were made in the outer mouth and a neighboring extracellular loop connecting the S5 and pore region (S5-P loop). Based on the mutational analysis, we propose that in the HERG channel there are allosteric interactions between the outer mouth and nearby extracellular domain and the activation-gating apparatus. We also propose that HERG channel activation allowed AZ to modify the conformational changes in the outer mouth and neighboring region induced by membrane depolarization, or to modify their interactions with the process of opening or closing of the activation gate. This led to a facilitation of channel activation by subsequent low-voltage depolarization pulses.
Materials and Methods
Site-Directed Mutagenesis and cRNA In Vitro Transcription.
The HERG cDNA in a vector, pAlter-Max, was subjected to oligonucleotide-directed mutagenesis according to the manufacturer's instructions (Altered Sites II Mammalian Mutagenesis System; Promega Biotec, Madison, WI). Mutations were confirmed by direct DNA sequencing. Mutants are designated by a one-letter amino acid code for the wild-type (WT) residue followed by the substituting residue, with the number of position in between. Plasmid DNAs of the WT and mutants of HERG, as well as the α1C-adrenoceptor (Tseng-Crank et al., 1995), were linearized for in vitro transcription. The transcription reactions were performed using a commercial kit (mMessage mMachine; Ambion, Austin, TX) and T7 RNA polymerase. Denaturing agarose gel electrophoresis was used to check the quality of cRNA product of each transcription reaction and to quantify the yield. cRNA was dissolved in RNase-free water for oocyte injection.
Oocyte Preparation and Injection.
The oocytes ofXenopus laevis were isolated by partial ovariectomy. Follicular cell layers were removed mechanically after mild digestion with collagenase (type B; Boehringer Mannheim, Indianapolis, IN). Four to six hours after isolation, oocytes were injected with cRNA solutions using a Drummond digital microdispenser (Fisher Scientific, Pittsburgh, PA). The volume injected was 30 to 50 nl/oocyte. The oocytes were incubated at 16°C in an ND 96 solution (NaCl, 96 mM; KCl, 2 mM; CaCl2, 1.8 mM; MgCl2, 1 mM; HEPES, 5 mM; Na-pyruvate, 2.5 mM; pH 7.5 with NaOH), and were supplemented with penicillin (50 U/ml), streptomycin (50 ug/ml), gentamycin (10 ug/ml), and horse serum (4%). The oocytes were studied 2 to 6 days after injection.
Electrophysiological Experiments.
The oocytes were placed in a tissue chamber and superfused at room temperature (23–25°C) with a low-Cl solution to minimize interference from endogenous Ca-activated Cl currents. The solution had the following composition: NaOH, 96 mM; KOH, 2 mM; MgSO4, 1 mM; CaCl2, 1.8 mM; HEPES, 5 mM; Na-pyruvate, 2.5 mM (pH 7.5 with methanesulfonic acid). The flow rate was maintained at about 10 ml/min, allowing a total exchange of the bath solution in 15 to 30 s after switching the valve that controlled the solution flowing into the bath. Membrane currents were studied using the two-microelectrode voltage clamp technique, with an Oocyte Clamp amplifier (model OC-725B; Warner Instrument Corp, Hamden, CT). Both the voltage-recording and the current-passing electrodes were made of agarose-cushion pipettes of low tip resistance (0.1–0.2 MΩ) (Schreibmayer et al., 1994).
In some experiments, currents were recorded from cell-attached patches. In this case a pipette filled with a solution containing 98 mM [K] (made by replacing 96 mM NaOH in the regular low-Cl bath solution described above with equimolar KOH) was used to form a tight seal on the oocyte cell membrane after removing the vitelline membrane (Methfessel et al., 1986). The oocyte was superfused with the same 98 mM [K] solution to bring the transmembrane voltage to close to zero.
When intracellular injection was required during voltage clamp experiments, a third fine-tipped injecting pipette was used to impale the oocyte between the current-passing and voltage-recording electrodes. Injections were controlled by the same microdispenser as used in cRNA injections. The tips of injecting pipettes were beveled under a microscope to facilitate injection while minimizing injury.
Solutions and Chemicals.
AZ (Procter and Gamble Pharmaceuticals, Cincinnati, OH) was dissolved in water to make 10 mM stock solution. This was aliquoted and stored at −20°C. Before experiments, an aliquot was thawed and diluted with the low-Cl bath solution described above to reach desired final concentrations (0.5–50 uM). The following stock solutions were made in dimethyl sulfoxide: 12-O-tetradecanoylphorbol-13-acetate (TPA, 1 mM; Calbiochem, La Jolla, CA), staurosporine (10 mM; Calbiochem), and genistein (80 mM; Calbiochem). The stock solution of GDP-β-S (50 mM; Calbiochem) was made in water. These solutions were aliquoted and stored at −20°C until use. The stock solution of phenylephrine (PE, 100 mM; Sigma) was made in water and stored at 4°C. Dithiothreitol (DTT) was dissolved in distilled water at 0.5 M, aliquoted, and stored at −20°C. Each aliquot was used for one experiment by diluting with bath solution to reach a final concentration of 5 mM right before the experiment. H2O2 was added to the bath solution right before the experiment to reach a final concentration of 0.1%.
Data Acquisition.
The generation of voltage clamp protocols and data acquisition were controlled by an IBM/AT-compatible computer with Clampex of pClamp via a 12-bit digital-to-analog and analog-to-digital converter (TL-1 DMA Interface; Axon Instruments, Inc., Burlingame, CA). Currents were low-pass filtered with an eight-pole Bessel filter (Frequency Devices, Haverhill, MA) at 2 kHz, digitized on-line, and stored on diskettes for off-line analysis. The sampling interval ranged from 0.1 to 22 ms.
Voltage Clamp Protocols and Data Analysis.
The voltage clamp protocols and methods of data analysis will be described in figure legends. In all our voltage clamp protocols, there was a 20-ms prepulse from the holding voltage of −80 to −100 mV. The resulting current step was used for linear leak-subtraction during data analysis. Data analysis was mainly carried out using Clampfit (version 6.1). PeakFit (Jandel Scientific, Corte Madera, CA) was used to fit the activation curves. When appropriate, data are presented as means and S.E. Statistical analysis of unpaired t test was performed using SigmaStat (Jandel Scientific Software, San Rafael, CA). Statistical significance is determined at a p value of .05.
Results
AZ Had Dual (Agonist and Antagonist) Effects on HERG Channel
AZ is a class III antiarrhythmic drug with a potent inhibitory effect on the IKr channels in cardiac myocytes (Fermini et al., 1995; Yao and Tseng, 1997). It also suppressed currents through channels encoded by the HERG cDNA in mammalian (human embryonic kidney 293) cells and in Xenopus oocytes (Fan et al., 1997). This is shown by the AZ (5 uM)-induced reduction of HERG current amplitude recorded at 0 mV (Fig.1A, right), and the changes in the current-voltage relationship associated with AZ application at test voltages positive to −30 mV (Fig. 1B). Using test pulse current amplitudes measured at +20 mV, the relationship between AZ concentration (0.5 to 50 uM) and HERG current suppression suggested an IC50 value of 7.4 ± 2.4 uM (n = 7). This is somewhat higher than the IC50 of AZ blockade of native IKr in cardiac myocytes (<1 uM at −10 or −20 mV) (Fermini et al., 1995; Yao and Tseng, 1997).

Dual effects of AZ on the HERG channel. A, superimposed current traces recorded before (control) and after the application of AZ (5 uM). Currents were elicited by depolarization pulses to −50 or 0 mV, followed by repolarization to −80 mV. B, current-voltage relationships of test pulse currents before and after AZ (5 uM) application. Membrane was depolarized from Vh = −80 mV to different levels of Vtranging from −70 to +60 mV in 10-mV increments for 1 s once every 30 s. For each cell, currents measured at the end of test pulses were leak-subtracted and normalized by the maximal control current (normalized current). Shown are means and S.E. (n = 6 each).
However, under certain conditions (to be defined below) AZ could increase the HERG current amplitude at voltages close to the threshold of channel activation, i.e., −50 and −40 mV. One such example is shown in Fig. 1A, left. In this case, 5 uM AZ increased the HERG current amplitude (measured at the end of the 1-s test pulse to −50 mV) by 125%. The peak tail current amplitude was also increased. When measured under similar conditions, AZ increased the HERG current amplitudes measured at −50 and −40 mV by 100 ± 20% and 44 ± 13%, respectively (Fig. 1B, n = 6).
We will use the terms ‘agonist effects’ and ‘antagonist effects’ to describe the AZ-induced increase and decrease of HERG current amplitude. As will be shown in the following sections, these two effects represent two separate drug actions on the HERG channel, probably via two different drug-binding sites. The focus of the present study was the agonist effect and its mechanism.
AZ's Agonist Effect on HERG Was Due to Drug-Induced Prepulse Potentiation.
The experiments included in Fig. 1 were done with repetitive depolarization pulses to test voltages up to +60 mV with an interpulse interval of 30 s. Under these conditions, AZ could increase the HERG current amplitude at −50 and −40 mV. However, if the depolarization voltage was limited to −50 mV without any stronger depolarization, AZ caused only current reduction without any agonist effect. This is shown in Fig. 2A. In this experiment, the HERG current amplitude was monitored by repetitive test pulses to −50 mV. AZ (5 uM) application caused a monotonic reduction in the current amplitude to 30% of control. At the steady state of AZ-induced current suppression, a strong depolarization pulse (to +60 mV for 1 s) induced a marked increase in the HERG current amplitude during subsequent depolarization pulses to −50 mV. Importantly, in the absence of AZ the same depolarization pulse did not induce any appreciable potentiation of HERG current at −50 mV (Fig.2A, asterisk at left). In the presence of AZ, the potentiated state induced by the strong depolarization pulse decayed gradually with a single exponential time course. The time constant was 56 s (average 70.5 ± 5.3 s, n = 11). We will use the term ‘prepulse potentiation’ to describe this AZ-induced increase in the HERG current amplitude, because it is similar to the phenomenon of prepulse potentiation well described for the N-, P/Q-, and L-type Ca channels (Sculptoreanu et al., 1993; Herlitze et al., 1996).

Prepulse potentiation of HERG in the presence of AZ. A, time course of changes in the HERG current amplitude monitored by repetitive 1-s depolarization pulses from Vh = −80 mV to Vt = −50 mV once every 15 s. Between time points ‘a’ and ‘b’, a strong pulse to +60 mV for 1 s was applied (marked by ∗). This caused little effects on the HERG current amplitude. The cell was then exposed to 5 uM AZ (data points after AZ application denoted by ●). This caused a gradual reduction in the HERG current amplitude. Between time points ‘c’ and ‘d’, another strong pulse to +60 mV for 1 s was applied (second ∗). This caused a marked increase in the HERG amplitude during the subsequent pulses to −50 mV (prepulse potentiation). The degree of potentiation gradually decayed with a time constant (τ) of 56 s. B, representative current traces from the same experiment as shown in (A). Current traces are denoted by letters ‘a’ to ‘d’ corresponding to those marked along the time course in (A).
AZ-Induced Prepulse Potentiation Was Proportional to Degree of Channel Activation during Prepulse: Use-Dependent Agonist Effect.
Because prepulse potentiation was seen at the steady state of current suppression by AZ and could be induced repetitively (see below), it allowed us to separate the agonist effect of the drug from its antagonist effect and explore the underlying mechanism. Therefore, in the following experiments (except those in Fig. 5) AZ-induced prepulse potentiation was used to quantify its agonist effect on HERG. Figure3 illustrates the voltage clamp protocol and data analysis. The degree of potentiation was related to the prepulse voltage. A small but fast-decaying potentiation could be induced by a prepulse to −40 mV. The potentiation became more pronounced and decayed more slowly as the prepulse voltage became more depolarized. The degree of potentiation plateaued at +20 mV and more positive voltages. Figure 3B shows that at different levels of initial potentiation, the decay of the potentiated state approached completion at the end of a 16-pulse train with an interpulse interval of 15 s. Therefore, the degree of prepulse potentiation was quantified by dividing the current amplitude during the first pulse of the train (when the potentiation was close to its maximum) by that during the sixteenth pulse (when the potentiation had largely subsided), and was designated as I1/I16.

Comparison of degrees of prepulse potentiation measured at −50 and −40 mV and the effects of AZ-induced prepulse potentiation on the kinetics of HERG activation. A three-pulse voltage clamp protocol was used (A, inset, left). A depolarization pulse to +20 mV for 1 s was applied to induce channel potentiation in the presence of AZ. The membrane was then repolarized to −80 mV for 10 s to allow channels to recover from C-type inactivation and deactivate. This was followed by depolarization to −50 or −40 mV for 30 s. This long duration was necessary to better resolve the time course of channel activation at such low depolarization voltages. This protocol was applied before (control, thin traces) and after AZ (5 uM, thick traces) application. The interval between voltage clamp pulses was 1 min under the control conditions and 3 min in the presence of AZ to allow the prepulse potentiation from the previous run to subside. A, current traces from a representative experiment. The AZ-induced suppression of HERG current amplitude at +20 mV was clearly seen. AZ also reduced the peak amplitude of tail current and accelerated its decay, although these changes are not well resolved at the scale used. At both −50 and −40 mV, AZ induced a marked increase in the HERG current amplitude, along with an acceleration of its activation. B, comparison of degrees of HERG potentiation measured at −50 and −40 mV. Current amplitudes measured at the end of the 30-s pulses to −50 or −40 mV were used to calculate percent increase induced by AZ (by 102 ± 21 and 15 ± 2% at −50 and −40 mV,n = 5). C, changes in the kinetics of HERG activation at −40 mV associated with AZ-induced prepulse potentiation. The time course of current activation at −40 mV was fit with a double-exponential function to estimate the fast and slow time constants (τfast and τslow) as well as fraction of the fast component (n = 5).

Quantification of magnitude and time course of decay of AZ-induced prepulse potentiation of HERG. A (top), voltage clamp protocol. From Vh = −80 mV, a prepulse to Vt for 1 s was applied. This was followed 15 s later by a train of 16 depolarization pulses to −50 mV for 1 s each at an interpulse interval of 15 s. This voltage clamp protocol was applied after the antagonist effect of AZ (5 uM) had reached a steady state. Between runs, the membrane was held at −80 mV for 5 min to allow prepulse potentiation induced by the previous run to totally subside. Bottom, superimposed current traces recorded during four pulse trains with prepulse Vt marked on top. Current traces recorded during the first and last pulses of a pulse train are marked by 1 and 16, respectively. B, time course of decay of AZ-induced prepulse potentiation. HERG amplitudes were measured as time-dependent currents during 1-s pulses to −50 mV and normalized to the current measured at the last (sixteenth) pulse of each pulse train. The normalized current amplitudes are plotted as open symbols against pulse number during the pulse train and the corresponding time after the prepulse (in seconds). These are superimposed on curves calculated from a single exponential function with best-fit τ values. ●, represent data from a train of pulses to −50 mV initiated 240 s after a prepulse to +60 mV.
Figure 4A plots the degree of prepulse potentiation (I1/I16) against the prepulse voltage. It is clear that the voltage dependence of prepulse potentiation was similar to that of channel activation. Therefore, in the presence of AZ, HERG channel activation led to an increase in the current amplitude measured at −50 mV, and the agonist effect was use-dependent. Figure 4B shows that the time constant of decay of AZ-induced prepulse potentiation was not related to the prepulse voltage or to the degree of potentiation. The only exception was seen at a prepulse voltage of −40 mV: the small degree of potentiation appeared to decay more rapidly (τ = 31.8 ± 7.9 s, n = 11, versus τ = 70.5 ± 5.3 s after Vt to +60 mV). Furthermore, the potentiated state decayed in the absence of a pulse train (Fig. 3B, filled circles). Therefore, the slow decay of AZ-induced prepulse potentiation was largely independent of the channel activity.
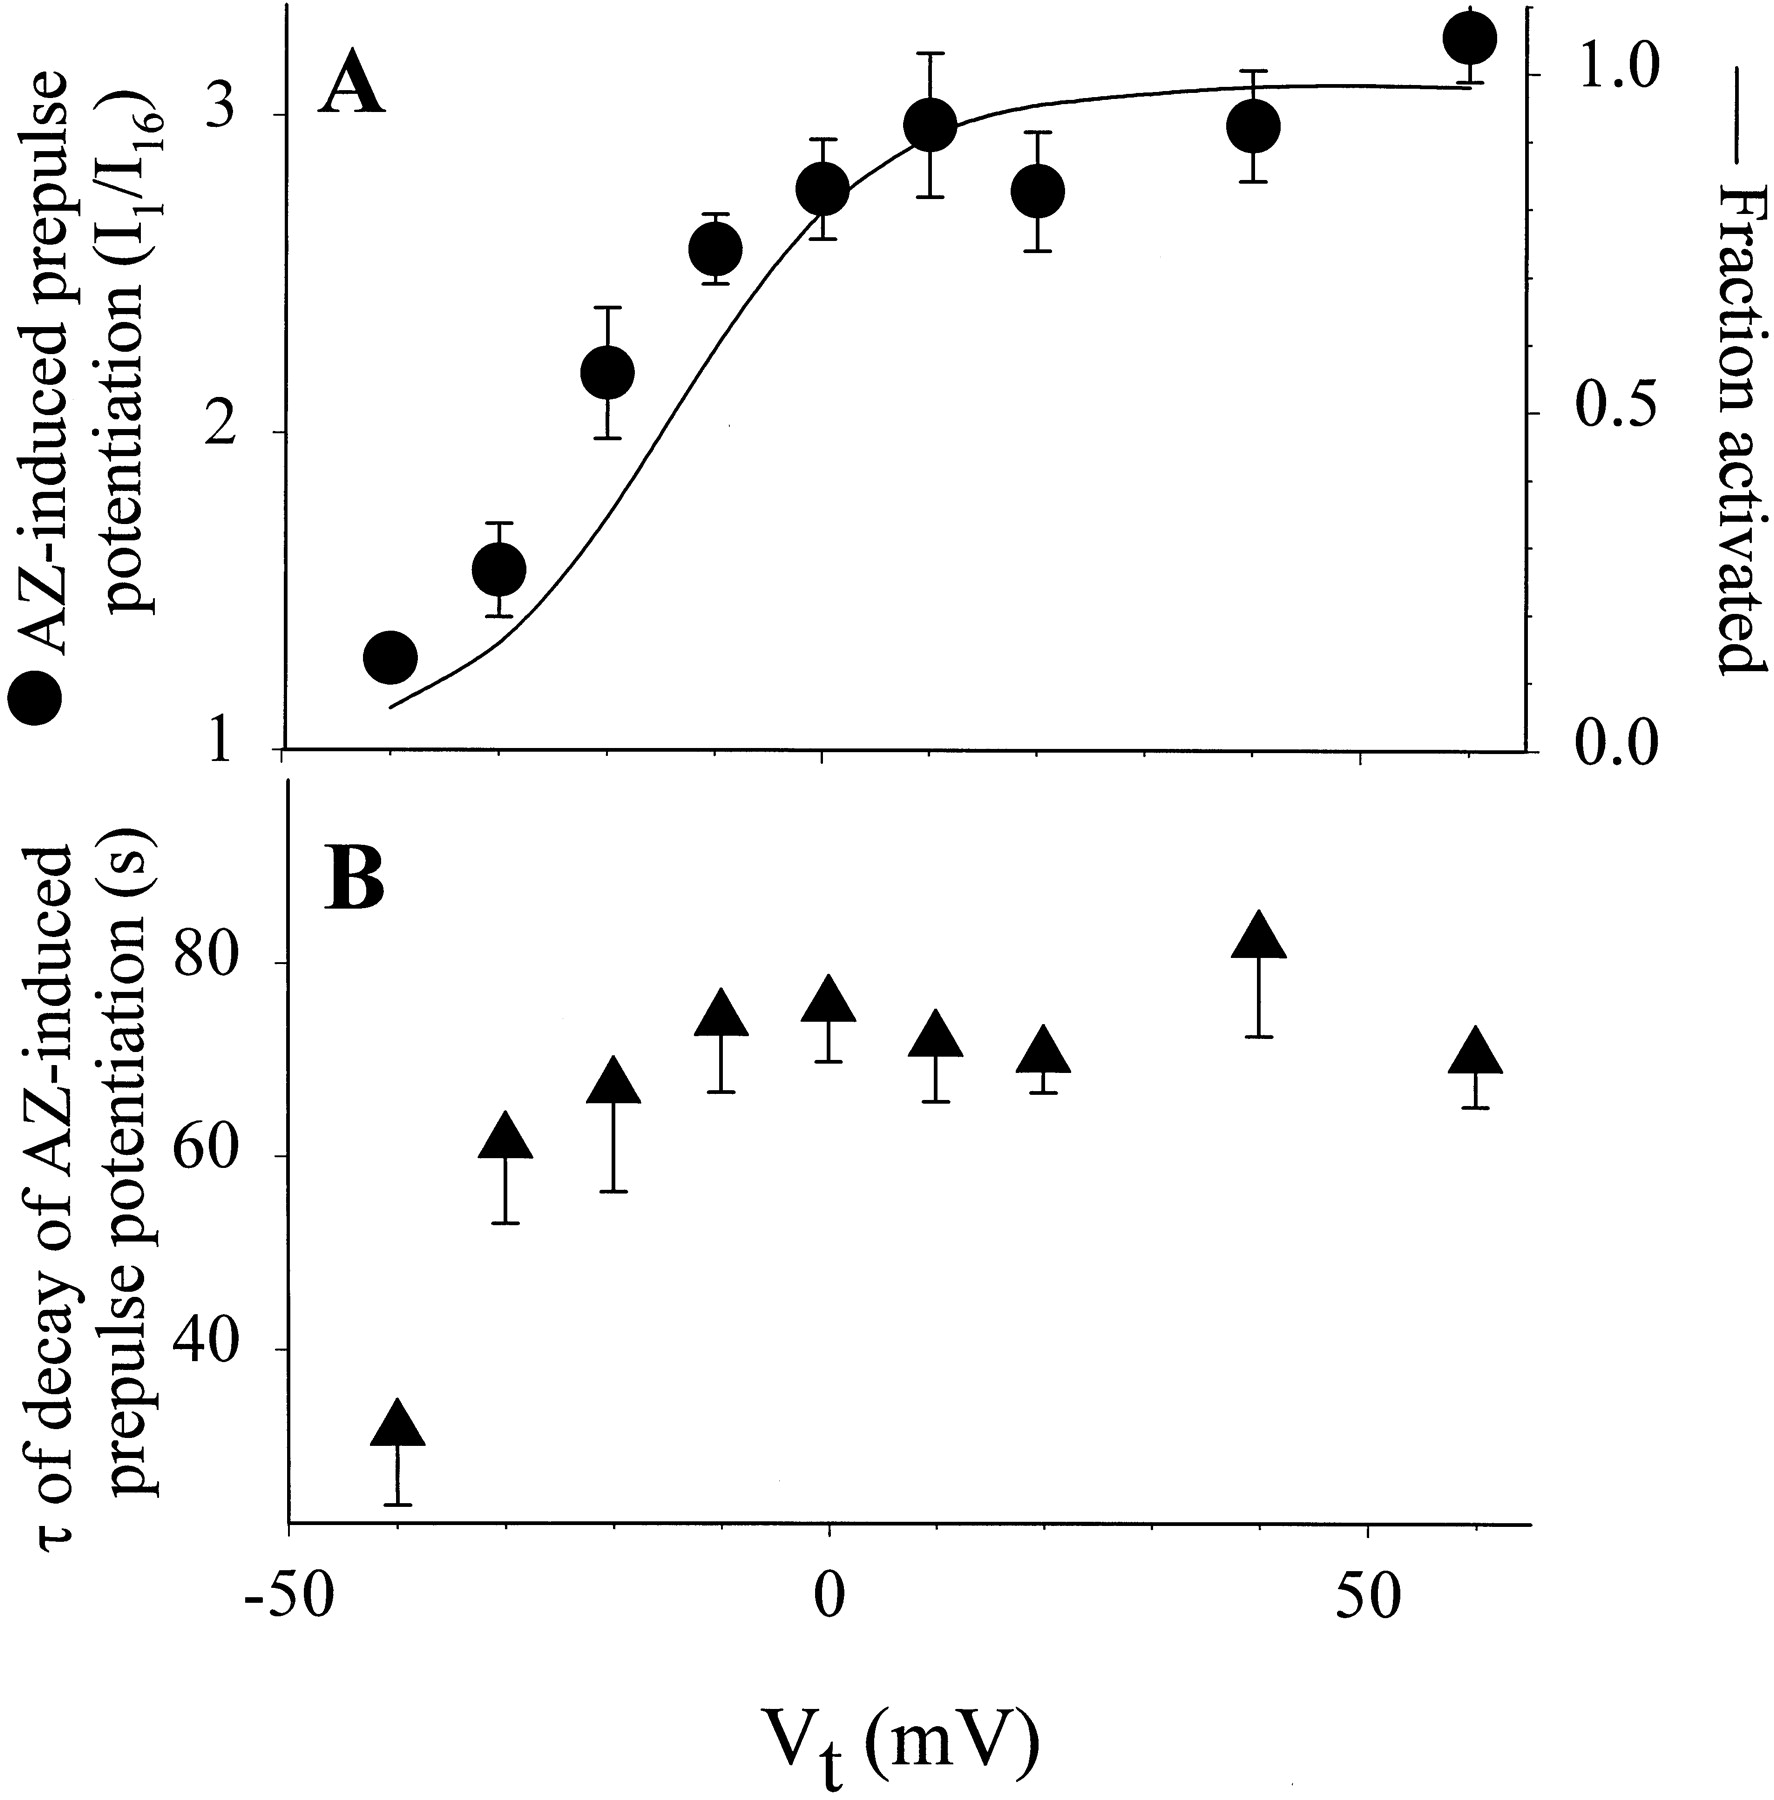
Voltage and time dependence of AZ-induced prepulse potentiation of the HERG channel. The voltage clamp protocol and data analysis were as described in Fig. 3 In (A), the degree of prepulse potentiation was quantified by the ratio of current amplitude measured during the first pulse of a pulse train to that during the sixteenth pulse (I1/I16) and plotted against prepulse Vt. These are shown as ● (left ordinate). Also shown is the 1-s isochronal activation curve of HERG constructed using the voltage clamp protocol described for Fig. 1B. The peak amplitudes of tail currents (Itail) following 1-s test pulses to various Vt were normalized by the maximal Itailfollowing a test pulse to +60 mV. This gave an estimate of fraction of channels activated (right ordinate). The relationship between fraction of channels activated and Vt was fit with a simple Boltzmann function: Equation 1where V0.5 is the half-maximum activation voltage and k is the slope factor. Data were averaged from 13 experiments. The activation curve was calculated using eq. 1 and the mean parameter values: V0.5 = −13.4 mV and k = 10.0 mV. In (B), the time constants (τ) of decay of AZ-induced prepulse potentiation are plotted against prepulse Vt. The τ values were obtained by fitting the decay time courses as shown in Fig. 3B with a single exponential function.
AZ-Induced Prepulse Potentiation Was Most Prominent at Threshold Voltage and Was Accompanied by an Acceleration of Channel Activation.
Experiments shown in Fig.5 were designed to examine how prepulse potentiation affected the kinetics of HERG currents at −50 and −40 mV (voltage clamp protocol and rationale described in the figure legend). We also compared the degrees of potentiation induced by the same prepulse but measured at −50 and −40 mV. Current traces from a representative experiment are shown in Fig. 5A. The control current traces showed a very slow time course of activation at −50 and −40 mV, that did not reach a plateau even after 30 s of depolarization. This time course could be described by a double exponential function. AZ accelerated channel activation by shortening both the fast and the slow time constants. There was also an increase in the fast component of activation. Similar observations were obtained in four other experiments using the same voltage clamp protocol (data summarized in Fig. 5C).
Figure 5A also shows that AZ suppressed the HERG current amplitude at +20 mV and the peak amplitude of tail current at −80 mV (not resolved in the figure). However, there was a marked increase in the current amplitude at −50 mV and, to a lesser degree, at −40 mV in the presence of AZ. On average, AZ increased the current amplitude measured after 30-s depolarization to −50 and −40 mV by 103 ± 21% and 15 ± 2%, respectively (Fig. 5B).
AZ Exerted Its Effects on HERG from Outside Cell Membrane
After characterizing the voltage- and time-dependencies of AZ-induced prepulse potentiation of HERG, the following experiments were designed to explore the underlying mechanism. The first question we asked was: from which side of the cell membrane did AZ exert its effects on HERG? This question was addressed by using different configurations of current recording and methods of drug application. In the experiment shown in Fig. 6A, HERG currents were recorded from a whole oocyte. Current amplitudes at −40 and +20 mV were continuously monitored by a two-step voltage clamp protocol applied once every 15 s (Fig. 6 legend). AZ was first injected into the oocyte (10 nl of 10 mM AZ solution in water) to reach an estimated cytoplasmic concentration of 200 uM. This induced no appreciable effects on the HERG current amplitude at either −40 or +20 mV. To test whether this was due to an inefficient drug delivery to the cytoplasm, the pipette was withdrawn and the pipette solution was replaced with a 100 mM TEA solution. The pipette was then used to impale the oocyte again, and the same volume (10 nl) of TEA solution was injected to reach an estimated cytoplasmic concentration of 2 mM. This caused a rapid decrease in the current amplitudes at both −40 and +20 mV, confirming the effectiveness of intracellular delivery of drug molecules.

AZ affected the HERG channel from outside the cell membrane. A, time course of changes in HERG current amplitude measured at −40 (●) or +20 (○) mV using a two-step voltage clamp protocol (from Vh = −80 mV the membrane voltage was stepped to −40 mV for 1 s and then +20 mV for 1 s with an interpulse interval of 15 s). Inset, recording configuration, including two-electrode voltage clamp of whole oocyte plus a third injecting pipette. AZ was first injected into the oocyte (first arrow, estimated cytoplasmic concentration 200 uM) and then applied to the bath solution at 5 uM for 10 min (horizontal bar). Finally, TEA was injected into the oocyte (second arrow, estimated cytoplasmic concentration 2 mM). For AZ injection, the injecting pipette was filled with the drug solution (10 mM in water). Injection of 10 nl into the oocyte (volume ∼0.5 μl) reached an estimated cytoplasmic concentration of 200 uM. The injecting pipette was then withdrawn from the oocyte. The AZ solution was expelled and the pipette was refilled with TEA solution (100 mM in water). The pipette was used to reimpale the oocyte and 10 nl of the TEA solution was injected. B, AZ could induce prepulse potentiation of HERG in 98 mM [K]o when applied from outside the cell but not from inside the cell. Each panel shows two superimposed current traces elicited by the first and the sixteenth pulses (marked ‘1’ and ‘16’) during a train of 1-s pulses to −50 (left) or −40 mV (right). The train followed a 1-s prepulse to +60 mV (voltage clamp protocol similar to the one described for Fig. 3A). Currents in the left panel were recorded from a whole-oocyte (inset) bathed in 98 mM [K] that contained 5 uM AZ. Currents in the right panel were recorded from a cell-attached patch (inset) with a pipette solution containing 98 mM [K]o. AZ (5 uM) had been added to the bath solution 15 min before the recording. With [K]o = 98 mM, Erev was ∼0 mV. Therefore, both test pulse currents at −50 or −40 mV and tail currents at −80 mV were inward.
Between the two injections, the bath solution was switched to one containing 5 uM AZ for 10 min. This caused a rapid and monotonic reduction of current amplitude at +20 mV, and the effect was quickly reversed on drug washout. Current measured at −40 mV showed a more complex time course: the current amplitude induced by the first pulse after AZ application was reduced, but that during the second pulse was increased. This was due to the phenomenon of prepulse potentiation. After the potentiation was established, its level was well maintained in the presence of AZ and with constant pulses to +20 mV. After removing AZ, the current amplitude at −40 mV overshot (rose to an even higher level) before gradually declining to the control level. This overshoot phenomenon was a routine observation in all eight similar experiments. It indicated that after removing AZ the reversal of the antagonist effect preceded that of the agonist effect, therefore unmasking a higher level of current increase due to the latter effect. This further suggests that these two effects, agonist and antagonist, resulted from separate drug actions probably via two different binding sites, or the same binding site but different processes that lead to changes in the channel function.
Figure 6B, right, shows HERG current traces recorded from a cell-attached patch. In this case, AZ was applied to the bath solution. If AZ affected HERG from inside the cell, we expected to see drug effects on channels included in the patch of membrane beneath the pipette tip. To facilitate current measurement, we used a pipette solution containing 98 mM [K]. This high level of [K]o could enhance the HERG current amplitude by reducing C-type inactivation (Baukrowitz and Yellen, 1995;Sanguinetti et al., 1995; Yang et al., 1997) and by increasing the single channel conductance (Kiehn et al., 1996). Under these conditions, AZ (5 uM) application to the bath solution for 15 min did not induce appreciable effects on currents recorded from the patch (data not shown). The current traces shown in Fig. 6B, right, were recorded in the presence of AZ during the first and the sixteenth pulses of a pulse train following a prepulse to +60 mV for 1 s. The two traces are superimposable, indicating that there was no prepulse potentiation under these conditions. Similar results were obtained from five experiments using the same recording configuration and AZ application.
To test whether the high level of [K]o (98 mM) used in these experiments prevented the agonist effect of AZ, we recorded whole-cell currents in 98 mM [K]o and tested the effects of AZ (5 uM) added to the bath solution (Fig. 6B, left). A marked prepulse potentiation was seen. Similar observations were obtained from five experiments. Therefore, we concluded that AZ exerted its agonist effect, as well as its antagonist effect, from outside the cell membrane.
G-Proteins or Protein Kinases Were Not Involved in AZ-Induced Prepulse Potentiation of HERG
It has been suggested that prepulse potentiation of the N- and P/Q-type Ca channels is mediated by a depolarization-induced dissociation of G-protein subunits from the Ca channels (Herlitze et al., 1996). This relieves the inhibitory effect of these subunits on the Ca channels and leads to an increase in the current amplitude. The experiments shown in Fig. 7 were designed to explore whether G-protein activity was involved in AZ-induced prepulse potentiation of HERG. GDP-β-S was injected into oocytes. This was expected to replace GDP bound to the α subunits of G-proteins with GDP-β-S, and a suppression of G-protein activities. Injections were made at an estimated cytoplasmic concentration of 2 mM 30 to 120 min before the recordings. To test whether this was sufficient to suppress G-protein activities, we examined whether GDP-β-S administered in the same fashion could prevent the effects of α1C-adrenergic stimulation on HERG channel function. When HERG was coexpressed with α1C-adrenoceptor, application of phenylephrine (PE, 5 uM) could induce a prominent positive shift in the activation curve (Fig. 7A). This was not seen in the absence of α1C-adrenoceptor, and could be prevented by prazosin (5 uM) pretreatment (data not shown). It has been shown that α-adrenoceptors expressed in oocytes are linked to native G-proteins, which mediate the effects of receptor stimulation (Blitzer et al., 1993; Tseng et al., 1997). Figure 7B shows that GDP-β-Sinjection reduced the effect of α1C-adrenergic stimulation on the voltage dependence of HERG activation, confirming a severe suppression of G-protein activities inside the oocytes. Under these conditions, AZ-induced prepulse potentiation of HERG was not affected (Fig. 7C), indicating that this drug effect did not depend on G-protein activities.

Intracellular application of GDP-β-Sprevented the effects of α1-adrenergic stimulation on the voltage dependence of activation of HERG but not the AZ-induced prepulse potentiation. Experiments in (A) and (B) were from oocytes coinjected with cRNAs for HERG and α1C-adrenoceptor. A, positive shift in the voltage dependence of HERG activation induced by α1C-adrenergic stimulation by PE (5 uM). Activation curve was constructed as described for Fig. 4A. B, shift of V0.5of activation in control oocytes (14.9 ± 2.0 mV,n = 6) and in oocytes injected with GDP-β-S (estimated cytoplasmic concentration 2 mM, 30–120 min before experiments) (3.1± 1.2 mV, n = 3, p < .01 versus control). C, degree of AZ (5 uM)-induced prepulse potentiation in control oocytes (I1/I16 = 3.25 ± 0.14,n = 10) and in oocytes injected with GDP-β-S (I1/I16 = 3.60 ± 0.59, n = 3, p > .05). AZ-induced prepulse potentiation was quantified as described in Fig. 4A with current amplitudes monitored at −50 mV and a prepulse voltage to +60 mV.
Prepulse potentiation of the l-type Ca channel is mediated by a depolarization-dependent activation of protein kinase A (Sculptoreanu et al., 1993). The experiments shown in Fig.8 were designed to test the role of protein kinase activities in AZ-induced prepulse potentiation of HERG. A nonspecific protein kinase inhibitor, staurosporine, was used. Staurosporine could inhibit serine/threonine kinases with IC50 in the range of 1 to 10 nM. We incubated oocytes with 10 uM staurosporine for ≥3 h to block protein kinase activities. To test whether this was sufficient, we examined whether the same treatment with staurosporine could prevent the effects of a PKC activator (TPA, 0.1 uM) on HERG function. TPA induced a prominent positive shift in the voltage dependence of HERG activation (Fig. 8, A and B). In oocytes pretreated with staurosporine, this effect was largely suppressed (Fig. 8B). Under these conditions, AZ-induced prepulse potentiation of HERG was not affected (Fig. 8C), ruling out a role of serine/threonine protein kinases in the agonist effect. Furthermore, a protein tyrosine kinase inhibitor, genistein (50 uM), was used to test the role of protein tyrosine kinases in the agonist effect of AZ. Genistein did not affect AZ-induced prepulse potentiation of HERG (I1/I16 = 3.83 ± 0.14, n = 4, p > .05 versus control, I1/I16 = 3.25 ± 0.14, n = 10), suggesting that protein tyrosine kinases were not involved in the agonist effect of AZ on the channel.

Staurosporine prevented the effects of a PKC activating phorbol ester (TPA, 0.1 uM) on the voltage dependence of HERG activation but not AZ-induced prepulse potentiation. A, HERG activation curve before and after TPA application. Activation curves were constructed as described for Fig. 4A. B, shift in V0.5of activation induced by TPA in control oocytes (27.3 ± 2.8 mV,n = 4) and in oocytes pretreated with 10 uM staurosporine for ≥3 h (1.5 ± 2.4 mV, n = 3,p < .001 versus control). C, AZ-induced prepulse potentiation in control oocytes (I1/I16 = 3.25 ± 0.14, n = 10) and in oocytes pretreated with staurosporine (I1/I16 = 3.82 ± 0.56, n = 3, p > .05). Voltage clamp protocol as described for Fig. 4A with current amplitudes monitored at −50 mV and a prepulse voltage to +60 mV.
Mutations That Hindered or Modified Conformational Changes in Outer Mouth Region during Membrane Depolarization Reduced or Abolished Agonist Effect of AZ on HERG
We then considered the possibility that AZ exerted its agonist effect on HERG by affecting the gating processes of the channel. Because AZ acted from outside the cell membrane, we tested this possibility by using mutant channels that had altered residues in the outer mouth or the S5-P loop. Some of these mutations dramatically altered the channel function. Previously, we have shown that side chain properties at position 631 in the outer mouth region, and at position 587 in the S5-P loop, are important for the C-type inactivation process and the pore's K selectivity of the HERG channel (Dun et al., 1999;Fan et al., 1999). Because both C-type inactivation and K selectivity involve conformational changes in the outer mouth region (Smith et al., 1996; Starkus et al., 1997; Kiss et al., 1999), these mutants could be viewed as ‘conformational’ reporters of the outer mouth region. Replacing the serine residue at position 631 with tyrosine (S631Y) did not perturb C-type inactivation or ion selectivity. However, replacing S631 with valine (S631V), lysine (S631K), or glutamate (S631E), or replacing both S631 and G628 with cysteines (G628C/S631C) disrupted C-type inactivation and made the channel permeable to Na (Fan et al., 1999). When S631 was replaced by cysteine (S631C), the channel behavior depended on the redox state of the introduced cysteine side chain. When the cysteine side chain was in the free thiol state (e.g., after treatment with a reducing agent, DTT), the S631C mutant behaved like the WT channel in showing a strong C-type inactivation and a strong selectivity for K against Na. On the other hand, when the thiol groups were oxidized by H2O2, S631C lost the ability to C-type inactivate and became Na permeable (Fan et al., 1999). Because the WT HERG channel was not affected by DTT or H2O2 treatment, the native cysteine residues were either not reactive or were not involved in C-type inactivation and K selectivity.
We observed that mutations of S631 that disrupted C-type inactivation and K selectivity also reduced or abolished the agonist effect of AZ. Figure 9 illustrates this correlation using the S631C mutant as an example. Figure 9A shows that after DTT treatment and when the S631C behaved in the WT mode, AZ could induce a prominent prepulse potentiation (Fig. 9A, right). On the other hand, after H2O2 treatment and when S631C behaved in the mutant mode (disruption of C-type inactivation and K selectivity, Fig. 9B), the agonist effect of AZ was absent (Fig. 9B, right). Under both conditions, AZ could still induce current suppression, indicating an intact antagonist effect.

Correlation between the redox state of thiol groups of HERG S631C and channel phenotype as well as the ability of AZ to induce prepulse potentiation. Top, schematic diagram of transmembrane topology of a voltage-gated K channel subunit and the relative position of S631 in the HERG channel. A, data from oocytes expressing S631C treated with DTT (5 mM). Left and middle, current traces elicited by test pulses to −70 to +60 mV followed by repolarization to −80 mV recorded before (control) and after AZ (5 uM) application. Right, superimposed current traces recorded in the presence of 5 uM AZ during the first and sixteenth (marked by 1 and 16) pulses to −50 mV following a 1-s prepulse to +60 mV (voltage clamp protocol as described for Fig. 3A). B, data from oocytes expressing S631C treated with 0.1% H2O2. The voltage clamp protocols and the format of the figure are the same as those in (A). After H2O2 treatment, S631C lost C-type inactivation (as evidenced by the continuous increase in test pulse current amplitudes up to +60 mV) and became Na permeable (as evidenced by inward currents at both −50 and −80 mV) (more details in text). Under these conditions, AZ could still decrease current amplitudes due to its antagonist effect, but there was no prepulse potentiation (right).
Replacing the histidine residue at position 587 in the S5-P loop with glutamate (H587E) did not significantly alter the HERG channel function. On the other hand, replacing H587 with proline (H587P) or lysine (H587K) disrupted both C-type inactivation and K selectivity (Dun et al., 1999). The agonist effect of AZ was also tightly linked to the degree of C-type inactivation and K selectivity among the S5-P loop mutants. Figure 10B shows that the H587P mutation that disrupted the C-type inactivation process and K selectivity also abolished the ability of AZ to induce prepulse potentiation. A similar mutation at a nearby position (H578P) did not affect either channel function (C-type inactivation and K selectivity) or AZ-induced prepulse potentiation (Fig. 10A), indicating that the effects were site specific. Again, the antagonist effect of AZ was not affected by either mutation.

Effects of H578P and H587P mutations on the extracellular S5-P loop of HERG on channel phenotype and the actions of AZ. The voltage clamp protocols and figure format are the same as those in Fig. 9. The relative positions of H578 and H587 in HERG are shown in the schematic diagram on top. A, H578P mutation did not affect the HERG channel phenotype (C-type inactivation and K selectivity) or the AZ-induced prepulse potentiation. B, H587P mutation disrupted C-type inactivation and K selectivity (more details in text). It also abolished the AZ-induced prepulse potentiation although the antagonist effect of the drug was intact.
In both S631C (H2O2-treated) and H587P, the currents at −50 and −80 mV were inward (Figs. 9B and 10B) due to a loss of K selectivity. In this case, Na ions carried charges through the pore, causing a positive shift in the reversal potential (Erev) (Dun et al., 1999; Fan et al., 1999). Erev of WT, S631C (H2O2-treated), and H587P channels were −98.2 ± 0.7, −14.1 ± 3.6, and −23.0 ± 7.1 mV (n = 7–12 each). However, the change in the current direction in these mutants could not explain the abolishment of AZ-induced prepulse potentiation, because prepulse potentiation was not prevented by reversing the current direction when [K]o was elevated from 2 to 98 mM (Erev ∼ 0 mV) (Fig. 6B).
Data from the WT channel and eight mutants with mutations in the outer mouth or S5-P loop are summarized in Fig.11. There was a tight linkage between the agonist effect of AZ (measured as the degree of prepulse potentiation) and the degree of C-type inactivation. In all channels, AZ could suppress current amplitudes at appropriate voltages (data not shown), indicating that the antagonist effect was intact in all.

Correlation between changes in C-type inactivation and changes in AZ-induced prepulse potentiation induced by mutations in the outer mouth or extracellular S5-P loop of HERG. The degree of C-type inactivation was quantified using the following voltage clamp protocol and data analysis. The membrane was depolarized to +60 mV for 0.3 s to fully activate and inactivate the channels. This was followed by repolarization to −60 or +30 mV, during which channels partially recovered from inactivation and, at −60 mV, deactivated. The peak amplitude of tail current measured at −60 and the plateau amplitude of tail current at +30 mV were divided by the driving force (difference between −60 or +30 mV and the reversal potential). This gave the HERG conductance when the channels were fully activated and at the steady state of C-type inactivation as determined by the voltage (−60 or +30 mV). The ratio of HERG conductance at −60 mV to that at +30 mV was used as an index of C-type inactivation (a larger ratio corresponds to a higher degree of C-type inactivation). The mean values of degree of C-type inactivation are used for the x-axis (n = 3 to 20 each). AZ-induced prepulse potentiation was measured as described for Fig. 4A (prepulse voltage = +60 mV, n = 3–21 each) and plotted against the degree of C-type inactivation. The line is a linear regression of data points.
Was agonist Effect Due to AZ Modification of C-Type Inactivation of HERG or Channel Activation?
There could be two possible explanations for the tight linkage between the ability of channels to C-type inactivate and the ability of AZ to induce prepulse potentiation. The first possibility was that AZ increased the HERG current amplitude by reducing C-type inactivation. In this scenario, AZ bound to an agonist site on the extracellular domain of the HERG channel and hindered the C-type inactivation process. This manifested as an increase in the rate and degree of channel activation in the threshold voltage range but not at more positive voltages, because stronger depolarization enhanced the antagonist effect and overwhelmed the agonist effect. A prerequisite for this possibility was that AZ binding should hinder the C-type inactivation process. To examine whether this was the case, we used a two-pulse protocol to measure the rate of C-type inactivation in the voltage range from −40 to +40 mV (Fig.12 legend). AZ application did not induce detectable changes in the time constants of inactivation in this voltage range, indicating that this drug did not affect the ability of HERG channels to enter the C-type inactivated state. This makes the first possibility less likely.

Time constants of C-type inactivation before and after AZ (5 uM) application. A (inset), two-pulse voltage clamp protocol: from Vh = −80 mV the HERG channels were fully activated and inactivated by the first pulse to +40 mV for 1 s. This was followed by repolarization to −80 mV for 20 ms to allow recovery from C-type inactivation without deactivation. This was followed by a second pulse to voltages ranging from −40 to +40 mV for 80 ms, during which the activated channels entered the C-type inactivated state. The decay phase of current traces during the second pulses was fit with a single-exponential function to obtain τ of inactivation. Shown in (A) are data from a representative experiment. Portion of currents recorded during the −80 mV step and the second pulses (marked by the shaded area on the voltage clamp protocol) is superimposed on curves calculated from the single-exponential function with best-fit parameter values. For the sake of clarity, only every 10th data points are shown. The current traces recorded at −40 and +40 mV are denoted. B, summary of τ of inactivation at −40 to +40 mV measured before and after AZ (5 uM) application (n= 6 each).
A second possibility was that AZ binding to a site on the extracellular domain of HERG affected the activation process of the channel, leading to a faster and larger activation at threshold depolarization. A prerequisite for this possibility was that conformations of the extracellular domain of HERG could affect the process of channel activation. That is, there are allosteric interactions between conformational changes in the extracellular domain, including the outer mouth, and the activation-gating apparatus. Because mutations that hindered or modified conformational changes in the outer mouth region (reflected by the loss of C-type inactivation and K selectivity) reduced or abolished the agonist effect of AZ, a test of the second possibility was to see whether these mutations also affected the activation gating process of the HERG channel.
Experiments shown in Fig. 13 examined this issue by comparing the kinetics and voltage dependence of activation between H587P (C-type inactivation disrupted) and WT or H578P (C-type inactivation intact). Compared with WT and H578P, H587P demonstrated a much faster rate of activation in the negative voltage range (Fig. 13, A and C). In the more positive voltage range the difference disappeared (Fig. 13, B and C). The activation curves of WT and H578P were superimposable. Both could be well described by a simple Boltzmann function (Fig. 13D). Relative to WT and H578P, H587P showed a higher degree of activation in the negative voltage range. There was a shallow phase of H587P activation in the positive voltage range, and the whole curve required a double Boltzmann function for a good fit. The half-maximum activation voltage (V0.5) of the major Boltzmann component (in the negative voltage range) was −36.9 ± 0.8 mV, a negative shift of 25 mV relative to that of WT (−11.6 ± 0.7 mV) and H578P (−11.0 ± 1.0 mV).
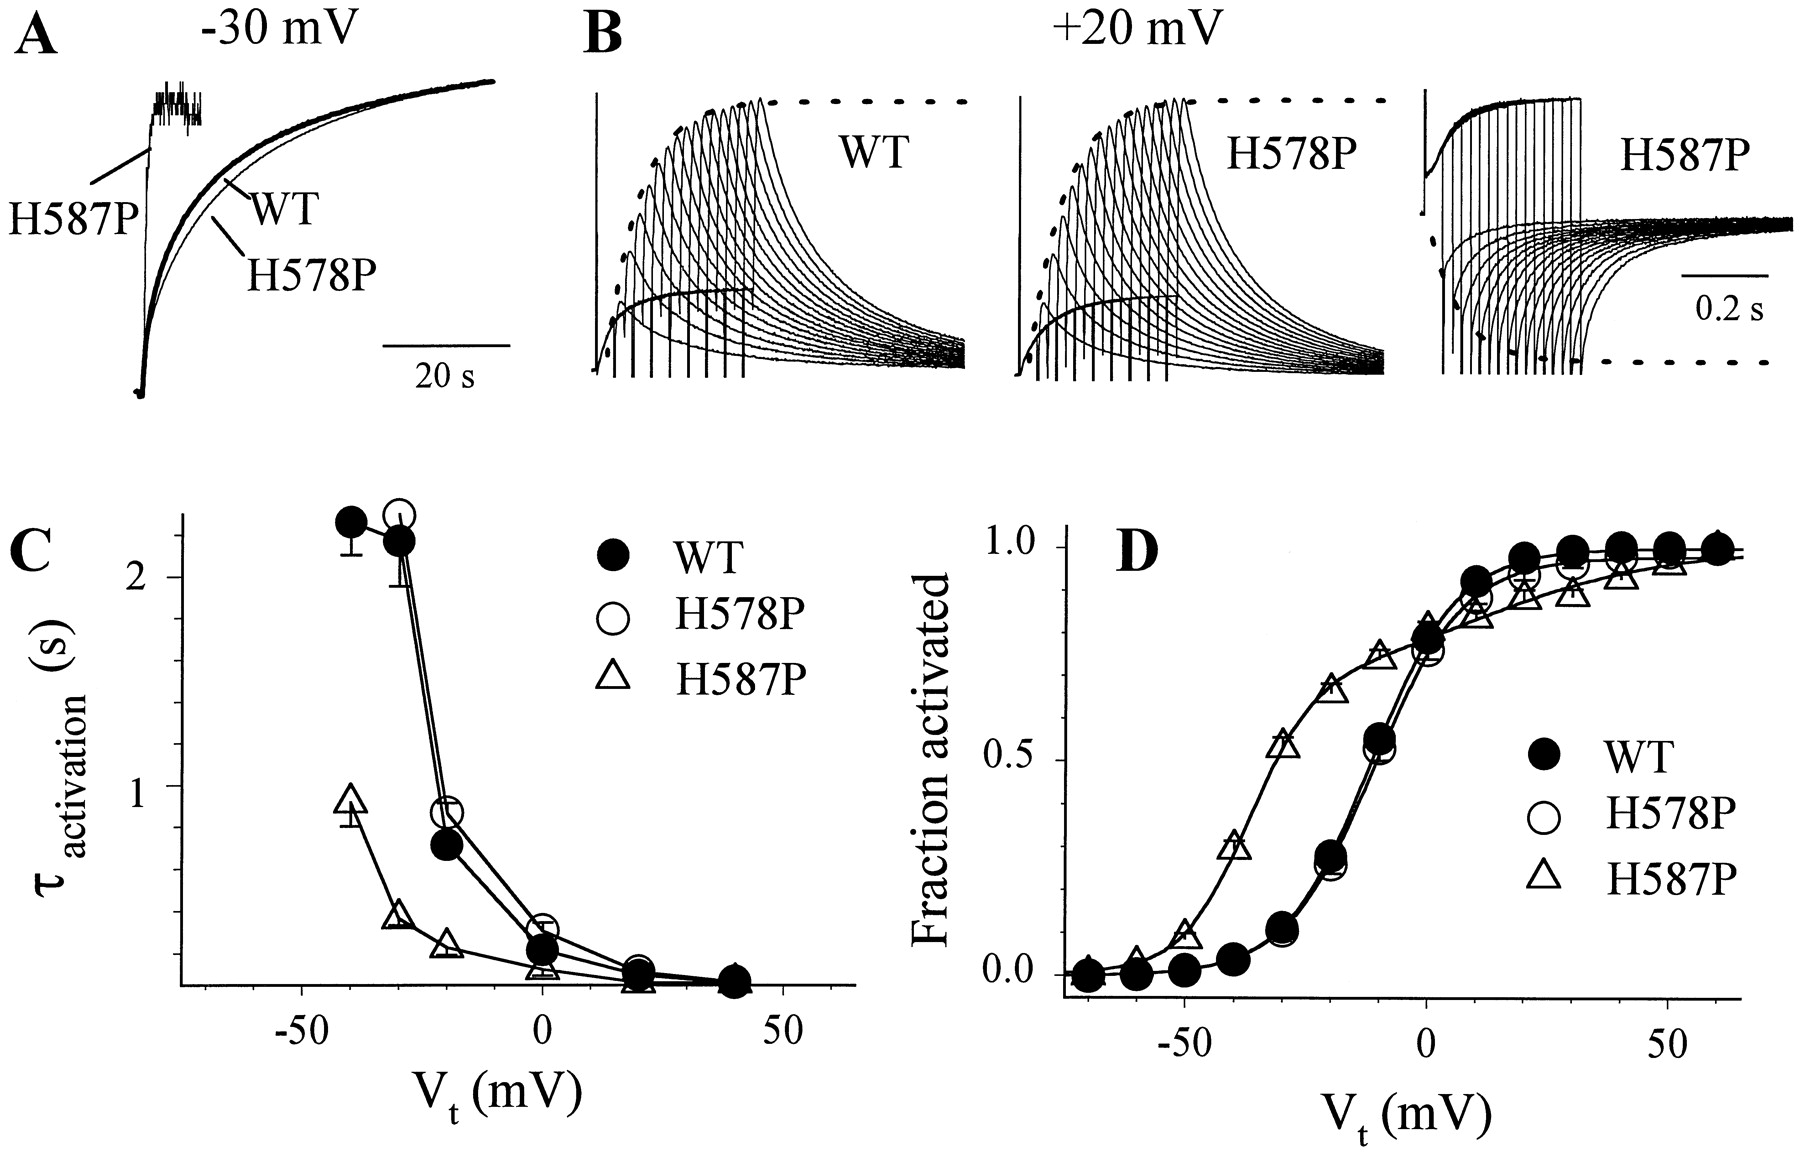
Effects of H578P or H587P mutation on the rate and voltage dependence of HERG channel activation. A, superimposed current traces of WT, H578P, and H587P elicited by depolarization pulses from Vh = −80 mV to Vt = −30 mV for up to 60 s. To facilitate comparison, the H587P trace (inward current at −30 mV) was inverted and the display gain was adjusted so that the amplitudes of time-dependent currents match each other. B, quantifying the time course of channel activation using an ‘envelope’ voltage clamp protocol. Shown are superimposed current traces elicited by depolarization pulses from Vh = −80 mV to Vt = +20 mV for different durations (from 50 to 425 ms at 25-ms increments) followed by repolarization to −80 mV. The superimposed dashed curves were calculated from a single exponential function with best-fit τ values plus a delay of 20 to 25 ms. C, time constants (τ) of activation at different test voltages. The τ values for WT and H578P at −40 and −30 mV correspond to the fast τ of activation estimated by fitting a double exponential function to current traces recorded during 60-s depolarization pulses as shown in (A). The τ values for H587P in this voltage range were obtained by fitting a single exponential function to the current traces during depolarization. The τ values at more depolarized voltages were obtained by fitting a single exponential function to the envelope of tail currents as shown in (B) (n = 5, 6, and 5 for WT, H578P, and H587P). D, 1-s isochronal activation curves of WT, H578P, and H587P. The voltage clamp protocol and data analysis were the same as those described in Fig. 4A. Data were averaged from 18, 13, and 9 experiments for WT, H578P, and H587P. The superimposed curves were calculated from the simple Boltzmann function (WT and H578P; eq. 1) with the following parameter values: WT, V0.5 = −11.6 ± 0.7 mV, k = 9.3 ± 0.3 mV; H578P, V0.5 = −11.0 ± 1.0 mV,k = 9.6 ± 0.9 mV. For H587P, the activation curve was fit with an empirical double Boltzmann function: Equation 2where A1 and (1−A1) represent the two Boltzmann components, V1 and k1 are the half-maximum activation voltage and slope factor for component 1, and V2 and k2 are the corresponding parameters for component 2. The superimposed curve was calculated using eq. 2 with the following parameter values: A1= 0.68 ± 0.03, V1 = −36.9 ± 0.8 mV, k1= 6.7 ± 0.5 mV, V2= 11.8 ± 4.9 mV,k2= 17.1 ± 0.9 mV.
Similar changes in the voltage dependence and kinetics of activation were seen in other C-type inactivation-disrupted mutants. Figure14 summarizes results from the WT and thirteen mutant channels. The values of V0.5 of activation are plotted against the degree of C-type inactivation (quantified as described in Fig. 11). The channel behaviors can be divided into two groups: 1) those with a degree of C-type inactivation ≥10 had V0.5 positive to −20 mV, and 2) those with a degree of C-type inactivation ≤2 had V0.5negative to −20 mV. Therefore, mutations in the outer mouth or S5-P loop that disrupted C-type inactivation accelerated channel activation and increased its level in the negative voltage range. This is consistent with the notion that conformational changes in the outer mouth region, reflected by the ability to C-type inactivate, can affect the rate and degree of HERG activation at low voltages.
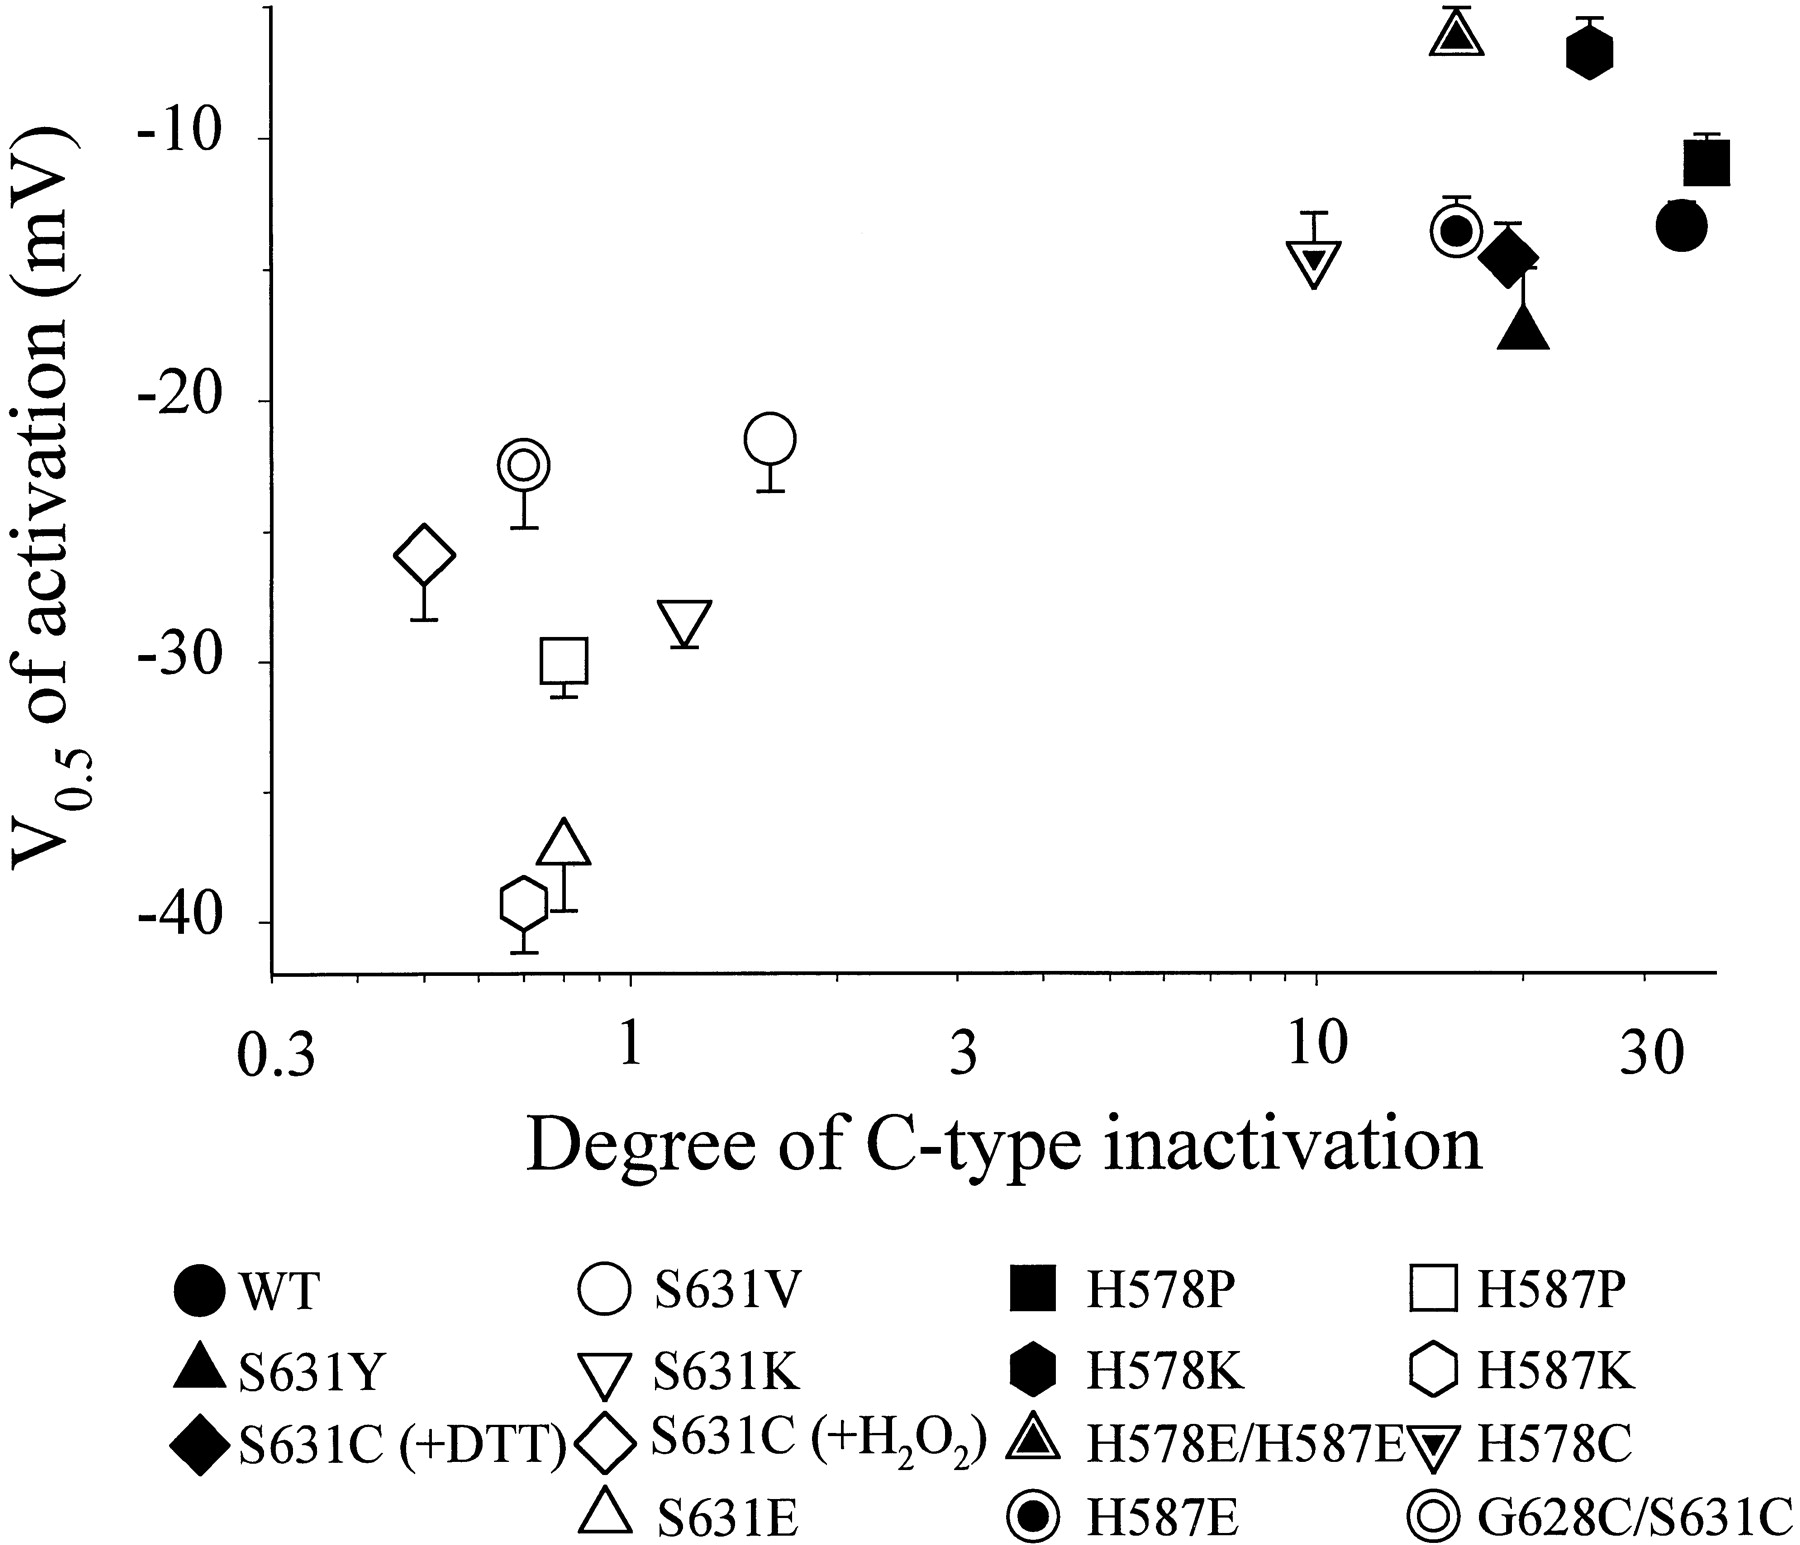
Correlation between changes in C-type inactivation and changes in half-maximum activation voltage (V0.5) induced by mutations in the outer mouth and extracellular S5-P loop of HERG. The degree of C-type inactivation was quantified as described for Fig. 11. The measurement of V0.5 was as described in Fig.13D. In WT and mutants with pronounced C-type inactivation (degree of C-type inactivation ≥10), the activation curves were well described by a simple Boltzmann function. For the other mutants that showed little or no C-type inactivation (degree of C-type inactivation ≤2), the activation curves required a double Boltzmann function for a good fit. The V0.5 values of these mutants correspond to those of the major Boltzmann component in the negative voltage range that accounted for ∼70% of total current (n = 5–18 each).
Figure 15 compares the V0.5 of activation and the agonist effect of AZ among the WT and mutant channels. There appears to be a threshold of V0.5 that determined whether the channel could respond to the agonist effect of AZ or not. For channels that had V0.5 more negative than −25 mV, AZ induced little or no prepulse potentiation. For channels that had V0.5 more positive than −25 mV AZ induced prepulse potentiation, whose degree increased as the V0.5 became less negative. Therefore, when a channel needed a stronger depolarization to reach the same level (e.g., 50%) of activation, AZ could potentiate its activation at low voltages.

Correlation between V0.5 of activation and AZ-induced prepulse potentiation among WT HERG and mutant channels. The V0.5 of activation was measured as described for Fig.13D (n = 5–18 each) and used for thex-axis. The AZ-induced prepulse potentiation was calculated as described in Fig. 4A (n = 3–21 each).
Discussion
The major findings in this study can be summarized as the following. AZ increased the HERG current amplitude in a voltage range close to the threshold of channel activation (agonist effect) due to a phenomenon we called prepulse potentiation. This drug-induced potentiation required prior channel activation, and thus was use dependent. AZ exerted this agonist effect from outside the cell membrane, and the effect did not depend on G-protein or protein kinase activity inside the cells. The effects of AZ were tested on mutant channels with altered residues in the outer mouth region or the extracellular S5-P loop. Mutations that disrupted C-type inactivation reduced or abolished the agonist effect of AZ. Such a tight linkage was not due to a suppression of C-type inactivation in the presence of AZ as the cause for the agonist effect of the drug. Instead, the agonist effect might be due to drug-induced modification of the activation-gating process of the HERG channel. This hypothesis was supported by the observations that the same mutations that interfered with the agonist effect of AZ also increased the rate and degree of channel activation in the negative voltage range.
Allosteric Interactions between Outer Mouth and Neighboring Extracellular Domain of HERG and Activation-Gating Apparatus.
Mutations of S631 in the outer mouth region and of H587 in the S5-P loop that disrupted C-type inactivation also had profound effects on the voltage dependence and kinetics of channel activation in the negative voltage range. These observations suggest that there are interactions between the outer mouth and the nearby extracellular domain and the activation-gating apparatus. This is consistent with results from elegant studies using fluorophores attached to specific sites in the pore and/or the S4 domains as reporters of local environmental changes during gating (Loots and Isacoff, 1998; Cha and Bezanilla, 1998). These studies clearly showed that there are interactions between the outer mouth and pore and the S4 movements. In particular, fluorescence changes associated with S4 movements are influenced by the occupancy of outer mouth by a blocker or toxin (Cha and Bezanilla, 1998).
The nature of mutations may provide some clues as to how some of them affected the gating processes of C-type inactivation and activation. In the S631C mutant, oxidizing the introduced thiol groups with H2O2 disrupted C-type inactivation and shifted the activation curve in the negative direction, whereas DTT treatment reversed these changes. This indicates that disulfide bond formation was involved. Disulfide bonds formed between thiol groups at position 631 with each other from different subunits, or with native cysteine residues would limit the degree of freedom in conformational changes in the outer mouth region. The proline residue introduced to the middle of the long (39 residues) S5-P loop in the H587P mutant might increase the rigidity of this loop and hinder local conformational changes. Therefore, the flexibility of side chain transitions or backbone movements in the outer mouth and S5-P loop may be a key factor in determining the degree of C-type inactivation. It may also affect the activation gate function.
An Agonist Site for AZ in Extracellular Domain of HERG.
In our experiments, potentiation of HERG activation by threshold depolarization required two factors: 1) the presence of AZ, and 2) a depolarization pulse that activated the channel. We envision a scenario whereby membrane depolarization led to conformational changes in the extracellular domain of HERG. This allowed AZ binding to an agonist site. AZ binding here modified conformational changes in the extracellular domain, making the activation gate open more easily by low-voltage depolarization. This drug effect and those of mutations in the outer mouth and S5-P loop (increasing the rate and degree of channel activation in the negative voltage range) might share the same, or a similar, mechanism. This may explain why the effects of AZ and mutations on activation-gating function were not additive; mutations that shifted the V0.5 of activation to negative than −25 mV abolished AZ-induced prepulse potentiation. For mutant channels with V0.5 of activation positive to −25 mV, a higher degree of potentiation was coupled with a less negative V0.5 (Fig.15).
The decay of the potentiated state was slow and largely independent of the degree of potentiation or channel activity. This suggests that perhaps the slow decay of prepulse potentiation reflected AZ dissociation from the agonist site in the absence of membrane depolarization. Where is the agonist site? Our data did not provide any clue. However, it is possible that the agonist site was separated from the antagonist site, where AZ bound and suppressed the HERG current amplitude. On washing out of AZ, the antagonist effect reversed rapidly. The agonist effect overshot first, followed by a decline to the control level. This suggests that the antagonist and agonist effects were two separate drug actions probably resulting from two binding sites, with the antagonist site having a lower affinity for AZ than that of the agonist site, or one binding site but different processes leading to changes in channel function. The notion of two separate AZ binding sites in the HERG channel was supported by the observations that none of the mutations that dramatically reduced or abolished the agonist effect of AZ influenced the antagonist effect of the drug.
Implications for Effects of AZ on Cardiac Action Potentials.
How will this use-dependent potentiation of HERG channel activity in the presence of AZ influence drug effects on the action potential of cardiac myocytes? If the IKr channel (the native counterpart of HERG) (Sanguinetti et al., 1995) is important for action potential repolarization, the major effect of AZ will be to prolong action potential duration by suppressing IKr (Yao and Tseng, 1997). This is because the antagonist effect of AZ on IKr should dominate in most of the voltage range that is relevant for action potential plateau. However, in the presence of AZ an action potential will make the IKr channels enter a potentiated state. Therefore, a low-voltage depolarization after an action potential, e.g., a delayed afterdepolarization induced by intracellular Ca overload, will be able to activate a larger IKr at a faster rate. This increase in outward current through IKr channels may offset the arrhythmogenic-delayed afterdepolarizations.
Footnotes
-
Send reprint requests to: Gea-Ny Tseng, Ph.D., Department of Physiology, Medical College of Virginia, Virginia Commonwealth University, P.O. Box 980551, Richmond, VA 23298-0551. E-mail:gtseng{at}hsc.vcu.edu
-
↵1 This work was supported by the National Institutes of Health, National Heart, Lung and Blood Institute (Bethesda, MD) Grants HL 46451 and 30557.
-
↵2 Current address: Department of Physiology, Medical College of Virginia, Virginia Commonwealth University, Richmond VA 23298-0551
-
↵3 Current address: Department of Physiology and Biophysics, University of Texas Medical Branch, Galveston, TX 770555-0641.
- Abbreviations:
- IKr
- rapid component of delayed rectifier current
- AZ
- azimilide
- S5-P loop
- the extracellular loop connecting the S5 and P regions of a K channel subunit
- WT
- wild-type
- V0.5
- half-maximum activation or inactivation voltage
- k
- slope factor of a Boltzmann function
- TPA
- 12-O-tetradecanoylphorbol-13-acetate
- PE
- phenylephrine
- DTT
- dithiothreitol
- τ
- time constant
- Received June 29, 1999.
- Accepted September 7, 1999.
- The American Society for Pharmacology and Experimental Therapeutics


