


Abstract
The conjugation kinetics of glutathione (GSH) and ethacrynic acid (EA) were studied in rat liver perfusion studies, where efficient removal occurred (steady-state extraction ratio Ess, ∼0.8–0.4 at concentrations ranging from 10–200 μM) despite the appreciable plasma protein binding. The declining Ess paralleled the saturation in GSH conjugate (EA-SG) formation; EA-SG primarily appeared in bile as the unchanged glutathionyl adduct (90%) and minimally as cleavage products. The GSH conjugation of EA in perfused liver was described by the constants Kmoverall of 67 μM and Vmaxoverall of 0.23 μmol/min/g liver. These differed from those observed for the bimolecular nonenzymatic (constant of 126 μM−1 min−1) and enzymatic (Km for GSH and EA were 1.2 mM and 94 μM, respectively; Vmax of 533 nmol/min/mg liver cytosolic protein or 32 μmol/min/g liver) GSH conjugation of EA in vitro. But they were similar to those estimated for EA uptake in isolated rat hepatocytes by saturable (Kmuptake = 57 μM, and Vmaxuptake = 0.55 μmol/min/g liver) and nonsaturable (0.015 ml/min/mg) processes. At increasing EA concentrations (>25 μM), time-dependent changes were observed for Ess and EA-SG formation, which rapidly decreased with time after the attainment of steady state due to the rapid loss of cellular GSH. The composite data were described adequately by a physiological model that accounted for transport and the GSH-dependent conjugation of EA. The results suggest that the rate-limiting process for hepatic EA GSH conjugation is cellular uptake, but cosubstrate availability controls the rate of metabolism when GSH becomes depleted.
The metabolism and biliary excretion of the loop diuretic, ethacrynic acid (EA), was described over two decades ago by Klaassen and Fitzgerald (1974), who demonstrated that EA was rapidly cleared from the plasma of rats and dogs, with the majority of the dose being excreted in bile as the glutathione (GSH) conjugate (EA-SG). Wallin et al. (1978) also observed a high clearance of EA with a rapid plasma half-life (t1/2) of 19 min in the rat, which could be decreased significantly with phenobarbital pretreatment. Later, LaCreta et al. (1994) described the pharmacokinetics of EA in cancer patients and established that the oral bioavailability of the drug was less than 21%, due primarily to a high first-pass effect. Taken together, these studies suggest that the liver is the major organ involved in the total body clearance of EA.
The GSH S-transferases (GSTs) that comprise of about 4% of total cytosolic protein in liver are responsible for the high-capacity metabolic inactivation of electrophilic compounds. Indeed, EA has been shown to be a substrate of several constitutively expressed rat liver GST isozymes including the α (subunits 1, 2, and 8) and μ (subunits 3 and 4) classes (Habig et al., 1974; Ploemen et al., 1990), although nonenzymatic GSH conjugation also exists. Furthermore, it was shown that EA-SG was an inhibitor of the GSTs due to its greater affinity for the enzymes than that of the parent molecule (Ploemen et al., 1990), whereas EA itself inhibits GST π through reversible covalent interactions (Ploemen et al., 1994). Because of these properties and because of the ability of EA to deplete cellular GSH, EA is potentially clinically useful as a modulator of drug resistance linked with the GSH/GST system (O’Dwyer et al., 1991).
There are only sparse examples in the literature where the factors affecting the kinetics of hepatic GSH conjugation of xenobiotics are examined experimentally and integrated into predictive models. Thus, this study was focused on the bimolecular, GSH conjugation kinetics of the model drug, EA, in rat liver, with the goal of understanding the interplay between the factors affecting protein binding, hepatic transport, cosubstrate availability, and enzymatic/nonenzymatic conversion. For this purpose, EA conjugates were synthesized and a stable HPLC assay was developed for their quantification. Nonenzymatic/enzymatic GSH conjugation was examined in vitro. Cellular uptake by isolated rat hepatocytes was studied to describe transport, inasmuch as the influx clearances of various drugs in the intact liver have been found to correlate closely to those found in isolated rat hepatocytes (Yamada et al., 1997). Protein binding, conjugate formation, and cellular GSH were examined at increasing EA concentrations in the perfused rat liver to describe the concentration-dependent hepatic GSH conjugation of EA. We were able to show that in vitro, the factors affecting hepatic EA removal could be successfully scaled up to describe the bimolecular reaction of GSH conjugation at the organ level with use of a physiological model that included synthesis and degradation of the cofactor GSH. Our results suggest that cellular uptake rate-limited GSH conjugation of EA in rat livers perfused with erythrocyte-free media. When hepatic GSH was depleted, cosubstrate availability became the rate-limiting step in EA elimination.
Materials and Methods
Chemicals.
EA, cysteine, cysteinylglycine,N-acetylcysteine, 4-(2,4-dichlorophenoxy)-butyric acid (DCPBA), GSH, oxidized GSH (GSSG), γ-glutamyl-glutamate, bathophenanthroline-disulfonic acid, m-cresol purple, 2,4-dinitrofluorobenzene, iodoacetic acid, taurocholate (TCA), bromosulfophthalein (BSP), bumetanide (BUM), estradiol-17β-glucuronide (E2-17β-G), and BSA (25% solution in Tyrode’s buffer) were obtained from Sigma Chemical Co. (St. Louis, MO). HPLC-grade acetonitrile was purchased from Caledon Laboratories (Mississauga, ON, Canada). [14C]EA (specific activity, 15 mCi/mmol) was a gift from Dr. J. H. T. M. Ploemen (TNO, Zeist, the Netherlands) and this was further purified by HPLC and solid-phase extraction (radiochemical purity, >98%). [3H]Sucrose (specific activity, 10 Ci/mmol) was obtained from New England Nuclear (Boston, MA). All other reagents were of analytical grade.
Synthesis of EA-Thiol Conjugates.
EA cysteinyl adducts, EA cysteine conjugate (EA-CYS) and EA cysteinylglycinyl conjugate (EA-CG), were synthesized by the method of Klaassen et al. (1974) and according to Cavrini et al. (1987) for EA-SG and EA-NAC, with minor modifications. EA (0.1–1 g) in 50 ml of ethanol was combined with equimolar amounts of l-cysteine or cysteinylglycine (in 50 ml of water) or GSH or NAC (in 50 ml of 10 mM potassium phosphate, pH 7.0) for 30 to 60 min. After drying under reduced pressure, the crude products were purified initially by preparative thin-layer chromatography (silica gel GF, 1000 μm; Analtech, Newark, DE) with a solvent system of acetonitrile/water (7:2 vol/vol) as described byAwasthi et al. (1993). The Rf values were 0.41, 0.36, 0.24, 0.43, and 0.82 for EA-CYS, EA-CG, EA-SG, EA-NAC, and EA, respectively. EA-CYS and EA-CG were further purified by gel filtration (Sephadex G-10, Pharmacia, Uppsala, Sweden) on a 4 × 12 cm column eluted with water at a flow rate of ∼2 ml/min. The eluent was collected and analyzed by HPLC, and the fractions eluting at 45 to 65 and 25 to 50 min were pooled for the EA-CYS and EA-CG fractions, respectively, and lyophilized. EA-SG was purified by solid-phase extraction using Sep-Pak C18 cartridges (2 g; Waters, Milford, MA). The EA-SG-loaded cartridges were washed with 4 ml of water followed by 12 ml of 20% CH3CN, and the conjugate was eluted with 50% CH3CN. EA-NAC was purified by acid extraction (pH ∼1.0 with 1 N HCl) into ethyl acetate (2 × 25 ml). Identification of the final products was carried out by mass spectrometry (Sciex API III; MDS-Sciex, Thornhill, ON, Canada), which gave protonated molecular ions [MH+] m/z of 424, 481, 610, and 466 for EA-CYS, EA-CG, EA-SG, and EA-NAC, respectively. Analysis of the EA-thiol conjugates by the HPLC method described below indicated chemical purities >99% for EA-CYS and EA-NAC, >98% for EA-CG, and >97% for EA-SG.
Stability of EA-Thiol Adducts.
The stability of EA and the EA-thiol conjugates at pH 7.4 and 3.2 was examined at 37°C. These pH conditions were chosen for study because they are encountered physiologically and during the assay procedure, respectively. Solutions containing 1 mg EA or one of the EA-thiol conjugates dissolved in 10 ml of 100 mM potassium phosphate were incubated at 37°C. An aliquot of 200 μl was removed at various times, mixed with 20 μl of 1 N HCl, 50 μl of internal standard (4.1 mM DCPBA in CH3CN) and subjected to HPLC analysis as described below. EA was stable at both pH conditions (7.4 and 3.2) for the duration of the incubations (Fig. 1, A and B). All of the thiol metabolites were stable at pH 3.2 (Fig. 1B) but were unstable at pH 7.4 (Fig. 1A), with decay half-lives of 0.32, 0.76, 8.5, and 59 h for EA-CYS, EA-CG, EA-SG, and EA-NAC, respectively. Retro-Michael cleavage that results in formation of the parent compound has been suggested as the mechanism for degradation of these metabolites (Haenen et al. 1996), because the decline in the thiol conjugates was associated with the appearance of EA (data not shown). For this reason, all perfusate and bile samples were acidified immediately upon collection before storage or analysis.
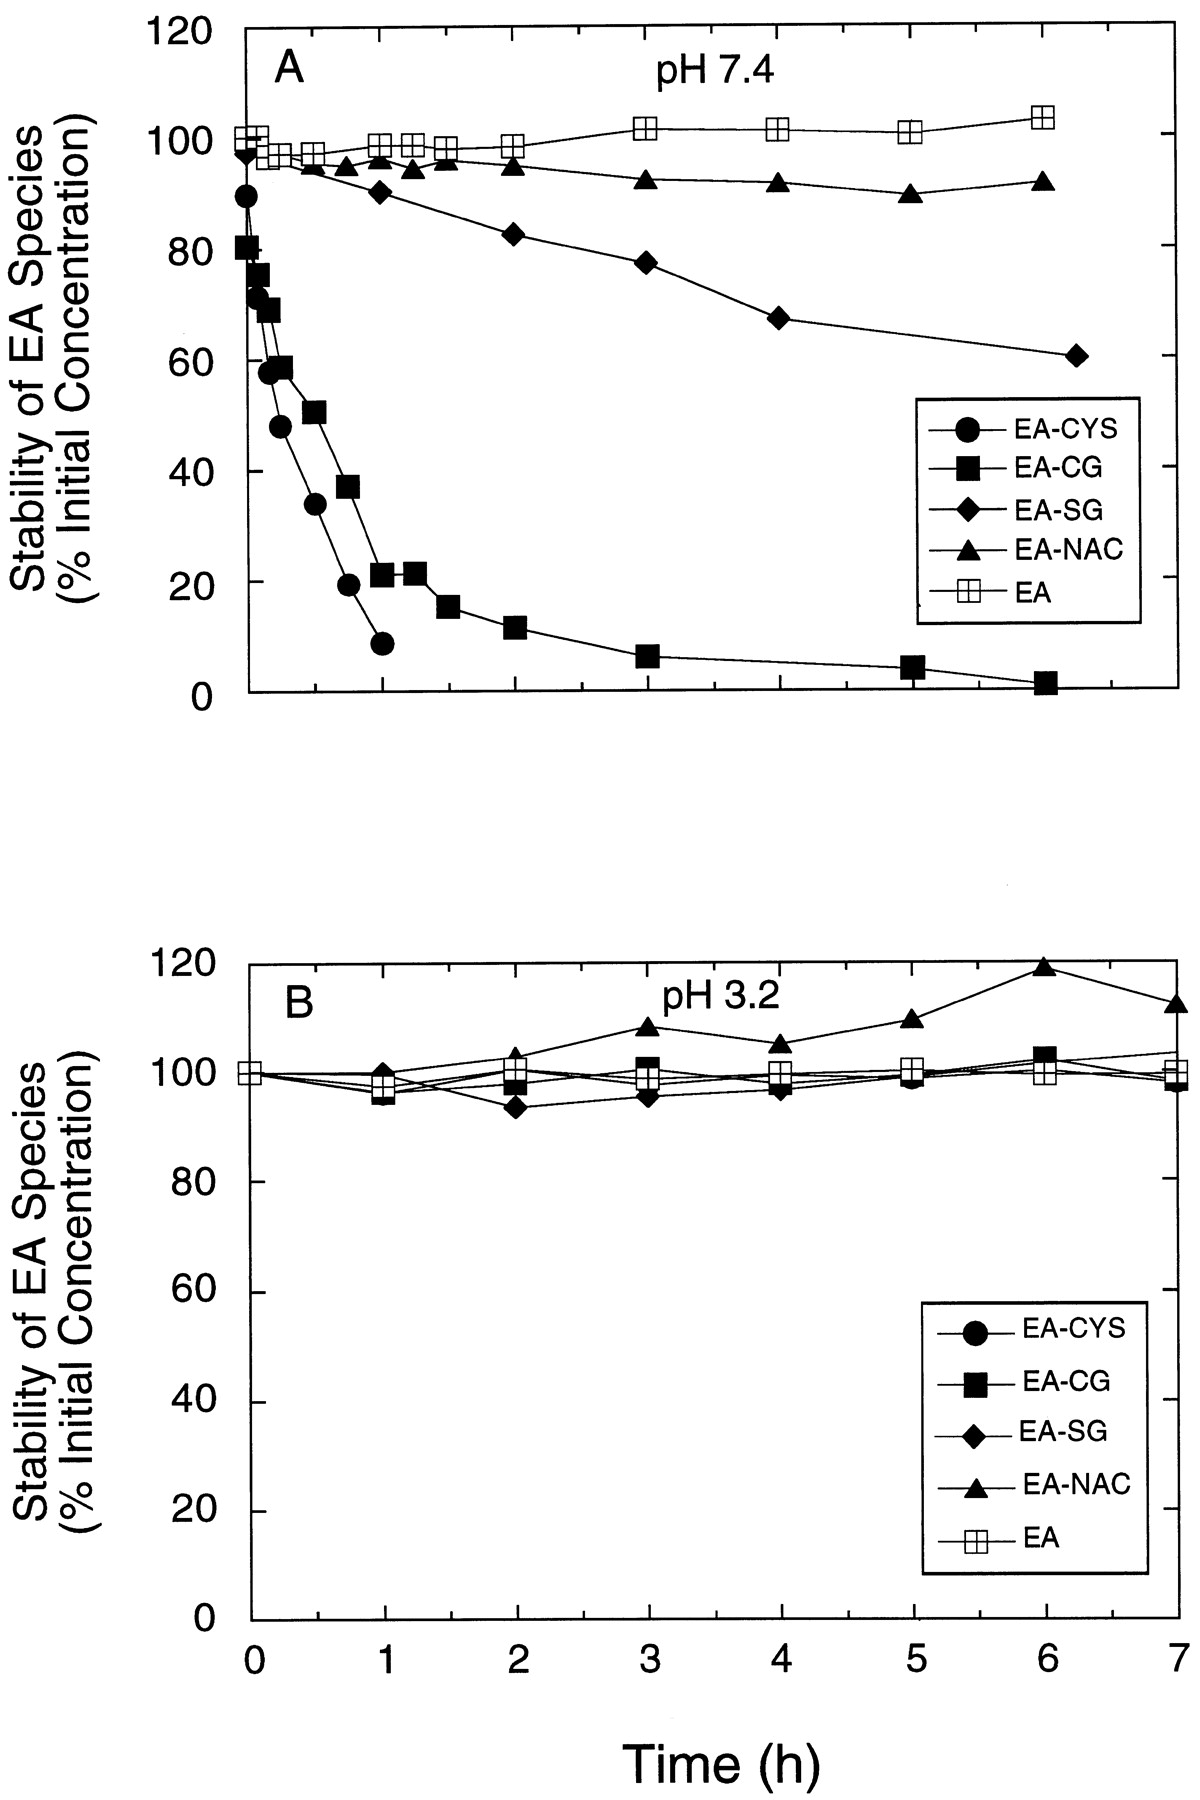
Stability of EA and thiol metabolites in (A) 100 mM potassium phosphate buffer pH 7.4 and (B) 3.2 at 37°C.
HPLC Assay for EA and its Thiol Conjugates.
For the assay of EA and metabolites in perfusate plasma, standard curves were prepared by adding various amounts of EA (2–200 μM) and its conjugates (2–100 μM) to acidified blank plasma (0.1 ml 1 N HCl with 1 ml blank plasma). After the addition of 50 μl of internal standard (4.1 mM DCPBA in CH3CN; LaCreta et al., 1991) and an additional 100 μl of 1 N HCl, 6 ml of CH3CN was added for protein precipitation. Preliminary attempts to precipitate the proteins with methanol resulted in the degradation of EA and formation of a new product, presumably the methyl ester described by Midha et al. (1978). Upon centrifugation at 3000g for 10 min, the supernatant was removed and dried under N2 gas at ambient temperature. The resulting residue was reconstituted with 200 μl HPLC diluent (mobile phase A/mobile phase B 65:35, as described below), and a portion of this was injected into the liquid chromatograph. Plasma samples were processed in an identical fashion. Bile was diluted 200- to 400-fold with the HPLC solvent, spiked with 165 nmol of DCPBA, then injected into the HPLC. The species were quantified with use of calibration curves consisting of EA and its conjugates (1–100 μM) and the internal standard.
The HPLC system (Shimadzu Corporation, Kyoto, Japan) consisted of two pumps (LC-6A), a UV detector (SPD-6A) set at 275 nm, an autoinjector (SIL-6A), an integrator (C-R3A), and a system controller (SCL-6A). A binary gradient consisting of mobile phase A (50 mM potassium phosphate, pH 3.2) and mobile phase B (CH3CN) was used at a constant flow rate of 1 ml/min for the separation of EA and the thiol conjugates by a reversed-phase column (μBondapak C18, 3.9 × 300 mm; Waters). The mobile phase was initially maintained at CH3CN 18% for 25 min, followed by a linear increase to 35% CH3CN for 30 min, and was maintained at 35% CH3CN for another 15 min before being brought back down to 18% CH3CN over the next 5 min. The mobile phase was kept at 18% CH3CN for another 5 min to allow for column re-equilibration. Calibration curves were constructed with the area ratio method. For validation of the assay procedures, standard curves for EA and its thiol adducts prepared in perfusate (plasma) were assayed on 3 separate days. Intraday variability was determined in triplicate perfusate plasma samples spiked with high (50–100 μM) and low (2–10 μM) concentrations of EA and its metabolites with HPLC.
Nonenzymatic and Enzymatic (Rat Liver Cytosol-Catalyzed) EA-SG Formation.
The spontaneous rate of EA-SG formation in absence of GST was first determined at various concentrations of EA (25–200 μM) and GSH (1–10 mM) by the method of Habig et al. (1974) as described bySatoh (1995). Briefly, reactions were carried out in 100 mM potassium phosphate, pH 7.2, at 37°C and were initiated by the addition of 300 μl of EA dissolved in 40% ethanol to GSH (3 ml final reaction volume). The UV absorbance at 270 nm was determined at 10- to 20-s intervals using a Uvicon 860 spectrophotometer (Kontron Instruments, Everett, MA) until completion of the reaction (5–8 min). The pseudo first-order rate constant, k1, was calculated from a plot of log (absorbance at ∞ − absorbance at time t) versus time, and upon multiplication of this value by the initial concentration of EA, furnished the reaction rate (v) as determined with the equation, k1[EA]initial = v. The calculated v was in turn used to estimate k2, the second-order rate constant, by a least-squares minimization procedure (Scientist; MicroMath Scientific Software, Salt Lake City, UT) according to the equation v = k2[GSH]initial [EA]initial with data generated from different concentrations of EA and GSH.
For examination of the influence of hepatic enzymes (GST) on the rate of GSH conjugation of EA, rat liver cytosol (100,000g supernatant, ∼0.1 mg protein/ml) was included in the reaction mixture, which contained various concentrations of EA (25 to 200 μM) and GSH (0.25–5 mM). The reaction rates were normalized to the concentration of protein that was quantified by the method of Lowry et al. (1951) with BSA used as the standard. After correction for the spontaneous reaction, the enzymatic rates were fitted to a single enzyme, rapid equilibrium random sequential scheme as proposed byJakobson et al. (1979):
Uptake of EA by Isolated Hepatocytes.
Hepatocytes from male Sprague-Dawley rats (295–315 g) were prepared as described by Hassen et al. (1996). These were suspended in Krebs-Henseleit bicarbonate buffer (pH 7.4) supplemented with glucose (5 mM) and HEPES (1 mM). Their viability exceeded 90% as assessed by trypan blue exclusion. In the first set of uptake studies, concentration dependency for EA uptake was investigated by the addition of a mixture of [3H]sucrose (extracellular maker), [14C]EA, and varying amounts of unlabeled EA in 0.9% NaCl to achieve final EA concentrations of 1 to 800 μM in the hepatocyte suspension (∼1.67 × 10⁶ cells/ml). At 15- to 20-sec intervals, samples (50 μl) of the incubation mixture were removed and immediately filtered through silicon oil into NaOH (bottom layer) and analyzed for cellular uptake; aliquots (25 μl) of the supernatant were taken for radioactivity counting. In cis-inhibition experiments, the uptake of [14C]EA (25 μM) was studied with or without TCA (200 μM), BSP (20 μM), E2-17β-G (10 μM), and BUM (200 μM) at inhibitor concentrations that were saturating for hepatocyte uptake (Meier et al., 1997). Na+dependency for EA uptake was investigated in experiments in which the sodium chloride and sodium bicarbonate in the incubation medium were replaced by choline chloride and potassium bicarbonate, respectively. The [14C]EA taken up into hepatocytes was analyzed by liquid scintillation spectrometry (Model LS5801; Beckman Canada, Mississauga, ON), after correcting for the adhered extracellular water layer defined by [3H]sucrose. The uptake rates of EA in the presence of inhibitors and in absence of sodium ion were expressed as percentages of the control uptake rates.
Because the accumulation of EA into hepatocytes was linear over 60 to 80 s, regression of the accumulation profile yielded a slope that designated the initial uptake velocity (vuptake). For experiments in which varying EA concentrations were used, the vuptake was fitted versus the substrate concentration [EA] according to Eq. 2 with a least-squares fitting routine (weighting scheme of 1/[EA]),
The uptake clearance (PSin or influx rate/concentration) at the organ level could be estimated by the following equation (Sasabe et al., 1997):
Protein Binding of EA to BSA in Perfusate.
The extents to which various concentrations of EA (2–400 μM) bind to albumin (1%) in perfusate, pH 7.4, was studied by equilibrium dialysis at 37°C (Spectrapor, molecular cutoff at 12,000 to 14,000 Da; Spectrum Medical Industries Inc., Los Angeles, CA). Preliminary experiments indicated that equilibrium was achieved within 2 h and dialysis was carried out over 3 h. The protein and buffer compartments were analyzed by HPLC.
The binding data was best fitted to the following binding isotherm, which includes one saturable and one nonsaturable binding component:
Erythrocyte-Free Rat Liver Perfusion.
Red blood cell metabolism of EA to EA-SG was noted in preliminary liver perfusion studies conducted with 20% red blood cells. Hence, an erythrocyte-free perfused liver preparation was used to avoid the added complication. For adequate oxygenation of the liver, perfusate plasma (1% albumin and 300 mg% glucose in Krebs-Henseleit bicarbonate solution, pH 7.4) was delivered at a flow rate of 25 ml/min to the livers of male Sprague-Dawley rats (241–340 g; liver weight, 8.2–13.6 g; obtained from Charles River, St. Constant, QC, Canada). Surgery was performed under pentobarbital anesthesia (50 mg/kg, i.p.), and the surgical procedure and perfusion apparatus were identical to those described previously (Pang et al., 1988). Each liver was perfused through the portal vein in the absence of an arterial contribution, and the perfusate exited via the hepatic vein; the hepatic artery was ligated. Bile was collected through a cannula (PE10 tubing) inserted into the bile duct. The temperature of the liver was maintained at 37°C with a heat lamp. Livers were perfused for 2 h with drug-free medium to assess the viability of livers undergoing erythrocyte-free perfusion. Liver viability was assessed by gross appearance, bile flow rate, oxygen consumption (monitored by a Clark-style oxygen electrode; Instech Laboratories, Horsham, PA) and leakage of alanine aminotransferase assayed by a commercially available colorimetric kit obtained from Sigma.
EA Liver Perfusion Experiments.
In EA perfusion experiments, livers were initially perfused for 10 min with drug-free perfusate for equilibration of the liver preparation, followed by a 90-min perfusion with EA-containing medium of only one concentration (8.2–194 μM). At 0, 30, 60, and 90 min, the input perfusate reservoir was sampled for the determination of EA concentration. The mean of these determinations was used to denote the steady-state input concentration, CIn,ss. At 5, 10, 15, 30, 45, 60, 75, and 90 min, the outflow perfusate was collected for determination of EA (COut) and metabolite concentrations; the mean of the determinations that had remained constant and maximal was taken as COut,ss, the steady-state output concentration. For perfusate collection, 0.1 ml of 1 N HCl was added to 1 ml of perfusate immediately after sampling to avoid degradation of the metabolites. Bile was allowed to drain directly into tared glass vials containing 50 μl of 1 N HCl at 10-min intervals. The difference in weight before and after bile collection was taken to be the volume of bile, after the assumption that the density of bile is 1.0 g/ml. The acidified plasma and bile samples were stored at −20°C until analysis. At the completion of each experiment (90 min), the liver was quickly weighed and a section was immediately processed for total GSH and GSSG content using the derivatization and HPLC method of Fariss and Reed (1987).
The steady-state extraction ratio (ESS) of EA was estimated from the relation that ESS = (CIn,ss− COut,ss)/CIn,ss, and was the mean of six to eight determinations. However, at high EA concentrations (Experiments 1 to 4), ESS was estimated as the mean of the determinations obtained between 15 and 30 min, because values of E beyond these times declined with time. The total amount of EA or EA-SG appearing in the venous outflow plasma or bile was estimated as the area under the plasma concentration-time curve or area under the excretion rate-time curve from t = 0 to 90 min for each species, with use of the linear trapezoidal rule. Recovery was determined by summing the total plasma and biliary output of EA and its metabolites and expressing this value as a fraction of the total amount of EA administered.
Physiological Modeling.
The disposition of EA was modeled using a physiological model that assumes well-stirred liver plasma and cellular compartments as shown in Fig. 2(see the for mass balance equations and parameters obtained in vitro; Table 1). The saturable uptake (Kmuptake and Vmaxuptake) and the bidirectional (uptake and efflux) linear clearance (Pdiff) parameters were scaled up from isolated hepatocyte uptake data (Eqs. 3 and 3A) to describe the sinusoidal EA transmembrane movement. Modeling efforts included consideration of plasma protein binding, and the unbound EA traverses across membranes and becomes eliminated. Because the apparent Michaelis-Menten constants for GSH (KmGSH) and EA (KmEA) were known from in vitro cytosol-catalyzed EA metabolism experiments, only the maximal conjugation rate (Vmaxmetab) was estimated by the fitting procedure. Because all EA conjugates (EA-SG, EA-CG, and EA-CYS) in bile originate from EA-SG or from intrabiliary hydrolysis (Hinchman et al., 1991), all metabolite species, including the EA-NAC that arose from EA-CYS, were summed to provide an estimate of the biliary excreted EA-SG. The EA-SG formed in the liver cell was assumed to undergo net sinusoidal efflux, denoted by the first-order clearance, Pdiff{EA-SG}, and undergo biliary excretion with the biliary intrinsic clearance denoted by CLb{EA-SG}; these parameters were fitted. The intracellular GSH content was governed by a zero-order synthesis rate (of rate constant Ksyn{GSH}); the consumption of GSH via conjugation with EA is also a bimolecular reaction, whereas the degradation accounting for its natural turnover is a first-order removal process of clearance, CLdeg{GSH}. These constants were retrieved from the literature (Johanson and Filser, 1993; Chen and Gillette, 1988), whereas the initial cellular GSH concentration ([ GSHct=0]) that may vary among livers was obtained through fitting, because the parameter is a key determinant of GSH conjugation. The fitted parameter values, together with the assigned parameters, are shown in Table 1. Data from individual experiments (plasma and bile output rates of EA and conjugates, and the GSH content in liver) were simultaneously fitted to the model (Fig. 2) with use of a nonlinear least-squares procedure (Scientist) and a weighting scheme of 1/observed value. All output rates were adjusted according to the recoveries of individual experiments.

Scheme for the hepatic disposition of EA and its GSH conjugate, EA-SG in the physiological kinetic model. EA uptake is by saturable (denoted by Vmaxuptake and Kmuptake) and nonsaturable (Pdiff) processes. GSH conjugation of EA proceeds enzymatically catalyzed by the GSH S-transferases (GSTs, with kinetic constants KmEA, KmGSH, and Vmaxmetab) and nonenzymatically (with the bimolecular constant, k2). The intracellular concentration of GSH was maintained by its synthesis (Ksyn{GSH} and degradation (CLdeg{GSH}). The formed EA-SG undergoes biliary excretion (CLb{EA-SG}), or undergoes net efflux (Pdiff{EA-SG}). See text for details of the model.
Parameters for the physiological kinetic model
Data Calculations.
Data were presented as mean ± S.D. For comparisons, ANOVA was performed and a p value of .05 was viewed as significant.
Results
HPLC Assay.
With the EA conjugates being acid-stabilized during sample collection, the new HPLC system was capable of separating EA and its thiol metabolites in biological fluids. The retention times were 16, 20, 23, 35, 40, and 43 min for EA-CYS, EA-CG, EA-SG, EA-NAC, EA, and the internal standard, DCPBA, respectively. The standard curves for EA and the conjugates in plasma and bile were linear (r2 > 0.99) over the concentrations studied. The interday coefficients of variation for EA and its metabolites ranged from 2 to 8%, whereas intraday variation ranged from 2 to 11%.
Nonenzymatic and Enzymatic EA-SG Formation.
The spontaneous conjugation of EA with GSH was rapid at pH 7.2 (Fig.3A), and the rate was linearly related to the concentrations of EA and GSH. The second-order rate constant, k2, for nonenzymatic GSH conjugation was estimated to be 126 ± 4 μM−1 min−1(mean ± S.D. of estimate) with computer fitting (r2 = 0.978). Addition of rat liver cytosol to EA (25–200 μM) and GSH (0.25–5 mM) resulted in increased rates of GSH conjugation above and beyond the spontaneous rate (Fig. 3B). Fitting of the data to Eq. 1 furnished estimates of the dissociation rate constants for EA (KmEA = 94 ± 16 μM) and GSH (KmGSH = 1.2 ± 0.2 mM), and for the Vmaxmetab of the reaction (533 ± 49 nmol/min/mg protein or 32 μmol/min/g liver based on 60 mg of cytosolic protein/g liver). The observations confirm that under physiological conditions, the spontaneous GSH conjugation rate of EA is quite high, as found by Satoh (1995), but the enzyme-catalyzed GSH conjugation rate of EA in the rat liver cytosol greatly exceeds the spontaneous rate, as also observed by Ploemen et al. (1993).

(A) Nonenzymatic (spontaneous) and (B) enzymatic (rat liver cytosolic protein-enhanced) EA-SG formation in 100 mM potassium phosphate buffer, pH 7.2, at 37°C and initial EA and GSH concentrations of 25 to 200 μM and 0.25 to 5 mM, respectively (n = 3 rat livers). Surface plot was obtained by nonlinear regression analysis to equations found in the text.
EA Uptake by Isolated Hepatocytes.
EA uptake was linear over 60 to 80 s (data not shown) and displayed concentration dependency (Fig. 4). Fitting of vuptake (initial velocity obtained from the slope of the accumulation-time curve) versus EA concentration (Eq. 2) furnished the kinetic constants for uptake: Kmuptake of 57 ± 22 μM, Vmaxuptake of 4.4 ± 1.8 nmol/min/mg or 0.55 μmol/min/g liver, and Pdiff of 0.015 ± 0.006 ml/min/mg (mean ± S.D.). Upon scaling of the cellular uptake parameters, the maximal influx clearance of EA at the organ level was estimated to be 11.4 ml/min/g liver (Eq. 3A), a value that is about five times the value of perfusate flow to the liver. EA (25 μM) uptake was further found to be sodium-independent, and wascis-inhibited by the organic anions BSP (10 μM), TCA (200 μM), and BUM (200 μM) (25 to 50% inhibition) but not by E2-17β-G (10 μM) (Table2).
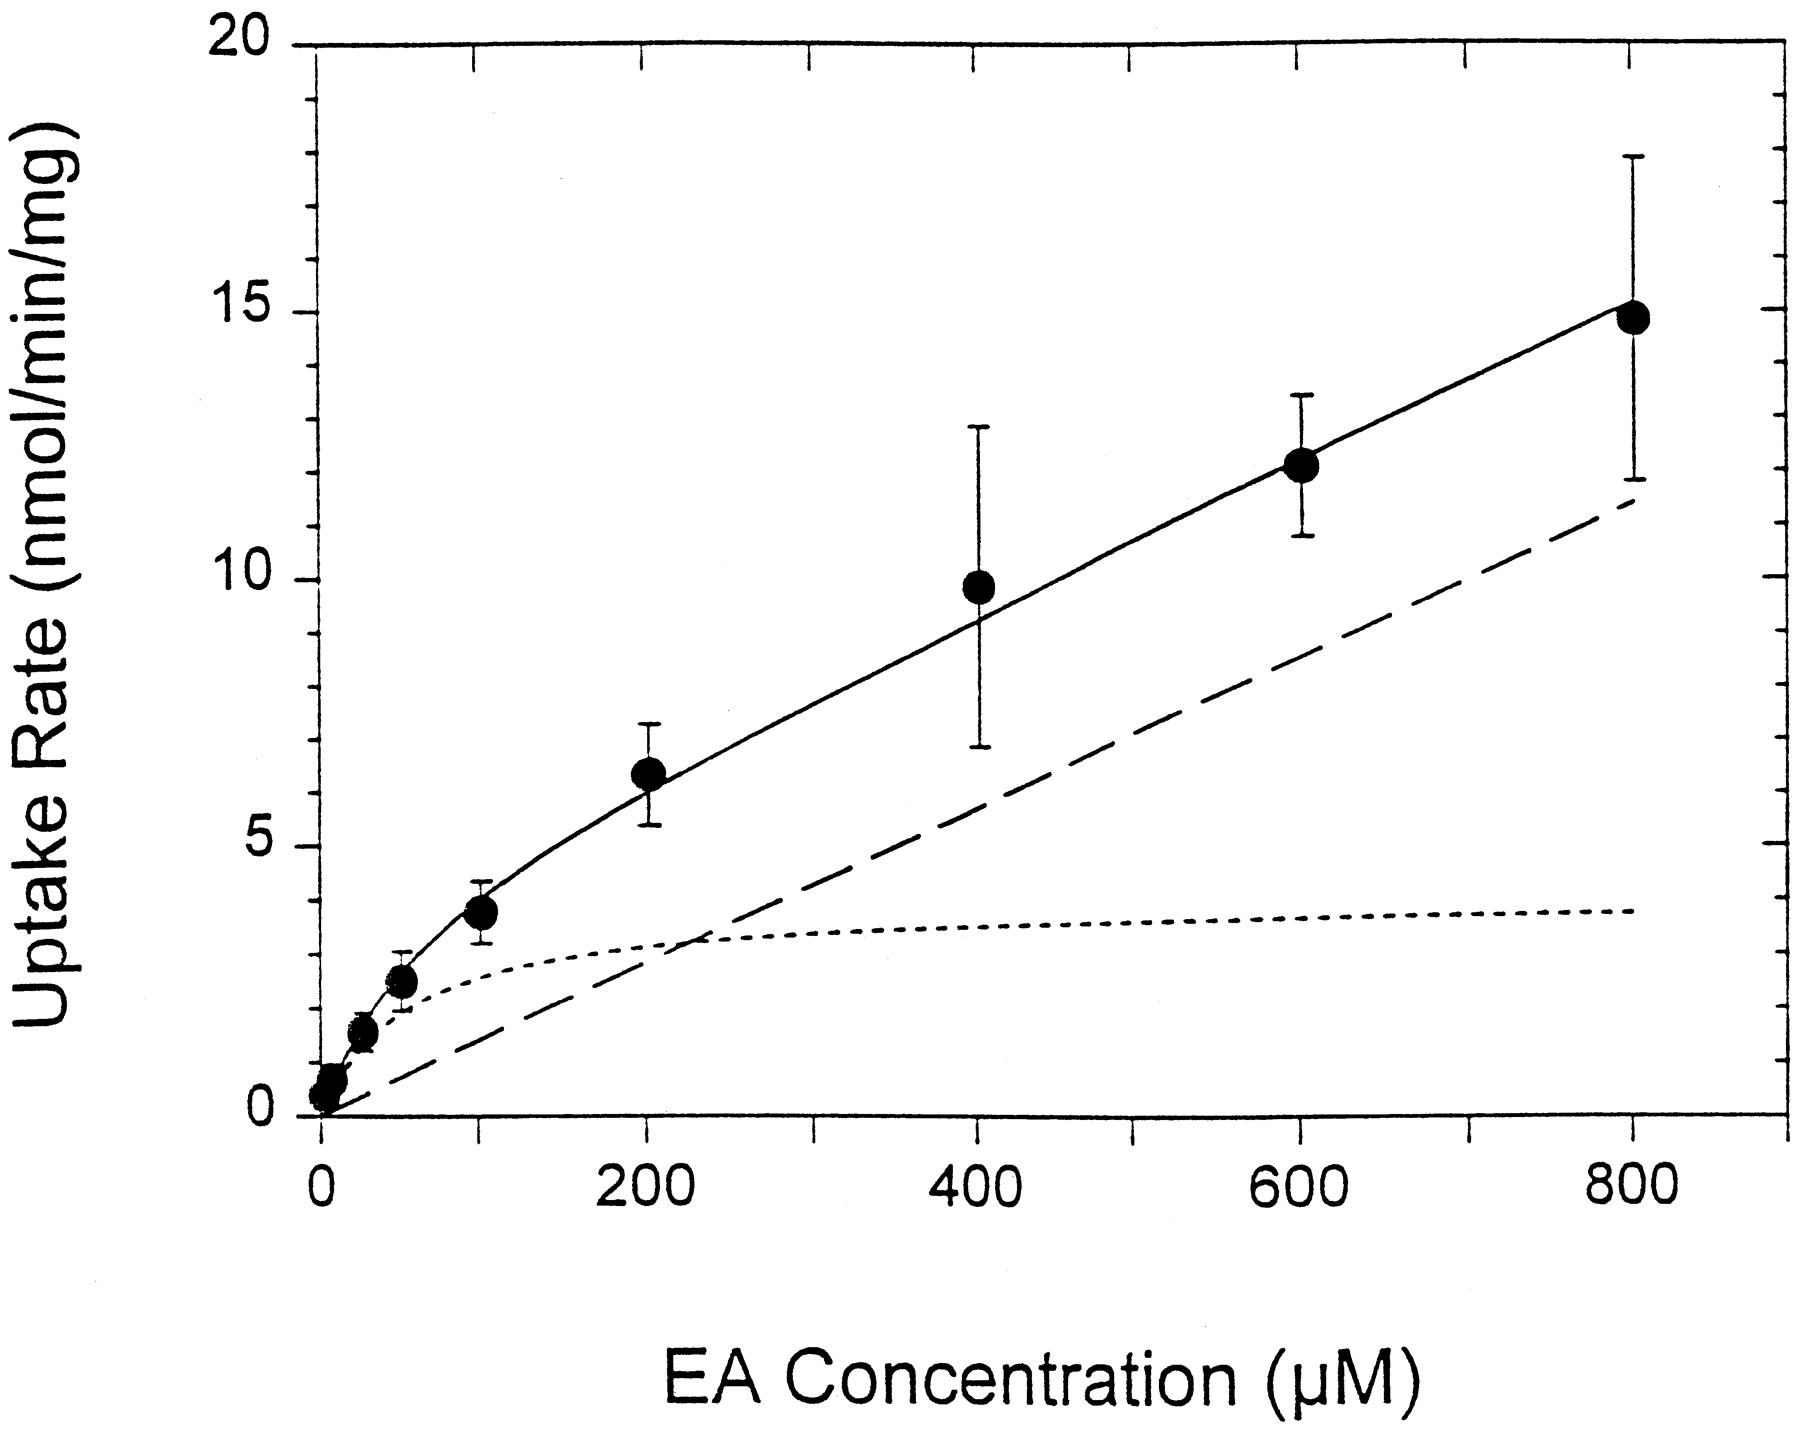
Concentration-dependent uptake of EA by isolated rat hepatocytes (n = 4). The initial velocity was obtained from the slope of the accumulation versus time data. The fitted line (solid line) from nonlinear least-squares fitting to Eq. 2 consisted of a saturable (dotted line) and nonsaturable (dashed line) component.
Effect of Na+ replacement and organic anions on [14C]EA (25 μM) uptake by isolated rat hepatocytes
Protein Binding of EA to BSA.
EA exhibited tight binding to perfusate plasma consisting of 1% BSA. The unbound plasma fraction (fu) ranged from 0.02 to 0.07 (Fig.5B) over the concentrations studied (2–400 μM). Results arising from nonlinear fitting of data to eq. 4suggest the presence of saturable and nonsaturable binding, yielding 1.3 ± 0.3 binding sites (or n) of KD (dissociation constant) of 2.6 ± 1.1 μM, and a linear binding constant, kL, of 6.9 ± 1.9 (fitted value ± S.D. of the estimate) (Fig. 5A).

Protein binding of EA to perfusate containing 1% BSA. (A) Plot of the total (Ct) and unbound (Cu) plasma concentrations and (B) unbound fraction versus the total plasma concentration as determined by equilibrium dialysis at 37°C. The line was obtained by fitting of the data to Eq. 4. The line is the fitted line based on the fitted parameters.
Liver Viability.
Rat liver perfusion conducted with EA at concentrations up to 200 μM (n = 10) showed a lack of observable deleterious effects towards the liver viability, and leakage of aminotransferase was minimal (Fig.6A). Oxygen consumption was maintained at an adequate level (>2 μmol/min/g) for the entire 90 min of perfusion (Fig. 6B), and the values were generally similar to those for control livers (n = 3) as well as other erythrocyte-containing perfusion systems (Pang et al., 1988). Bile flow rates were rather constant (about 1 μl/min/g) in control livers (data not shown), but were increased linearly in relation to EA-SG excretion (Fig. 6C), showing that an additional 20 μl of bile flow was associated with approximately 1 μmol of EA-SG excreted (Fig. 6C).

Characterization of the viability of the erythrocyte-free rat liver perfused at 25 ml/min by (A) aminotransferase activity in venous perfusate and (B) oxygen consumption. The bile flow rate of the perfused liver was further presented as a function of EA-SG excretion rate (C) [n = 3 for control (○); n = 10 for EA (●)].
Concentration-Dependent Metabolism of EA in Perfused Rat Liver.
Essentially all of the input dose was recovered as EA or its thiol metabolites in outflow perfusate and bile (recovery 101 ± 8%), confirming that GSH conjugation is the major metabolic fate of EA in rat liver (Table 3). Biliary excretion of unmetabolized EA was insignificant (0.2% of biliary species). The majority of the metabolized EA was excreted in bile existed mainly as EA-SG, with lesser proportions as the cleavage metabolites (EA-CG > EA-CYS > EA-NAC). EA-SG was the only metabolite found in outflow perfusate and represented 11 ± 6% of all metabolites escaping the liver. Steady state was achieved within 10 to 20 min after EA perfusion. At low EA concentrations (<50 μM), steady-state removal was maintained throughout the perfusion period, whereas at higher concentrations, removal was constant only for an initial, short attainment of steady state and declined thereafter (>30 min perfusion; Fig. 7A); the same was observed for EA-SG formation (Fig. 7B), which was maximal between 15 and 30 min of perfusion. Lack of maintenance of steady state at high EA concentration was likely due to depletion of GSH. Indeed, the intrahepatic GSH and GSSG contents in several of the liver preparations at the end of perfusion were low and were inversely related to the input EA concentration, denoting that depletion of GSH by EA was also concentration-dependent (Fig. 8).
Summary of dose recovery during rat liver perfusion
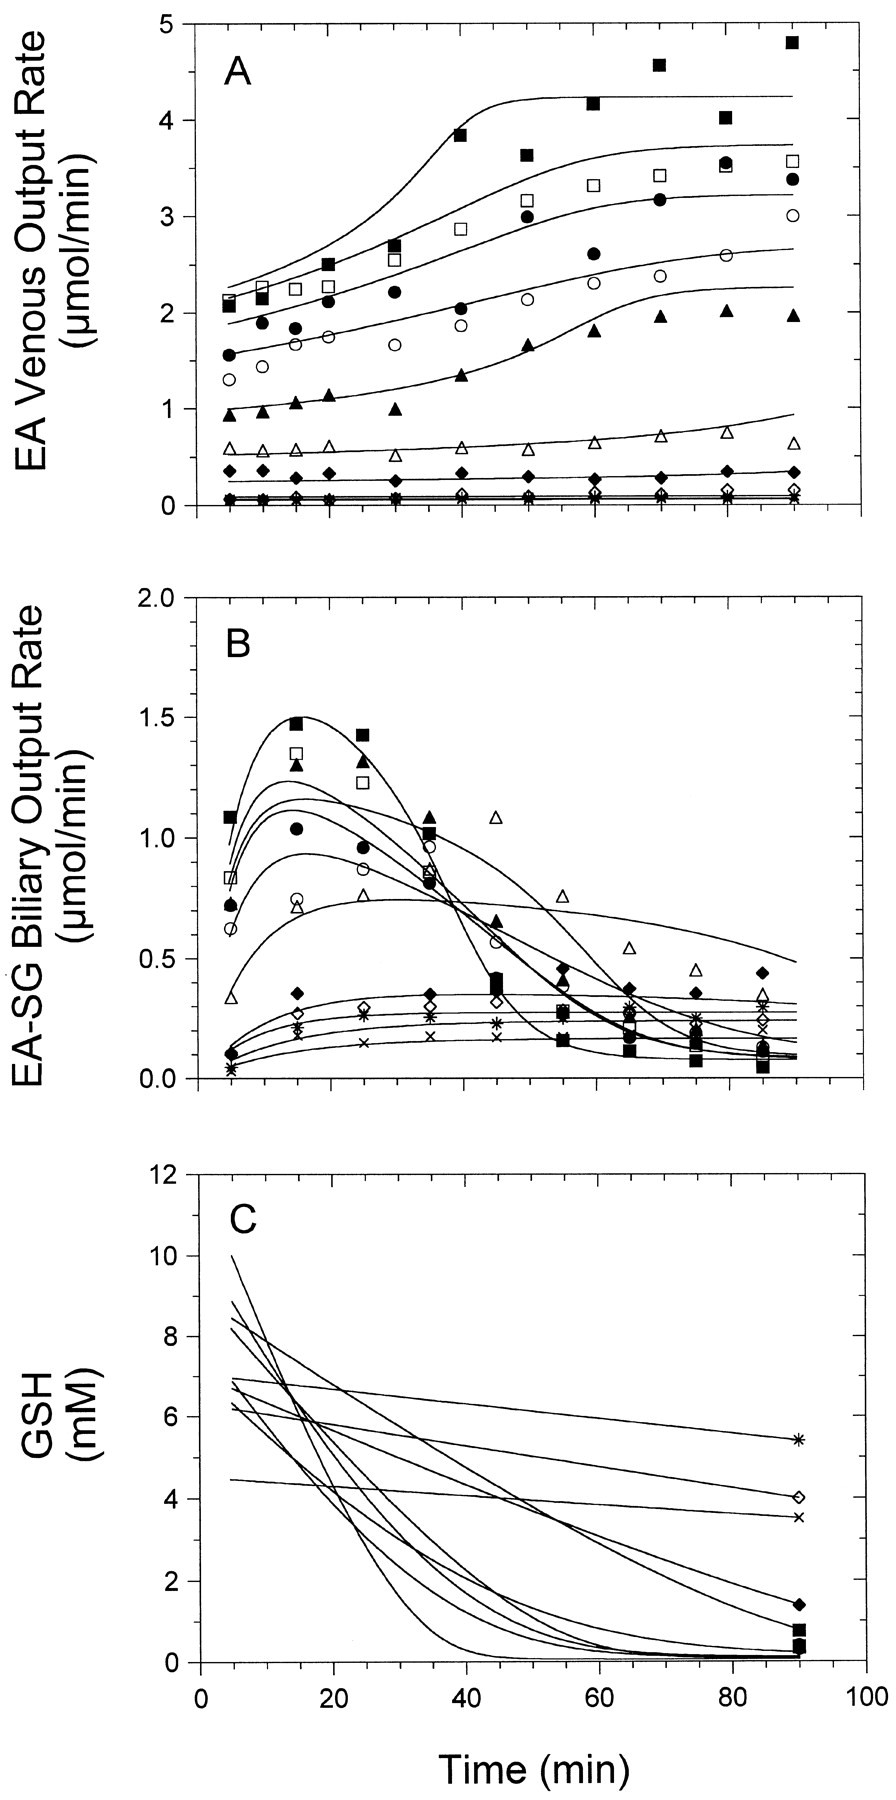
Concentration- and time-dependent GSH conjugation of EA in the single-pass perfused rat liver. A, output rates of EA in venous perfusate; B, biliary excretion rates of EA-SG (sum of all thiol metabolites); and C, GSH concentration in liver were plotted versus time. Each symbol represents the results of an individual experiment with a single EA input concentration, and the lines were obtained through least-squares fitting with the physiological kinetic model shown in Fig. 2.

Hepatic GSH (●) and GSSG (○) contents remaining in liver after 90 min of perfusion with various EA input concentrations.
The extraction ratio of EA existing at the steady state (ESS) between 15 and 30 min decreased from a high value of ∼0.8 to 0.4 (Fig. 9A), whereas the corresponding steady-state formation rates of EA-SG (sum of all metabolites escaping into bile and outflow perfusate) displayed saturation with increasing EA input concentration (Fig. 9B). When the EA-SG formation rate was fitted against the logarithmic average EA concentration, Ĉ = [(CIn,ss − COut,ss)/ln(CIn,ss/COut,ss)] as an estimate of the substrate concentration in liver, with the simple Michaelis-Menten equation, voverall = (Vmaxoverall ×Ĉ)/(Kmoverall + Ĉ), values of 67 ± 46 μM for Kmoverall and 0.23 ± 0.7 μmol/min/g liver for Vmaxoverall (fitted value ± S.D. of estimate) were obtained.
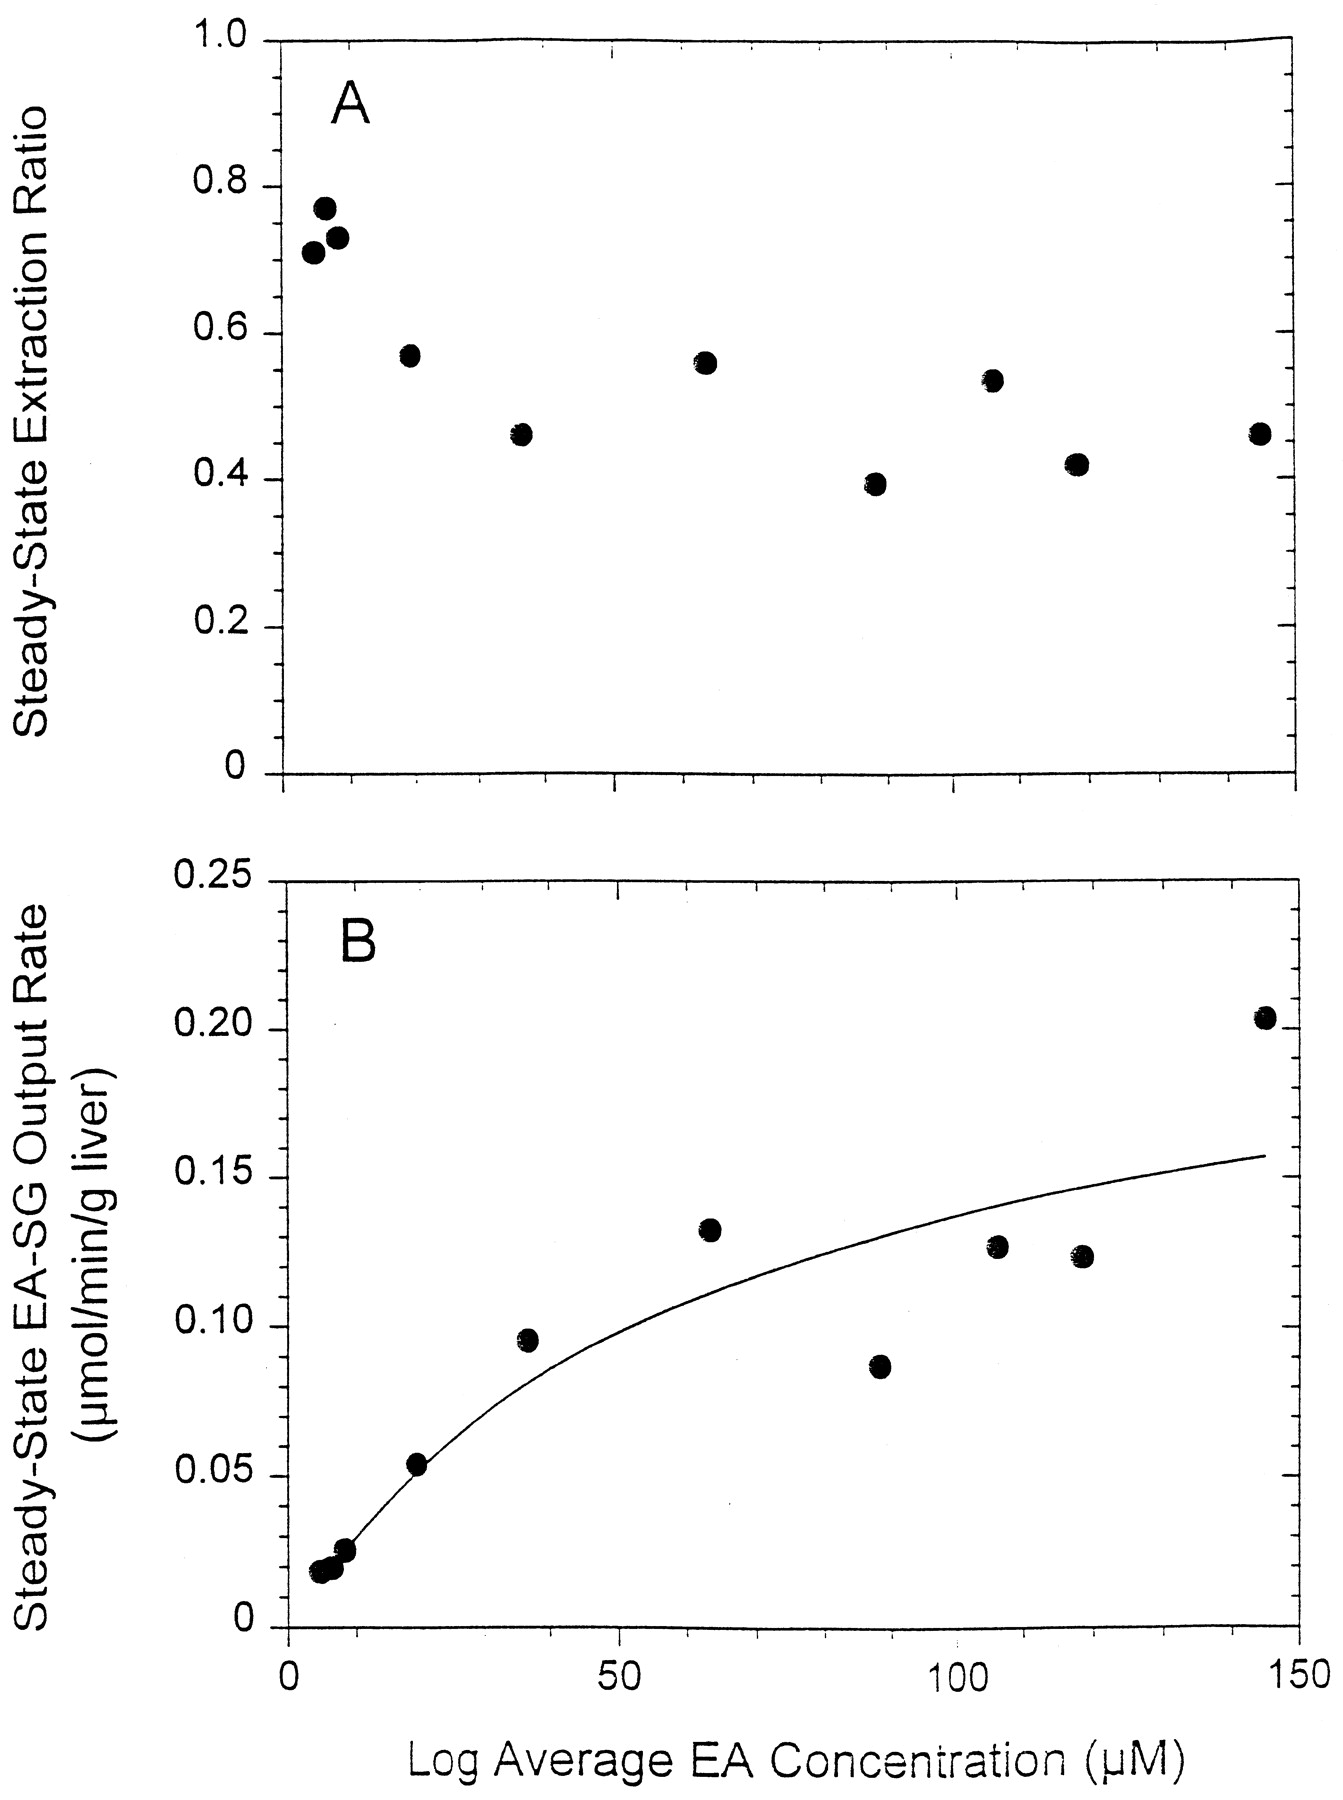
The steady-state kinetics of removal of EA during single-pass rat liver perfusion at various EA input concentrations: A, extraction ratio of EA; and B, overall EA-SG formation rate (sum of all thiol metabolites) were presented. The line was obtained by least-squares fitting to the Michaelis-Menten equation.
Physiological Modeling.
Several strategies were tried for physiological modeling using the mass transfer equations shown in the. Because the bimolecular kinetics on in vitro cytosol-catalyzed (enzymatic) GSH conjugation of EA were consistent with a single enzyme described by the rapid-equilibrium random sequential scheme (Eq. 1), a similar equation that included both the enzyme-mediated and spontaneous GSH conjugations was used to describe the GSH conjugation rate of EA in the perfused liver (see ). The uptake parameters (Kmuptake, Vmaxuptake, and Pdiff) obtained from isolated hepatocyte studies were used in the fitting procedure.
An approach that included fast dissociation of the protein-bound EA (rapid equilibration between bound and unbound species) was first used to preserve the notion that the unbound species participated in transfer and removal. The predicted Ess values and associated removal rates were, however, too low in comparison with those observed. The use of the Kmuptake and Vmaxuptake and Pdiff, in combination with other parameters, failed to predict the high hepatic extraction of EA unless all of the EA in perfusate, bound and free, were treated as free species. Hence, the assumption that all EAs, bound and unbound, were able to participate in mass transfer was taken, and the equations describing the mass transfer of EA and EA-SG in the implied the total concentration. Under this instance, the fit of the hepatic venous EA and biliary EA-SG output rates of each experiment to the physiologic model (Fig. 2) was satisfactory (Fig. 7), although the fit of the hepatic venous EA-SG output data was generally poorer (data not shown); the latter might be due to the oversimplification of the transmembrane transport process of EA-SG (Pdiff{EA-SG}) as a linear unidirectional process. The underlying mechanism for EA-SG transport, however, would not affect the estimation of the kinetic constants for formation of EA-SG.
The fitted parameters are summarized in Table 1. Estimates of the initial cellular GSH concentration yielded a mean value of 8.0 ± 2.0 mM, a value that is consistent with average rat hepatic GSH content (∼6 μmol/g liver or ∼9 mM, given 0.64 ml cell volume/g liver) in control livers perfused with drug-free perfusate (data not shown). Although there was much variability in the initial GSH concentration among livers (Fig. 7C), it was necessary to fit this parameter individually because the use of a common value for all livers resulted in poorer fits. The estimate of KmGSH (1.2 mM) was of the same order of magnitude as those previously found previously (0.2–0.5 μmol/g or 0.3–0.8 mM; Polhuijs et al., 1992;Snel et al., 1995). The value of the fitted Vmaxmetab (3.2 μmol/min/liver) was much lower than that estimated from in vitro experiments (320 μmol/min for a 10-g liver) and the reason was not apparent. The discrepancy existing between the in vitro and fitted Vmaxmetab is likely due to the poorer estimation of this parameter at the low EA input concentrations, because saturation in metabolism was not approached under this condition.
Discussion
In the present study, we confirmed that GSH conjugation of EA occurred spontaneously but at a rate considerably less than that for enzyme-catalyzed GSH conjugation (Fig. 3). Cellular uptake studies with isolated rat hepatocytes revealed that EA uptake was concentration-dependent and could be described by saturable and linear processes (Fig. 4). At low concentrations (<25 μM) and those seen clinically (LaCreta et al., 1994), hepatic uptake of EA is mediated mainly by a carrier-mediated process that lacks sodium dependence and shows observable but modest inhibition by TCA, BSP, and E2-17β-G (Table 2), high-affinity substrates/inhibitors of rat organic anion transporter (oatp1) (Meier et al., 1997). The data suggest that EA is not a substrate of ntcp, the sodium-dependent taurocholate transporter or oatp1, since >86% inhibition was calculated for TCA, BSP, and E2-17β-G with competitive inhibition. The demonstrable inhibition by BUM, another loop diuretic that is transported by a third, as yet unknown, anion transporter distinct from oatp1 and ntcp (Horz et al., 1996), opens the suggestion that the transporter(s) responsible for EA uptake may be similar to that for BUM. The sodium independence for EA uptake in isolated hepatocytes is inconsistent with reduced uptake of EA in the sodium-free recirculating liver perfusion model (Peterlik and Gazda, 1980); the difference might be due to indirect effects of sodium deprivation on liver viability. The appreciable linear uptake transport clearance (Pdiff) of 19 ml/min for a 10-g liver may be attributed to the lipophilicity of EA, inasmuch as the n -octanol/buffer partitioning ratio was 3.1 at pH 7.4, implying concentration of EA in lipid membranes.
Use of cell-free perfusion circumvented the complexity of red blood cell GSH conjugation of EA and was without effect on the movement of GSH (Ballatori et al., 1989), and the erythrocyte-free perfused liver was viable and stable (Fig. 6). In this preparation, hepatic removal of EA was concentration-dependent, and increasing the plasma concentrations of EA decreased its extraction ratio and resulted in saturation of EA-SG formation (Fig. 7). GSH conjugation of EA accounted almost completely for the total removal of EA because unchanged EA was found minimally in bile (Table 3). This observation is in disagreement with other reports that suggest extensive biliary excretion of unconjugated EA (Klaassen and Fitzgerald, 1974; Wallin et al., 1978;Peterlik and Gazda, 1980), perhaps due to the lack of stabilization of the EA conjugates. Only a small proportion (∼5%) of the formed EA-SG was further metabolized to EA-CG, EA-CYS, and EA-NAC (Table 2), confirming that the liver is fully capable of mercapturate formation (Hinchman et al., 1991). Overall, little of the EA-SG effluxed into venous plasma, and the majority of EA-SG was excreted into bile (∼89%; Fig. 6C), resulting in the well known choleretic action of EA. Of note is that each micromole of excreted EA-SG elicited ∼20 μl of bile flow, a value comparable with the apparent choleretic activity of bile acids (Roda et al., 1993).
The extraction ratio of EA was high (ESS ∼ 0.8 at the lowest concentrations examined) despite the high degree of protein binding to albumin (fu = 0.02–0.07). As noted by us and others (Proost et al., 1993), liver models that include instantaneous equilibration in plasma protein binding and assume transmembrane movement of the free drug are incapable of predicting kinetic observations on EA. The enhancement of cellular uptake by an albumin receptor mechanism was used as an explanation, but the fast dissociation on BSA binding (Weisiger, 1985; Nijssen et al., 1994), affords a better explanation for the observation. But when we employed a model similar to that described by Proost et al. (1993) to describe disequilibrium of EA binding within the sinusoids, we were unable to achieve adequate fits of the perfusion data.
To fully interpret the perfusion data, we employed a physiologic model of EA disposition that encompasses carrier-mediated uptake, bimolecular enzyme kinetics, cosubstrate homeostasis, and efflux of the formed metabolite into bile and plasma. This model was relatively successful in describing the dynamic removal of EA and the efflux of the GSH conjugate during rat liver perfusions at different drug input concentrations, and suggests that the excretion of EA-SG was an efficient process (Figs. 6C and 7B). Biliary excretion of EA-SG is a result of primary active transport by the canalicular multispecific organic anion transporter (cMOAT/MRP2; Evers et al., 1998), and the minor efflux of EA-SG into plasma is attributed to the active transport by the multidrug resistance protein (MRP1; Zaman et al., 1996) that is normally found at low levels on the hepatocyte basolateral membrane (Roelofsen et al., 1997). Efficient canalicular efflux of EA metabolites is necessary to minimize the well known product inhibition of GSTs seen for many glutathione S-conjugates, including EA-SG (Ploemen et al., 1990; Takamatsu and Inaba, 1992; Awasthi et al., 1993). The model predicted the time-course of perfusion at the higher EA concentrations (50–200 μM), during which loss of constancy in drug removal and diminished GSH conjugation were observed (Fig. 7). In these instances, rapid depletion of cellular GSH occurred (Figs. 7C and8), because the capacity for GSH replenishment was lower than its consumption rate. Thus, when hepatic GSH content fell to levels approaching the whole-organ KmGSH for GSH conjugation [∼0.2–0.3 μmol/g liver according to Snel et al. (1995), 0.5 μmol/g liver according to Polhuijs et al. (1992), or 1.2 mM in this study], the rate-limiting factor for GSH conjugation of EA changed from uptake to cosubstrate availability.
There may be reasons for departure from the model. It is probable that cellular EA-SG accumulation occurs especially at high input concentrations, and there remains the possibility that product inhibition could affect the removal of EA from liver. The model views the liver as a single compartment and fails to account for either zonal heterogeneity in EA uptake or GSH conjugation, factors that can affect local EA concentrations in the sinusoid and in whole liver (Kwon and Morris, 1997). Given that GSTs are localized predominantly in the perivenous region of sinusoid (Sippel et al., 1996) and that heterogeneity of transporters for uptake could exist, fits to the venous appearance of EA and EA-SG may be improved by including additional zonal and nonlinear elements that describe EA-SG cellular efflux. Additionally, EA-SG formation may be described by multiple enzyme rate equations because different hepatic GSTs are involved (Ploemen et al., 1993). Inclusion of these refinements is prohibitive in that it would lead to overparameterization that ultimately leads to parameter unidentifiability for the limited set of data.
Fitting of the EA-SG formation rate versus the logarithmic average EA concentration yielded a Kmoverall of 67 μM and Vmaxoverall of 0.23 μmol/min/g liver (Fig. 9B). These constants characterize the GSH conjugate formation at the wholeorgan level and do not reveal the events (uptake or conjugation) important to removal. Given the rapid spontaneous conjugation at physiologic levels of GSH and the remarkable rate enhancement by the GSTs in rat liver cytosol (in vitro Vmax = 320 μmol/min/liver assuming 60 mg cytosolic protein/g liver; Fig. 3), EA-SG formation appears extremely rapid, and the overall rate of GSH conjugation of EA is determined mainly by uptake. The fitted results on the perfusion data with the physiologic model, however, predict rate modulation by metabolism (fitted Vmaxmetab = 3.2 μmol/min/liver). At the lowest (10 μM) and highest (200 μM) EA concentrations used for perfusion, the corresponding influx clearances at the basolateral membrane are ∼100 and 40 ml/min (Eq. 3). If all EA entering the liver cell were available for metabolism, the Ess values would be expected to be ∼0.80 and 0.62 at the low and high concentrations, respectively. The experimentally determined values were 0.8 and 0.45 (see Table 3), suggesting that at low EA concentrations, uptake is rate-limiting, whereas at high EA concentrations, metabolism is emerging to play a rate-limiting role. Hence, a control analysis was performed by varying the Vmax values for uptake and metabolism (0.01–100 times their mean values) at EA concentrations of 10, 50, and 200 μM (Fig. 10). The slopes of the change in Ess at 10 and 50 μM were steeper than that for 200 μM upon alteration of the Vmax for uptake than with the Vmax for metabolism. The analysis clearly implies that uptake is rate-limiting in the overall hepatic removal of EA at low concentrations, whereas at higher concentrations, uptake and metabolism both modulate the overall elimination of EA. The conclusion is substantiated by the similarity in the constants for overall GSH conjugation and hepatocytic uptake.

Control analysis of the effect of the Vmax for uptake or the Vmax for metabolism (0.1, 0.5, 2, 10, and 100 times value shown in Table 1) on the steady-state extraction ratio of EA (Ess).
In conclusion, we have shown that rapid GSH conjugation of EA occurs enzymatically and nonenzymatically. Rapid hepatic uptake of EA occurs despite high plasma protein binding and is facilitated by a sodium-independent carrier. Comparisons between the in vitro and whole-organ data, together with analysis based on a physiologic kinetic model, suggests that hepatic removal of EA by the erythrocyte-free perfused liver is rate-limited by cellular uptake. When hepatocyte GSH becomes depleted, as with perfusion with high concentrations of EA, cosubstrate availability becomes the rate-limiting step in elimination.
Acknowledgments
We thank Galina Meier for her contributions to the work, Dr. J. H. T. M. Ploemen for kindly providing [14C]EA, and Dr. Andreas J. Schwab, Montreal General Hospital Research Institute, Montreal, PQ, Canada and Dr. Gerard J. Mulder, University of Leiden, Leiden, the Netherlands for valuable suggestions.
Appendix
The following mass balance rate equations are used in the physiological model (Fig. 2). The description of parameters is given in Table 1.
The equations describing the liver plasma space for EA and EA-SG are
Footnotes
-
Send reprint requests to: Dr. K. Sandy Pang, Faculty of Pharmacy, University of Toronto, 19 Russell St., Toronto, Ontario, Canada M5S 2S2. E-mail: pang{at}phm.utoronto.ca.
-
↵1 This work was supported by the Medical Research Council of Canada (MRC, MA9104). R.G.T. was supported by a fellowship from the Pharmaceutical Manufacturers Association of Canada—Health Research Foundation and MRC, and the University of Toronto Open Fellowship. This work was presented in part at the Annual Meeting of the American Society for Pharmacology and Experimental Therapeutics, 1997 (San Diego, CA).
-
Received for publication December 18, 1998.
- Abbreviations:
- EA
- ethacrynic acid
- EA-CYS
- EA cysteine conjugate
- EA-CG
- EA cysteinylglycinyl conjugate
- EA-NAC
- EAN-acetylcysteine conjugate
- EA-SG
- ethacrynic acid GSH conjugate
- BSP
- bromosulfophthalein
- BUM
- bumetanide
- TCA
- taurocholic acid
- GSH
- reduced glutathione
- GSSG
- oxidized glutathione
- Accepted April 23, 1999.
- The American Society for Pharmacology and Experimental Therapeutics


