


Abstract
In this work, a semimechanistic tumor growth-response model for gemcitabine in pancreatic (administered as single agent) and ovarian (given as single agent and in combination with carboplatin) cancer in mice was developed. Tumor profiles were obtained from nude mice, previously inoculated with KP4, ASPC1, MIA PACA2, PANC1 (pancreas), A2780, or SKOV3×luc (ovarian) cell lines, and then treated with different dosing schedules of gemcitabine and/or carboplatin. Data were fitted using the population approach with Nonlinear Mixed Effect Models 7.2. In addition to cell proliferation, the tumor progression model for both types of cancer incorporates a carrying capacity representing metabolite pool for DNA synthesis required to tumor growth. Analysis of data from the treated groups revealed that gemcitabine exerted its tumor effects by promoting apoptosis as well as decreasing the carrying capacity compartment. Pharmacodynamic parameters were cell-specific and overall had similar range values between cancer types. In pancreas, a linear model was used to describe both gemcitabine effects with parameter values between 3.26 × 10⁻² and 4.2 × 10⁻¹ L/(mg × d). In ovarian cancer, the apoptotic effect was driven by an EMAX model with an efficacy/potency ratio of 5.25–8.65 L/(mg × d). The contribution of carboplatin to tumor effects was lower than the response exerted by gemcitabine and was incorporated in the model as an inhibition of the carrying capacity. The model developed was consistent in its structure across different tumor cell lines and two tumor types where gemcitabine is approved. Simulation-based evaluation diagnostics showed that the model performed well in all experimental design scenarios, including dose, schedule, and tumor type.
Introduction
Nowadays, drug development constitutes a great deal in terms of the cost-efficacy relationship, especially in the oncology area where the attrition rate is very high; in fact, a recent review indicates that up to 95% of the compounds tested in early clinical phases do not reach marketing authorization (Moreno and Pearson, 2013). One approach to reduce cancer attrition rates is to look for strategies to better predict clinical trial outcome from early preclinical information (Zhang et al., 2006). In this context, preclinical (semi) mechanistic pharmacokinetics/pharmacodynamics (PKPD) analysis could be considered as a critical phase to understand the effect of a drug and its correlation to the clinic, taking into account that, despite several successful applications (Wang et al., 2009; Stein et al., 2012; Claret et al., 2013), modeling response data in oncology presents more limitations than in other therapeutic areas (Mould et al., 2015). Recently, it has been shown that models developed in the in vivo preclinical setting can drive the model structure in the clinical scenario where data are in general sparse and conditioned by high dropout rates (Ouerdani et al., 2015). In addition, other works have shown that it is possible to scale up relevant model-derived descriptors and model parameters from animal to human either for efficacy or hematotoxicity (Rocchetti et al., 2007; Friberg et al., 2010).
This work is focused on studying the pharmacodynamics of the anticancer drug gemcitabine in xenograft mice models. Gemcitabine, a cytotoxic/cytostatic antimetabolite, is a prodrug of the active form (dFdCTP), which inhibits cell growth and induces apoptosis through incorporation into replicated DNA (Hui and Reitz, 1997; Storniolo et al., 1997; Bergman and Peters, 2006). It is approved in the treatment of locally advanced or metastatic pancreatic cancer as single agent and in the treatment of nonsmall-cell lung (NSCL), breast, and ovarian cancer in combination (Hui and Reitz, 1997).
Information regarding gemcitabine dose-response relationship and the factors contributing to its magnitude of response is still limited. To the best of our knowledge, there is a lack of publicly available reports dealing with the PKPD characteristics of gemcitabine apart from the recent in vivo preclinical analysis in breast cancer xenografts (Yuan et al., 2015) and the mechanistic models developed with in vitro data (Hamed et al., 2013; Zhu et al., 2015; Miao et al., 2016). Regarding clinical PKPD models, the effect of gemcitabine administered in combination in NSCL, breast, and ovarian cancer patients has been described, linking model-predicted changes in tumor size with overall survival (Tham et al., 2008; Tate et al., 2016; Zecchin et al., 2016).
The goal of this study is to develop a semimechanistic tumor growth model to describe the effects of gemcitabine in both pancreas (administered as a single agent) and ovarian (given in combination with carboplatin) mouse xenograft models, including different tumor cell lines for both types of tumor. Our aim was to select a common model structure for all experimental conditions (cell lines, tumor type, single versus combination therapy, and dosing schedule), providing a robust reference for future translational purposes. This work appears timely given recent articles in which the concentration response of gemcitabine in combination with other anticancer drugs has been evaluated at the in vitro (Hamed et al., 2013; Zhu et al., 2015; Miao et al., 2016) and in vivo preclinical (Yuan et al., 2015) and clinical levels (Tham et al., 2008; Tate et al., 2016; Zecchin et al., 2016).
Materials and Methods
Experimental Data and Studies Design
Longitudinal tumor growth profiles were obtained from 14 xenograft studies in which gemcitabine, or the combination of gemcitabine and carboplatin, was administered i.p. to athymic or CD1 nu/nu male and female nude mice, weighing a mean of 25 g (18–34 g), previously inoculated s.c. into the flank of mice with 106 or 107 tumor cells from human derived pancreatic (KP4, ASPC1, MIA PACA2, or PANC1) or ovarian (A2780 or SKOV3×luc) tumor cell lines. No survival experiments and analysis were performed in the current evaluation.
Figure 1 provides an overall view of the experimental designs used to perform the current evaluation, showing key descriptors. Briefly, in all of the studies, mice were randomly allocated either to a control group receiving saline or to different groups receiving active treatment. The number of mice in each group for each study varied between 5 and 15 (with a median of 10 mice per group). No design optimization was performed with regard to the number of animals per group.

Data summary. In plots, points represent individual tumor growth profile. Each profile corresponds to the dosing group with the same color. Lines represent the median tumor growth profile by dosing group. Carbo, carboplatin; d, days of drug administration; Gem, gemcitabine; n, number of mice; TCB, tumor cell burden.
Gemcitabine and carboplatin were given at different doses varying from 15 to 200 mg/kg and 25 to 100 mg/kg, respectively, and under different dosing schedules (see Fig. 1). Tumor measurements [volume (mm3)] were obtained about 5 or 10 days after tumor cell inoculation and were regularly collected over the course of the study. The dimensions of the tumor were measured using a caliper, reporting measures of two longest diameters, and transformed into tumor volume following eq. 1 (Simeoni et al., 2004; Pierrillas et al., 2016): (1)All of the protocols followed during the performance of the animal studies were approved by the Eli Lilly and Company Institutional Animal Care and Use Committee.
Data Analysis
Tumor volume versus time data profiles were described based on the population approach using Nonlinear Mixed Effect Models (NONMEM) version 7.2 (Bauer, 2011) and the First Order Conditional Estimation method together with the INTERACTION option. Data were logarithmically transformed for the analysis. Interanimal variability in the model parameters was modeled exponentially as follows: Pm,i = Pm,pop × eηn,i, where Pi, and Ppop represent the individual and typical values of the m parameter in the model, respectively, and ηn,i, which represents the discrepancy between Pm,pop and Pm,i, is a random variable assumed to be symmetrically distributed around 0 with variance equal to ωm2. Residual error in the response variable was described with an additive error model on the logarithmic domain of the transformed data: Tij = f(Di,tj,ϕi) +εij. Ti,j is the log of the tumor volume observed for ith animal at the jth time after the start of the experiment; f reflects the structure of the population PKPD model; Di represents the dosing scheme given to the ith animal; the set of individual PKPD parameters is represented by ϕi; and εij represents the discrepancy between the observed and predicted T [given by f(Di,tj,ϕi)]. The set of the differences between observations and predictions constitutes a random variable symmetrically distributed around 0 with variance  .
.
Model Building
Data corresponding to each of the different tumor cell lines (either pancreas or ovarian) were analyzed separately. Within each cell line, tumor measurements obtained from different studies were pooled and analyzed together. A more appropriate procedure would have been to pool all data together for a joint modeling exercise of all cell lines and use the type of cell line as a categorical covariate. However, when we tried that approach, we faced the complexity of estimating a great number of parameters, and we did not manage to get convergence and parameter estimates in the analyses.
Model development was performed sequentially. First, the disease progression model (i.e., tumor dynamics in the absence of treatment) was characterized, and then the model for drug effects was established (see below). At each modeling step, all model parameters were re-estimated.
Pharmacokinetics
Blood and tumor samples to determine drug concentrations were not considered in the current evaluation. In addition, experimental data to characterize pharmacokinetics of gemcitabine and carboplatin were not available. Gemcitabine pharmacokinetic parameters in mice were obtained from an internal Eli Lilly pharmacokinetic model developed with human data (Zhang et al., 2006) using body weight to scale down the pharmacokinetic parameters from human to mice. The pharmacokinetic model in mice is composed of three compartments with the following parameter values: CL = 2.5 L/h/kg, Q2 = 4.9 L/h/kg, Q3 = 0.767 L/h/kg, V1 = 0.281 L/kg, V2 = 0.411 L/kg, and V3 = 5.35 L/kg, where CL and Qn are the total and intercompartment clearance, respectively, and Vn is the distribution volume in each compartment. In the case of carboplatin, a one-compartment model was used and the estimates of the pharmacokinetic parameters were obtained from literature (Wang et al., 2004a,b). During the analysis, the mean pharmacokinetic population parameters were used to simulate typical drug concentration versus time profiles in plasma corresponding to each drug and dosing schedule, which were used to describe the drug effects of tumor dynamics. It was assumed that 1) drug absorption after i.p. administration was fast and complete (and treated as an i.v. bolus injection) and independent from the dose level and time, and 2) there was no pharmacokinetic interaction between gemcitabine and carboplatin (Wang et al., 2004a,b).
In the following, the selected model is described in detail. However, during the model-building exercise, several other models and variants were also explored, as indicated in Results.
Disease Progression Model
Different disease progression models were explored and are represented in Table 1 (Simeoni et al., 2004; Claret et al., 2009; Wang et al., 2009; Frances et al., 2011). The model providing the best description of the data regardless of the type of cancer cell lines was the model published by Hahnfeldt et al. (1999), in which nutrient supply represents a key element of the model structure. The model is described mathematically by the following two ordinary differential equations: (2)
(2) (3)where T and K represent the tumor volume and the carrying capacity, the latter representing nutrient supply.
  and
and  are the first-order rate constants of tumor proliferation and carrying capacity degradation. The parameters B and D account for the stimulatory and negative feedback mechanisms of tumor volume on the dynamics of the carrying capacity.
Summary of model development based on AIC values
Drug Effect Model
Gemcitabine.
The selected model describing gemcitabine response consists of two different effects: 1) EGem1, promoting apoptosis within the tumor, and 2) EGem2, decreasing the source of nutrients.
EGem1 was found to be delayed compared with the predicted typical time course of gemcitabine in plasma (CpGem). Delayed response was characterized by a chain of three transit compartments, as described by the next set of differential equations, where TR1–3 are the predicted concentration/active signal in each of the transit compartments. KTR is the first-order rate constant of transfer between transit compartments. (4)
(4) (5)
(5) (6)EGem1 has the form of f(TR3), where f() represents linear or nonlinear expressions of TR3, and was incorporated into the tumor model as:
 (7)The second mechanism of action, represented by EGem2, could be linked directly to the predicted CpGem using a model of the form g(CpGem), where g() represents linear or nonlinear expressions of CpGem. EGem2 was incorporated into the tumor model as:
 (8)
(8)Gemcitabine and Carboplatin.
The model for combination treatment incorporates the effect of carboplatin (ECarbo), through a decrease in the nutrient supply, therefore impairing tumor progression, as indicated in eq. 9: (9)where ECarbo has the general form of h(CpCarbo), where CpCarbo is the predicted carboplatin concentration in plasma, and h() represents a linear or nonlinear expression of CpCarbo.
The initial conditions for the tumor volume (T0) and carrying capacity (K0) compartments were estimated during the modeling analysis, whereas the corresponding values of TR1–3 were set to 0. The model is represented schematically in Fig. 2 using the example of ovarian cancer, including the combination therapy.

Schematic representation of the tumor growth inhibition model for ovarian after treatment with gemcitabine and/or gemcitabine plus carboplatin. The yellow compartments correspond to the pharmacokinetics of gemcitabine, CpGem being the plasmatic concentration of gemcitabine in the central compartment, and P2 and P3 the concentration of gemcitabine in the peripheral compartments. The blue compartment, CpCarbo, corresponds to the plasmatic concentration of Carboplatin. K represents the carrying capacity or vasculature. TR1, TR2, and TR3 are the transit compartment between gemcitabine plasma concentration and effective concentration. EGem1 and EGem2 correspond to the effects exerted by gemcitabine on the tumor (EGem1) and on the vasculature (EGem2), respectively. ECarbo represents the effect driven by carboplatin on the carrying capacity. A description of the rest of the parameters can be found in Supplemental Table 1 and in Materials and Methods.
Model Selection
Selection between models was mainly based on the minimum value of the objective function provided by NONMEM, which is approximately equal to −2 log (likelihood) (−2LL). In contrast, non-nested models were compared using the Akaike Information Criteria (AIC) (Ludden et al., 1994) calculated as −2LL + 2 × NP, in which NP is the number of parameters in the model. The model with the lowest value of AIC, given the precision of model parameters and an adequate description of the data, was selected.
It was also made through a visual exploratory analysis of the goodness-of-fit plots, and the meaningfulness of the parameter estimates, as well as their precision.
Model Evaluation
Simulation-based diagnostics were used to evaluate model performance. Prediction-corrected visual predictive checks (Bergstrand et al., 2011) were performed as follows: for each tumor cell line, 500 datasets of the same characteristics of the original one were simulated using the selected model and its parameter estimates. Then, for each simulated dataset, the 2.5th, 50th, and 97.5th of the tumor volume were calculated per time interval, binning by count automatically with Perl-speaks-NONMEM with 5 or 6 bins depending on the cell line, and the 95% prediction intervals of the calculated percentiles were superimposed onto the 2.5th, 50th, and 97.5th raw data percentiles. In addition, the precision of the parameter estimates was evaluated from the analysis of 500 simulated bootstrap data sets for each tumor cell line (Efron and Tibshirani, 1993).
Model Exploration
As it is described in Results, the PKPD models selected showed a certain degree of complexity. It is therefore difficult to visualize how model elements and characteristics interact based just on the model equations and parameter estimates. Deterministic simulations were performed to provide graphical information that allows a better interpretation and understanding of the modeling results. The doses and dosing regimens chosen in the simulations were part of those used during the experiments.
These simulations were performed with the software Berkeley Madonna (version 8.3.18) (Macey and Oster, 2010).
The software Perl-speaks-NONMEM (v4.48) (Lindbom et al., 2004) and Xpose v.4.53 (Jonsson and Karlsson, 1999) were used to perform the required calculations for the bootstrap analysis, prediction-corrected visual predictive checks, and graphical representation.
Results
General Description of the Data
Figure 1 shows the raw tumor dynamic data used during the current evaluation. For each of the four pancreas tumor cell lines tested, treatment with gemcitabine slowed down tumor progression with respect to untreated groups. A more pronounced response to treatment was observed in KP4 and PANC1 cell lines compared with ASPC1 and MIA PACA2 cell lines. For the case of the ovarian xenografts, similar results could be observed when gemcitabine was administered as single agent. In combination with carboplatin, treatment effects appear to be augmented and tumor shrinkage becomes more apparent. For the SKOV3×luc ovarian tumor cell lines, data from two experiments were pooled. As can be seen in the corresponding panel in Fig. 1, the tumor growth dynamics differed quite a lot between the two experiments. Additional data characteristics relevant for the model-building process are the 1) high degree of variability between individual profiles, 2) delayed onset of tumor response with respect to time of dosing, and 3) oscillatory profiles, with pronounced decrease in tumor growth at initial time after cell inoculation. That phenomenon was especially noticeable in the PANC1 tumor cell line.
Modeling Tumor Profiles
Model for Tumor Progression Model.
From the numerous alternatives available to describe tumor volume data in the absence of treatment (Simeoni et al., 2004; Claret et al., 2009; Wang et al., 2009; Frances et al., 2011), a reduced version of the model proposed by Hahnfeldt et al. (1999) provided the lowest value of AIC (see Table 1) and the best data description for the six different tumor cell lines.
The parameter describing the first-order rate constant of the degradation of K could not be estimated with precision from any control group and was therefore removed from the model with negligible effects on −2LL. The same happened with the D parameter describing the negative feedback of the tumor volume profile on the dynamics of K for the MIA PACA2 and PANC1 tumor cell lines. Table 2 lists the estimates of the model parameters and their corresponding precision represented by the 95% confidence intervals computed from the bootstrap analysis.
Population model parameter estimates
Shrinkage percentage is indicated in parentheses. SLOPEp corresponds to gemcitabine effect constant in pancreas cancer that drives both mechanisms: under tumor volume and under carrying capacity. Emax and Ce50 are the maximum effect and the potency of gemcitabine responsible for promoting the apoptosis mechanism in ovarian cancer. SLOPEo is gemcitabine effect constant that drives the effect under the carrying capacity in ovarian cancer. SLOPEc is carboplatin effect constant under the carrying capacity in ovarian cancer. IIV represents the interanimal variability of the indicated parameter. A description of rest of the parameters can be found in Supplemental Table 1 and Materials and Methods.
Typical estimates of parameters were in general of the same order of magnitude among the different cell lines, with the exception of K0, which ranged from 3 × 10⁻⁵ (PANC1) to 1.16 × 10² (SKOV3×luc). The covariate study was tested for significant effects on all the model parameters and was found to be significant (P < 0.001) for the SKOV3×luc ovarian tumor cell line on the T0 and  parameters (see Table 1).
Data supported the estimation of interanimal variability on 1)  for all the six tumor cell lines with a magnitude ranging from 31 to 79% (MIA PACA2), and 2) T0 and K0 for just the four pancreas tumor cell lines, where the magnitude was low-moderate except for MIA PACA2 (44% T0; 85% K0). For the rest of parameters, the incorporation of interanimal variability did not reduce the value of −2LL significantly (P > 0.05).
Models for Drug Effects
Once the model for tumor progression was established, model building was focused on the following main aspects: 1) selection of the mechanism(s) of action, 2) characterization of the onset of drug action, and 3) description of the concentration effect relationship. Table 2 lists the estimates of the parameters (and their precision) obtained from the selected model (see Fig. 2), describing drug effects as single agent or as combination therapy.
Single Agent.
Data were best described considering two different effects of gemcitabine: promoting tumor shrinkage through an apoptosis mechanism and decreasing the carrying capacity. By including both types of drug effects, the AIC value was significantly reduced (Table 1). The two mechanisms of action differed on the time of onset; whereas the effect of the carrying capacity was linked directly with the change in drug exposure, apoptotic response appeared to be delayed with respect to dosing. The mean transit time calculated as (n + 1)/KTR, where n is the number of transit compartments, varied from 0.8 (KP4) to 7 (SKOV3×luc) days. The exposure effect relationship was best characterized with a linear model for the case of all pancreas tumor cell lines, which showed a sensitivity represented by the θSLOPE parameter within the same range and between 3.26 × 10⁻² and 4.2 × 10⁻¹ L/(mg × d). As it was mentioned before, the same value of the slope parameter was estimated to describe both types of effects.
The EMAX model was selected to describe the apoptotic effects in the case for the two ovarian tumor cell lines; despite the same model structure, parameter estimates showed high difference between the two cell lines with regard to both efficacy (EMAX) and potency (C50). However, the ratio between EMAX and C50 was similar between the A2780 and SKOV3×luc cell lines (8.65 versus 5.25 L/(mg × d), respectively), and higher than any of the slope parameters estimated from the pancreas xenografts. This last result is clearly seen in the raw data represented in Fig. 1, in which higher tumor effects are shown for ovarian xenografts. The effect on the carrying capacity was described with a linear model and appears to be lower than the apoptotic effect and of the same range as in the case of pancreas tumors.
Interanimal variability in drug effect parameters could only be quantified for the case of pancreas xenografts on the parameters KTR and SLOPE, showing low to moderate magnitude, with the exception of KTR from MIA PACA2 (90%).
Combination.
Different alternatives were explored to characterize the contribution of carboplatin to tumor shrinkage in ovarian xenografts. Carboplatin showed significant model improvement (P < 0.001) when it was incorporated into the apoptotic (only for A2780 cell line) or the inhibitory carrying capacity effects; however, it was not possible to keep both carboplatin effects in the model; and the effect on the carrying capacity was preferred based on the visual exploration of the goodness-of-fit plots (data not shown) and on the reduction of the AIC (Table 1). The effect of carboplatin was greater for the A2780 than for SKOV3×luc, and in general of the same magnitude that gemcitabine showed on the same mechanism of action. Interanimal variability could not be estimated for the effects of carboplatin.
Individual model-predicted profiles are displayed in Fig. 3, showing that, for several mice chosen at random from the different control groups, the tumor progression and tumor response model performed very well at the individual level for every dosing group.

Evaluation of model performance at the individual level. Tumor size observation (points) and individual model predictions (lines) for different mice receiving different dose schedules by cell line. C, carboplatin; G, gemcitabine; ID, mouse identification per cell line.
Figure 4 shows the results from the prediction-corrected visual predictive checks in which the full model selected describes the general tendency and the dispersion of the data quite well for the six tumor cell lines studied, both for the unperturbed tumor growth profile as well as the effects of gemcitabine administered as single agent and in combination with carboplatin.

Prediction-corrected visual predictive check (Pc-vpc) per cell line. (A) Pc-vpc for pancreas cell lines for control groups (upper panels) and for the groups receiving gemcitabine (lower panels). (B) Pc-vpc for ovarian cell lines for control group (upper panels) and for the groups treated with gemcitabine (lower panels). (C) Pc-vpc for ovarian cell lines receiving gemcitabine in combination with carboplatin. In the plots, solid lines represent the 50th percentile of the observed data, whereas dashed lines correspond to the 2.5th and 97.5th percentile of the observed data. Shaded areas are the 95% confidence intervals based on simulated data (n = 500) for the corresponding percentiles.
Model Exploration
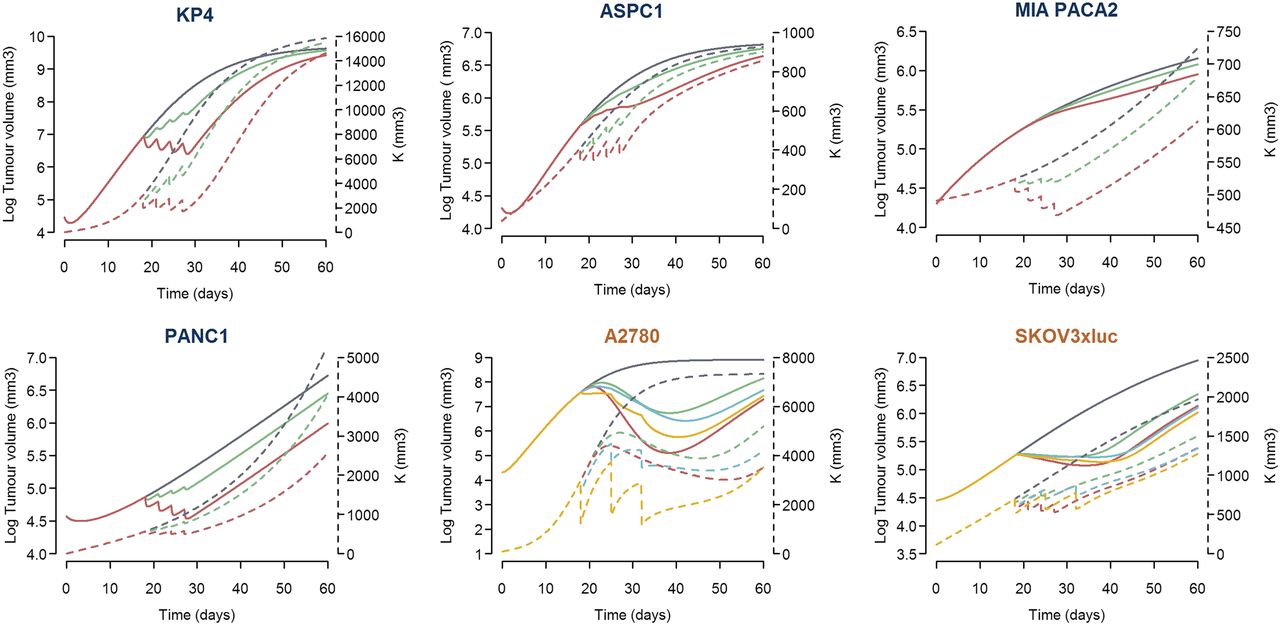
The results from the current modeling exercise indicate the following: 1) tumor growth depends on a self-proliferation mechanism and a carrying capacity, 2) gemcitabine exerts its drug action through two mechanisms of action, 3) there is a contribution of carboplatin to the tumor shrinkage elicited by gemcitabine, 4) drug effects appear to be exposure-dependent, and 5) different cell lines show different degree of sensitivity to gemcitabine and carboplatin effects. Deterministic simulations were performed to provide a better interpretation and understanding of the modeling results. The profiles that resulted from this simulation exercise are displayed in Figs. 5 and 6. Pancreatic cell lines show similar drug effects on tumor size and carrying capacity, except for MIA PACA2 cell line, for which higher drug effect on carrying capacity was seen. For the case of the ovarian cell lines, the apoptosis-related mechanism of action is greater than the action exerted on carrying capacity.

Typical simulated profiles of tumor volume and carrying capacity under different scenarios per cell line. Log tumor volume versus time is represented by the continuous line (left axis), whereas the carrying capacity profiles correspond to the discontinuous line (right axis). For all of the cell lines, simulations of unperturbed growth of tumor volume and carrying capacity (dark gray lines) and after receiving 30 mg/kg (green profiles) or 80 mg/kg (red profiles) on days 18, 21, 24, and 27 after randomization are represented. For ovarian cell lines, tumor volume and carrying capacity profiles are also simulated under the effect of the combination therapy of gemcitabine 50 mg/kg plus carboplatin 10 mg/kg (blue lines) or 50 mg/kg (yellow lines) given on days 18, 25, and 32.

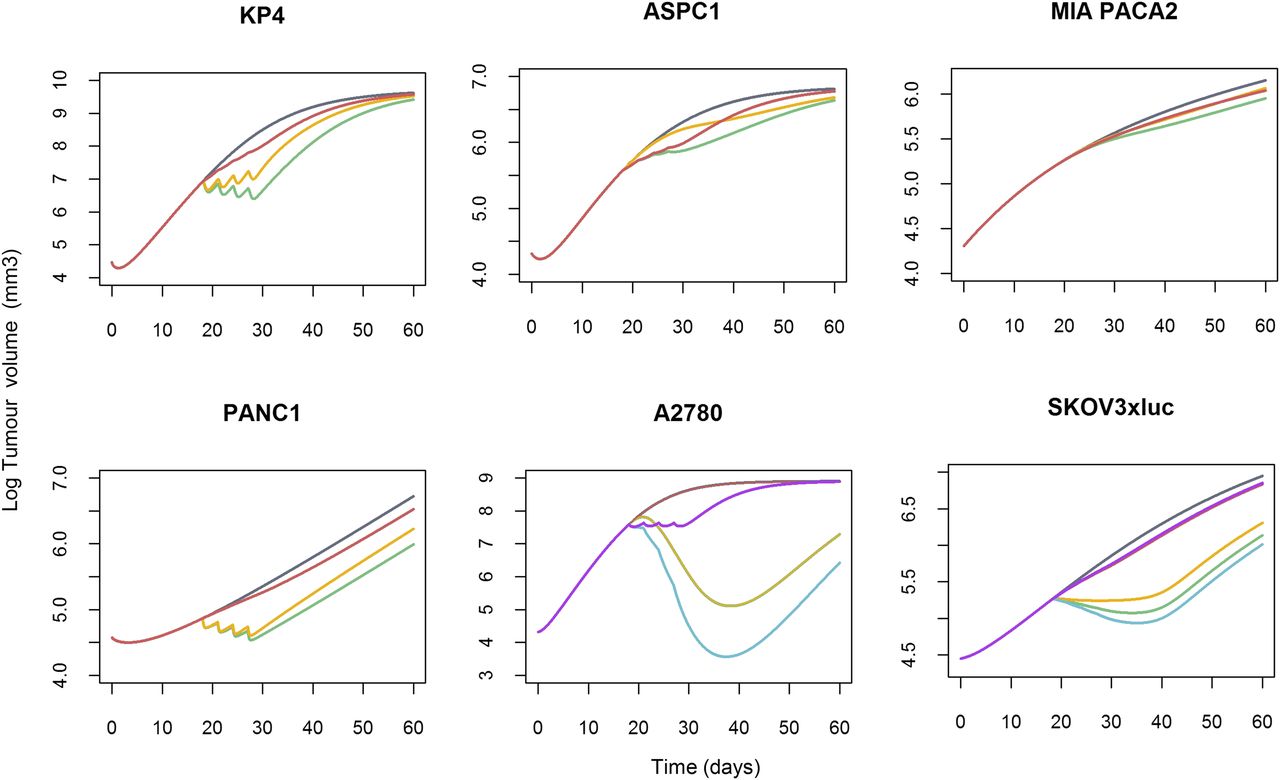
Contribution of the different gemcitabine mechanisms of actions on tumor growth inhibition by cell line. Tumor growth profile was simulated after i.p. administration of 80 mg/kg gemcitabine on days 18, 21, 24, and 27 for the six tumor cell lines plus i.p. carboplatin 50 mg/kg administration, given at the same schedule, in ovarian xenografts. As an example, in KP4 xenograft, the gray line represents the typical unperturbed tumor growth. The green profile represents tumor profile after gemcitabine treatment. The yellow line is the same gemcitabine effect only driven by the apoptotic mechanism, and the red profile only accounts for the effect under the carrying capacity. In ovarian xenografts, for gemcitabine alone is the same as in pancreas, the blue line being the tumor profile after treatment with the combination therapy. Tumor profile only driven by carboplatin effect under the carrying capacity is represented in purple.
The typical simulated profiles of the control groups that appear in each of the panels in Figs. 5 and 6 represent the profiles corresponding to the reduced version of the Hahnfeldt model with λ2 fix to 0 (all cell lines) and D fix to 0 in the case of MIA PACA2 and PANC1 cell lines.
Discussion
In this analysis, a semimechanistic population PKPD model for the tumor shrinkage effects of gemcitabine given as a single agent or in combination on human xenografts was developed showing consistency in its structure across different tumor cell lines representing two tumor types in which gemcitabine treatment is approved. Simulation-based evaluation diagnostics showed that the model performed well in all of the different design scenarios, including dose, schedule, and tumor type.
Several mechanisms have been reported to describe tumor response to treatment with gemcitabine. Its main effect is apoptotic caused by the integration in the DNA of the malignant cell, eliciting masked chain termination and antiproliferative activity as a consequence of DNA synthesis inhibition (Mini et al., 2006). In the same work, Mini et al. (2006) described several pharmacodynamic activities of the prodrug decreasing the competing natural metabolite pools necessary for DNA synthesis by mechanisms of self-potentiation. Those self-potentiation mechanisms in which gemcitabine inhibits different enzymes, resulting in the decrease of cellular deoxynucleotides (metabolite pools), have also been reported in several publications (Plunkett et al., 1996; Gesto et al., 2012; de Sousa Cavalcante and Monteiro, 2014). That composite mechanism of action has been captured in the model selected in the current analysis through the EGem1 and EGem2 effects represented in eq. 7 and 8, and associated with apoptosis by masked chain termination and self-potentiation, respectively. The two mechanisms could be identified and integrated into the model because, interestingly, the dynamics shown by all control groups regardless of the type of cell lines quantified two different but interconnected processes implicated in tumor growth: the tumor proliferation, and the nutrient supply or metabolite pools required for tumor growth represented by the carrying capacity compartment.
The relationship between the carrying capacity and tumor mass allows description of the initial decrease or slow tumor growth detected in most of the individual profiles (Fig. 5), which might be explained by an initial lack of metabolite pool required for DNA synthesis. For cell lines with a K0 estimate lower than T0, the initial behavior of tumor growth will be regressive (KP4, ASPC1, and PANC1 cell lines; see Fig. 5). Once the carrying capacity reaches tumor volume, the vasculature will be optimal to provide nutrients to allow the tumor to grow.
Estimates of the parameters governing tumor progression are within the range of those published in literature (Ouerdani et al., 2015). In this work, Ouerdani et al. (2015) reported values for  of 0.166 days−1 (with interindividual variability of 53%), K0 of 543 mm3 (interindividual variability = 36%), and B parameter of 0.0183 days−1.
From the parameter estimates listed in Table 1 and the profiles shown in Figs. 5 and 6, it can also be appreciated that ASPC1 and MIA PACA2 cell lines are less sensitive to gemcitabine treatment, in accordance with recent previous results (Prasad et al., 2016). Those differences in drug efficacy are explained by cell-type–specific genetic and phenotypic characteristics (Deer et al., 2010; Mitra et al., 2012). For example, as Deer et al. (2010) indicated in their work, ASPC1, MIA PACA2, and PANC1 cell lines present different mutations in KRAS, TP53, CDKN2A, and SMAD4 genes, mutations that might contribute to the different growth characteristics, tumorigenicity, and chemosensitivity.
Figure 6 explores the contribution of the two mechanisms of action to the tumor drug effects. In all cases, as expected, the apoptotic effect showed greater contribution, although, for the case of ASPC1 and MIA PACA2, the differences were marginal.
The current model was developed using gemcitabine pharmacokinetics after a scale-down exercise from the pharmacokinetic model developed in humans (Zhang et al., 2006). In their clinical study performed in nonsmall-cell lung cancer patients, Tham et al. (2008) also linked gemcitabine drug effects with its concentration levels in plasma, as well as in the rest of the gemcitabine models that are mentioned below (Hamed et al., 2013; Yuan et al., 2015; Zhu et al., 2015; Miao et al., 2016). However, the active metabolite, dFdCTP, is the main agent responsible for tumor effects after gemcitabine administration, presenting also different cellular pharmacokinetics among cell types. To capture the process of the active metabolite development, a signal transduction model, represented by transit compartments between the plasmatic and the effective concentration, was included in this work, characterizing different KTR between cell lines. Therefore, this effective concentration (TR3) responsible for driving the cytotoxic effect in the model would represent the active metabolite. The PKPD characteristics of gemcitabine have been studied to some extent in vitro and in in vivo preclinical experiments. In vitro models developed on pancreatic cells estimated two types of effects for gemcitabine, as follows: inhibiting cell cycle progression and inducing apoptosis (Hamed et al., 2013; Zhu et al., 2015; Miao et al., 2016). Those analyses were performed at concentrations of gemcitabine ranging from 0 to 100 mg/L, whereas, in the present work, the simulated concentrations of gemcitabine range from 50 to 700 mg/L. In those in vitro experiments, drug combinations were also considered; the interactions of gemcitabine with trabectecin and birinapant were described as synergistic. The model presented in this work is able to reproduce in vivo the two different effects for gemcitabine described in vitro, albeit with a different model structure. Yuan et al. (2015) developed a semimechanistic PKPD model for gemcitabine in combination with dexametasone in breast cancer in mice. They could identify a single mechanism of action for the case of gemcitabine and reported pharmacodynamic parameters that were in accordance with those found in our study for the A2780 ovarian xenograft (Kmax = 3.23 days−1, KC50 = 0.176 µg/mL).
With respect to clinical studies, Wendling et al. (2016) have recently characterized the change in tumor size in patients with pancreatic cancer treated with gemcitabine, linking tumor size with overall survival. However, the model establishing the relationship between exposure to gemcitabine and tumor effects was not developed, making therefore the comparison with our results difficult. Tham et al. (2008) have investigated the pharmacodynamics of gemcitabine given in combination with carboplatin in NSCL cancer patients and were not able to discriminate between the effect of both drugs, resulting in the use of a gemcitabine dose-driven model to describe tumor shrinkage. In addition, Tate et al. (2016) have successfully characterized the tumor growth-inhibitory effects of gemcitabine in combination with paclitaxel in metastatic breast cancer. Finally, Zecchin et al. (2016) have also studied the change in tumor size in patients with metastatic ovarian cancer treated with carboplatin or carboplatin plus gemcitabine. In their work, both drugs had additive effects (driven by drug exposure) promoting apoptosis, making the tumor more sensitive to gemcitabine effects. Those results are also supported by the current model, as in Fig. 6, showing that contribution of carboplatin to tumor effects is lower than the response exerted by gemcitabine. However, it has to be taken into account that mouse data receiving carboplatin alone were not available.
We do believe this study provides a robust preclinical PKPD model that could be used in future analysis in terms of translational approaches. Pharmacodynamic parameters tend to be independent between species (Mager et al., 2009), and in that line, Wong et al. (2012) demonstrated the predictive value of xenograft/allograft PKPD models, relating simulated percentage of tumor growth inhibition in mice and overall response from clinical trials.
We have already performed the first translational attempts following the same methodology as Wong et al. (2012), relating simulated tumor growth inhibition with patients’ overall survival (Garcia-Cremades et al., 2016). Although further analyses are currently ongoing, those primary results are encouraging and outline the benefit of properly characterized preclinical data under the population PKPD framework.
In summary, a comprehensive semimechanistic model to account for pancreas and ovarian tumor progression in mice as well as the pharmacodynamic effects of gemcitabine alone and in combination has been developed under different in vivo experimental conditions. This work contributes timely to the recent, but still scarce, quantitative information available on gemcitabine, with a robust and consistent model across cell lines and tumor types, and is expected to be useful for the translational approach and in predicting tumor responses in humans from xenograft models, as shown by others (Wong et al., 2012).
Acknowledgments
We thank Sonya Tate for providing assistance during the writing process and Sophie Callies for sharing the pharmacokinetic model for gemcitabine.
Authorship Contributions
Performed data analysis: Garcia-Cremades, Pitou, Iversen, Troconiz.
Wrote or contributed to the writing of the manuscript: Garcia-Cremades, Pitou, Iversen, Troconiz.
Footnotes
- Received September 19, 2016.
- Accepted December 22, 2016.
This work is part of the Innovative Medicine Initiative–funded project Drug Disease Model Resources [DDMORE (http://www.ddmore.eu/)] aiming to develop an interoperability framework including model repository to optimize model development. This work was supported by Eli Lilly and Company and by the DDMORE project.
I.F.T. is an employee of the University of Navarra, and M.G.-C. is a PhD student from University of Navarra. C.P. and P.W.I. are employees of Elli Lilly and Company.
↵
 This article has supplemental material available at jpet.aspetjournals.org.

Abbreviations
- −2LL
- 2× log (likelihood)
- AIC
- Akaike Information Criteria
- NONMEM
- nonlinear mixed effect models
- PKPD
- pharmacokinetics/pharmacodynamics
- Copyright © 2017 by The American Society for Pharmacology and Experimental Therapeutics


