


Abstract
The Raf/mitogen-activated protein kinase kinase (MEK)/extracellular signal-regulated kinase signaling pathway is involved in cellular responses relevant to tumorigenesis, including cell proliferation, invasion, survival, and angiogenesis. 2-{4-[(1E)-1-(Hydroxyimino)-2,3-dihydro-1H-inden-5-yl]-3-(pyridine-4-yl)-1H-pyrazol-1-yl}ethan-1-ol (GDC-0879) is a novel, potent, and selective B-Raf inhibitor. The objective of this study was to characterize the relationship between GDC-0879 plasma concentrations and tumor growth inhibition in A375 melanoma and Colo205 colon cancer xenografts and to understand the pharmacodynamic (PD) marker response requirements [phosphorylated (p)MEK1 inhibition] associated with tumor growth inhibition in A375 xenografts. Estimates of GDC-0879 plasma concentrations required for tumor stasis obtained from fitting tumor data to indirect response models were comparable, at 4.48 and 3.27 μM for A375 and Colo205 xenografts, respectively. This was consistent with comparable in vitro potency of GDC-0879 in both cell lines. The relationship between GDC-0879 plasma concentrations and pMEK1 inhibition in the tumor was characterized in A375 xenografts after oral doses of 35, 50, and 100 mg/kg. Fitting pMEK1 inhibition to an indirect response model provided an IC50 estimate of 3.06 μM. pMEK1 inhibition was further linked to A375 tumor volume data from nine different GDC-0879 dosing regimens using an integrated pharmacokinetic-PD model. A simulated PD marker response curve plot of K (rate constant describing tumor growth inhibition) versus pMEK1 inhibition generated using pharmacodynamic parameters estimated from this model, showed a steep pMEK1 inhibition-response curve consistent with an estimated Hill coefficient of ≅8. A threshold of >40% pMEK1 inhibition is required for tumor growth inhibition, and a minimum of ∼60% pMEK1 inhibition is required for stasis in A375 xenografts treated with GDC-0879.
The Raf/MEK/ERK signaling pathway is involved in cellular responses relevant to tumorigenesis, including cell proliferation, invasion, survival, and angiogenesis (Sebolt-Leopold and Herrera, 2004; Gollob et al., 2006; Schreck and Rapp, 2006; Zebisch and Troppmair, 2006; Madhunapantula and Robertson, 2008). Currently, three Raf kinase isoforms have been identified and are referred to as A-Raf, B-Raf, and C-Raf (also known as Raf-1) (Madhunapantula and Robertson, 2008). Frequent activating mutations in B-Raf have been observed in several tumor types, including malignant melanoma (Davies et al., 2002) and colorectal carcinoma (Yuen et al., 2002). The majority of these mutations are in exon 15, which results in a V600E amino acid substitution, leading to constitutive kinase activation (Mercer and Pritchard, 2003). The association of the Raf/MEK/ERK pathway with human cancers has made it an attractive pathway to target using small molecule inhibitors. Sorafenib (Nexavar, BAY-43-9006) has been reported to inhibit the Raf/MEK/ERK signaling pathway. However, sorafenib is a multikinase inhibitor and its clinical antitumor activity is probably a result of its activity against proangiogenic receptor tyrosine kinases, such as vascular endothelial growth factor receptor and platelet-derived growth factor receptor (Li et al., 2007). Other reported Raf inhibitors include PLX4032, ZM336372, AZ628, AAL881, LBT613, SB-590885, and RAF-265 (Khazak et al., 2007; Li et al., 2007). To date, little or no detailed analysis of the pharmacokinetic-pharmacodynamic (PK-PD) relationships between systemic exposure of a Raf inhibitor and its effects on downstream markers of pathway modulation have been published. Reported investigations of PK-PD relationships of Raf inhibitors have been largely limited to simple demonstrations of dose-dependent inhibition of Raf/MEK/ERK pathway in xenograft models (Wilhelm et al., 2004).
Preclinical PK-PD modeling can play an important role in the drug discovery and development process by providing an integrated understanding of relationships between compound plasma concentrations, PD marker response, and efficacy. Throughout the characterization of a compound, these data may exist as separate entities and understanding relationships between 1) concentration and efficacy, 2) concentration and PD marker response, and 3) PD marker response and efficacy are often difficult because of biological delays between each measured response. PK-PD modeling provides estimates of pharmacodynamic parameters that describe the specific relationships of interest.
GDC-0879 (Fig. 1) is a novel potent, selective B-Raf inhibitor in various in vitro and cell-based assays with an IC50 estimate of 0.13 nM against purified B-Raf V600E enzyme and a cellular pERK IC50 of 63 nM in the MALME-3M cell line (Hansen et al., 2008). When screened against a panel of 140 kinases at 1 μM, GDC-0879 showed expected activity only against C-Raf (K. P. Hoeflich, unpublished data). The objective of the current study was to characterize the in vitro and in vivo potency, and the pharmacodynamic properties of GDC-0879 in Colo205 and A375 tumor cell lines, both of which carry the V600E mutation. The relationship among systemic exposure of GDC-0879, phosphorylated MEK1 (pMEK1) inhibition, and tumor growth inhibition was also explored in more detail in the A375 model.
Materials and Methods
GDC-0879 was provided by Array BioPharma (Boulder, CO). Solvents used for analysis were of analytical or high-performance liquid chromatography grade (Thermo Fisher Scientific, Waltham, MA). All other reagents or material used in this study were purchased from Sigma-Aldrich (St. Louis, MO) unless otherwise stated. The Genentech Institutional Animal Care and Use Committee approved all procedures in animals.

Chemical structure of GDC-0879.
Pharmacokinetic Studies in Mice
Female athymic nu/nu mice (weighing 25–28 g) (Charles River Laboratories, Hollister, CA) were administered oral doses of 15, 25, 50, 100, and 200 mg/kg GDC-0879 in 0.5% methylcellulose/0.2% Tween 80 (MCT). Blood samples (∼1 ml) were collected at 0.5, 1, 2, 4, 8, and 24 h after dose via cardiac puncture (terminal collection) into tubes containing K2EDTA anticoagulant. Immediately upon collection, the blood was mixed with K2EDTA and stored on ice. Within 30 min, blood samples were centrifuged at approximately 1000 to 1500g for 5 min at 4°C, and plasma was harvested. The plasma samples were stored at -80°C until analysis. Concentrations of GDC-0879 were determined by liquid chromatography-tandem mass spectrometry. The dynamic range of the assay was 0.005 to 10 μM.
In Vitro Studies in A375and Colo205 Cell Lines
GDC-0879 in vitro IC50 estimates for pMEK inhibition were determined using A375 and Colo205 cells. In brief, A375 or Colo205 cells were incubated with a range of GDC-0879 concentrations (from 0.5 nM to 6.75 μM) for 25 min. Cells were lysed, and the lysates were subjected to centrifugation at 16,100g for 30 min, and the level of total protein was determined using the Bradford method (Bradford, 1976). Enzyme-linked immunosorbent assay kits were used to determine pMEK1 and total MEK1 protein levels in a 96-well format (Tago Biosource International, Camarillo, CA). Samples were analyzed in duplicate at 20 μg of protein per well according to the protocol of the supplier. The optical densities obtained at 450 nm were converted to units per milliliter (for pMEK1) or nanograms per milliliter (for total MEK1) using a standard curve determined with recombinant pMEK1 or MEK1. The pMEK1/total MEK1 ratios were then calculated as units per nanogram. The IC50 estimates for pMEK1 inhibition were estimated by nonlinear regression using GraphPad Prism version 4.02 (GraphPad Software Inc., San Diego, CA).
Xenograft (A375 and Colo205) Efficacy Studies
Ten million human melanoma A375 cells or 5 million human colorectal carcinoma Colo205 cells were resuspended in phosphate-buffered saline, mixed 1:1 (v/v) with Matrigel (BD Biosciences, San Jose, CA), and implanted subcutaneously into the right flank of naive female athymic nu/nu mice. Tumors were monitored until they reached a mean volume of 200 to 300 mm3.
Tumor sizes and body weights were recorded twice weekly, and the mice were regularly observed over the course of the study. Mice were promptly euthanized if their tumor volume exceeded 2000 mm3 or if their body weight dropped by more than 20% of the starting weight. Ten mice were randomly assigned to each group based on mean tumor volume. Mean tumor volume across all six groups was 200 mm3 at the start of dosing. Tumor volumes were measured in two dimensions (length and width) using Ultra Cal-IV calipers (model 54-10-111; Fred V. Fowler Company, Inc., Newton, MA). The following formula was used with Excel version 11.2 (Microsoft, Redmond, WA) to calculate tumor volume (TV): TV (cubic millimeters) = (length × width2) × 0.5.
All test materials were administered by oral gavage for 19 to 22 days. Animals in vehicle groups received 100 μl of MCT. Treatment groups (n = 10 mice/group) received oral doses of GDC-0879 in 100 μl of MCT. The treatment groups for A375 xenograft efficacy experiments included in this study were as follows: experiment 1: vehicle, 15, 25, and 50 mg/kg once daily; experiment 2: vehicle, 50, 100, and 200 mg/kg once daily and 50 mg/kg b.i.d.; experiment 3: vehicle and 100 mg/kg once daily, 100 mg/kg every other day, 100 mg/kg every third day, and 100 mg/kg every week.
Treatment groups for Colo205 xenograft efficacy experiments included in this study were as follows: experiment 4: vehicle, 25, 35, and 50 mg/kg once daily and 35 mg/kg b.i.d.; and experiment 5, vehicle, 50 and 100 mg/kg once daily and 50 mg/kg b.i.d.
Mean tumor volume and S.E.M. were calculated using JMP software, version 5.1.2 (SAS Institute, Cary, NC). Statistical comparison of tumor volume of treatment groups to vehicle groups was performed using the Dunnett's t test (Dunnett, 1955) with JMP software (SAS Institute, Cary, NC). End of study tumor volumes of each treatment group was compared specifically with end of study tumor volumes for the corresponding vehicle group.
pMEK1 Inhibition Studies in A375 Xenografts
Female athymic nu/nu mice were implanted with tumor cells as described above for the A375 xenograft efficacy experiments. Mean tumor volume across all groups was 215 mm3. Mice were randomly assigned to four treatment groups (vehicle, 35, 50, and 100 mg/kg) based on mean tumor volume. Animals received a single oral dose of vehicle (MCT; n = 4) or 35 (n = 20), 50 (n = 20), or 100 mg/kg (n = 20) of GDC-0879 in 100 μl of MCT. Terminal blood and tumor samples (blood via cardiac puncture under general anesthesia or retro-orbital collection, and tumors) were collected from the 35, 50, and 100 mg/kg treatments groups at 1, 2, 4, 8, and 12 h after dose (n = 4/time point). Samples were collected only at the 8-h time point for the vehicle group (n = 4). Plasma was collected, stored, and GDC-0879 concentrations were assessed as described above for the pharmacokinetic study. Excised tumor tissues were flash-frozen and stored at -80°C until analysis.
The frozen tumors were pulverized on dry ice using a small Bessman tissue pulverizer (Spectrum Laboratories, Inc., Rancho Dominguez, CA). Cell-free protein extracts were prepared at 4°C for analysis of the pMEK1 and total MEK1 status. The lysis buffer (10 ml) contained 1× cell lysis buffer (Cell Signaling Technology Inc., Danvers, MA), 1 mM phenylmethylsulfonyl fluoride (Sigma-Aldrich, St. Louis, MO), and one tablet of Complete Mini protease inhibitor cocktail (Roche Diagnostics, Indianapolis, IN). Tissue lysates were subjected to centrifugation at 16,100g for 30 min, and the level of total protein was determined using the Bradford method (Bradford, 1976). ELISA kits were used to determine pMEK1 and total MEK1 protein levels in 96-well format (Tago Biosource International). Samples were analyzed in duplicate at 75 μg of protein per well according to the protocol of the supplier. The optical densities obtained at 450 nm were converted to units per milliliter (for pMEK1) or nanograms per milliliter (for total MEK1) using a standard curve determined with recombinant pMEK1 or MEK1. The pMEK1/total MEK1 ratios were then calculated as units per nanogram.
PK-PD Modeling
PK-PD modeling was performed using SAAM II (Saam Institute, University of Washington, Seattle, WA).
Pharmacokinetic Studies. Plasma concentration-time data from female nu/nu mice were fitted to a one compartment model with oral absorption. The pharmacokinetics of GDC-0879 seemed linear over the dose range tested. Mean estimates of the absorption rate constant (ka), the elimination rate constant (ke), and the apparent volume of distribution from all dose groups were used to simulate GDC-0879 concentrations in the modeling of the xenograft efficacy studies.
Xenograft (A375 and Colo205) Efficacy Studies. Xenograft efficacy studies were fitted to an indirect response model (Mager et al., 2003) as described by the following differential equation.  where
where  TV (cubic millimeters) is defined as the tumor volume, t (hours) is time, kng (hours-1) is the net growth rate constant, K (hours-1)isthe rate constant describing the tumor reductive effects of GDC-0879, Kmax (hours-1) is the maximal value of K, C (micromolar) is the concentration of GDC-0879, n is the Hill coefficient, and KC50 (micromolar) is the GDC-0879 concentration where K is 50% Kmax. Concentrations of GDC-0879 in mice were simulated based upon the pharmacokinetic parameters obtained from the pharmacokinetics studies. Mean tumor volumes for each dose group were used for fitting. All dose groups from the same tumor type were fit simultaneously. Pharmacodynamic parameters are presented as the estimate followed by the coefficient of variation (CV) in parentheses.
The dose required for 50% inhibition of tumor growth (ED50) for A375 and Colo205 xenograft studies was calculated by fixing pharmacodynamic parameter estimates and simulating doses required for 50% inhibition of the vehicle group's tumor growth at the mean end of study day. Mean end of study day was used because experiments used for PK-PD modeling had differing durations. Concentration required for tumor stasis (Cstasis) was calculated as the concentration where the K is equal to kng.
pMEK1 Inhibition Studies in A375 Xenografts. The PK-PD relationship of GDC-0879 plasma concentrations to pMEK1 inhibition was characterized using an indirect response model (Mager et al., 2003) in which GDC-0879 concentrations inhibit the formation of pMEK1 as described by the following equation:  pMEK1 (units per nanogram) is defined as the pMEK1/total MEK1 ratio (see “pMEK1 Inhibition Studies in A375 Xenografts” under Materials and Methods), t (hours) is the time, kin (units per nanogram per hour) is the formation rate of pMEK1, IC50 (micromolar) is the GDC-0879 concentration where there is 50% inhibition of pMEK1, and kout (hours-1) is the rate constant describing the loss of pMEK1. At homeostasis, kin = kout (pMEK1); therefore, kout was replaced by kin/(pMEK1)initial where (pMEK1)initial is the control/predose value of pMEK1. In addition to an indirect response model described above, the pMEK1 data were fit to an effect compartment model (Mager et al., 2003; data not shown). The resulting IC50 estimate was virtually identical to the values estimated from indirect response model. However, fitting statistics, such as the Akaike information criterion and the Schwarz-Bayesian information criterion, had a smaller value for the indirect response model, suggesting a better model fit. Pharmacodynamic parameters are presented as the estimate followed by the CV in parentheses.
Integrated PK-PD Efficacy Model in A375 Xenografts. To understand the relationship between GDC-0879 plasma concentrations, pMEK1 inhibition, and tumor growth inhibition, the PK-PD model used to characterize the relationship between GDC-0879 concentrations and pMEK1 inhibition described above was combined with the model used to fit the xenograft efficacy studies. In brief, the PK-PD model describing pMEK inhibition was used to simulate pMEK1 inhibition for all A375 xenograft dose groups. The following equation was used in the fitting process to relate pMEK1 inhibition to tumor volume:  where
where  %I is defined as the percentage of inhibition of pMEK1 and was calculated as follows:
  K(%I)50 is defined as the %I where K is 50% Kmax. Concentrations of GDC-0879 in mice were simulated based upon the pharmacokinetic parameters obtained from the pharmacokinetic studies. Mean tumor volumes for each dose group were used for fitting. All dose groups from A375 xenograft experiments were fit simultaneously. Pharmacodynamic parameters are presented as the estimate followed by the CV in parentheses. pMEK1 inhibition required for tumor stasis was calculated using the estimated pharmacodynamic parameters as the %pMEK1 inhibition where the K is equal to kng.
Results
GDC-0879 had comparable in vitro potency in A375 melanoma and Colo205 colorectal carcinoma cell lines, both of which are V600E B-Raf mutant, with IC50 estimates of pMEK1 inhibition of 59 and 29 nM, respectively.
The pharmacokinetic parameters of GDC-0879 after oral administration of 15, 25, 50, 100, and 200 mg/kg in MCT in mice were estimated as follows: ka = 8.20 h-1, ke = 0.59 h-1, and apparent volume of distribution = 6.19 l/kg. These estimated parameters were used to simulate GDC-0879 plasma concentrations when fitting tumor volume data from xenograft efficacy studies because it was not possible to collect blood from xenograft mice that were on study.
Tumor growth inhibition curves after a range of oral doses and schedules of GDC-0879 in A375 xenograft tumor-bearing mice are shown in Fig. 2, A to C. All of the doses tested resulted in a statistically significant tumor growth inhibition (p < 0.05) compared with their respective vehicle control groups, with the exception of the 15 and 25 mg/kg once daily treatment groups from experiment 1 (Fig. 2A) and the 100 mg/kg group every third day and 100 mg/kg once a week treatment groups from experiment 3 (Fig. 2C). Overall, GDC-0879 showed dose-dependent inhibition of tumor growth in A375 xenografts. The effect of GDC-0879 on tumor growth after daily oral dosing did not seem to increase appreciably compared with the 100 mg/kg once daily dose to the 200 mg/kg once daily dose, suggesting saturation of effect (Fig. 2B). Figure 2D compares observed and predicted tumor volumes after simultaneous fitting of all A375 tumor data to a simple indirect response model (eq. 1). In general, a simple indirect response model was able to adequately characterize the PK-PD relationship between GDC-0879 plasma concentrations and tumor volume growth inhibition. Estimated in vivo GDC-0879 pharmacodynamic parameters characterizing A375 tumor growth and inhibition are presented in Table 1.
Summary of pharmacodynamic parameters estimated from A375 and Colo205 xenograft studies
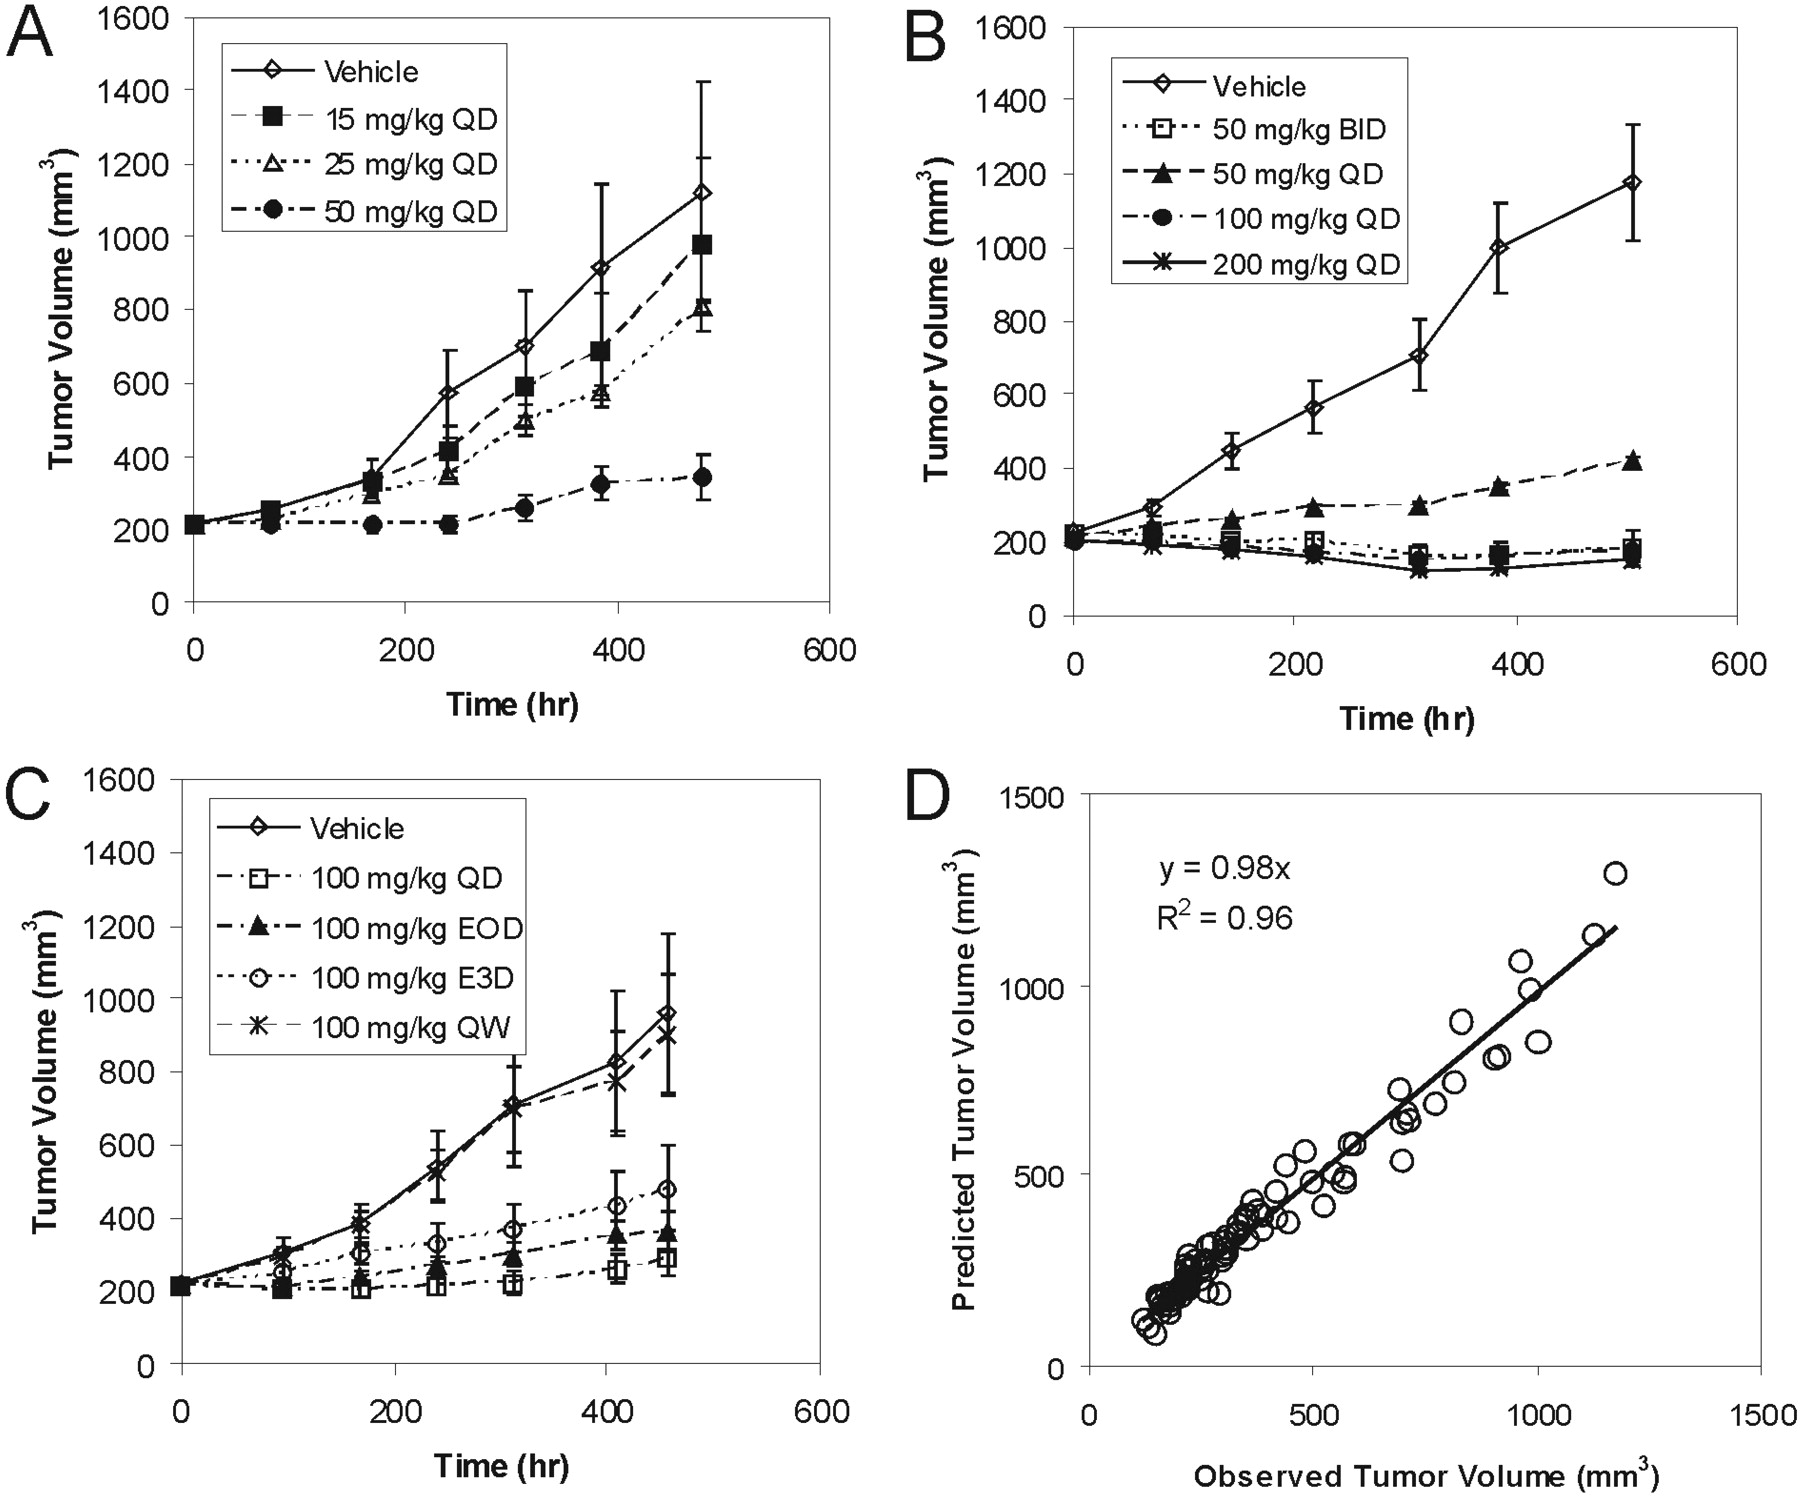
A375 melanoma xenograft experiments 1 (A), 2 (B), and 3 (C). Tumor volumes are presented as mean ± S.E. Observed versus predicted A375 xenograft mean tumor volumes after fitting to an indirect response model (D).
Tumor growth inhibition curves following a range of oral doses of GDC-0879 in Colo205 xenograft mice are shown in Fig. 3, A and B. All of the doses tested resulted in a statistically significant tumor growth inhibition (p < 0.05) compared with their respective vehicle control groups. Similar to observations with A375 xenografts, GDC-879 showed dose-dependent inhibition of tumor growth in Colo205 xenografts after oral administration over a broad dose range. As seen in Fig. 3C, a simple indirect response model (eq. 1) was able to adequately characterize the PK-PD relationship between GDC-0879 plasma concentrations and tumor growth inhibition. Estimated in vivo GDC-0879 pharmacodynamic parameters characterizing Colo205 tumor growth and inhibition are presented in Table 1. Overall, the in vivo potency of GDC-0879 seemed to be similar in A375 and Colo205 xenografts with comparable EC50, ED50, and Cstasis values.
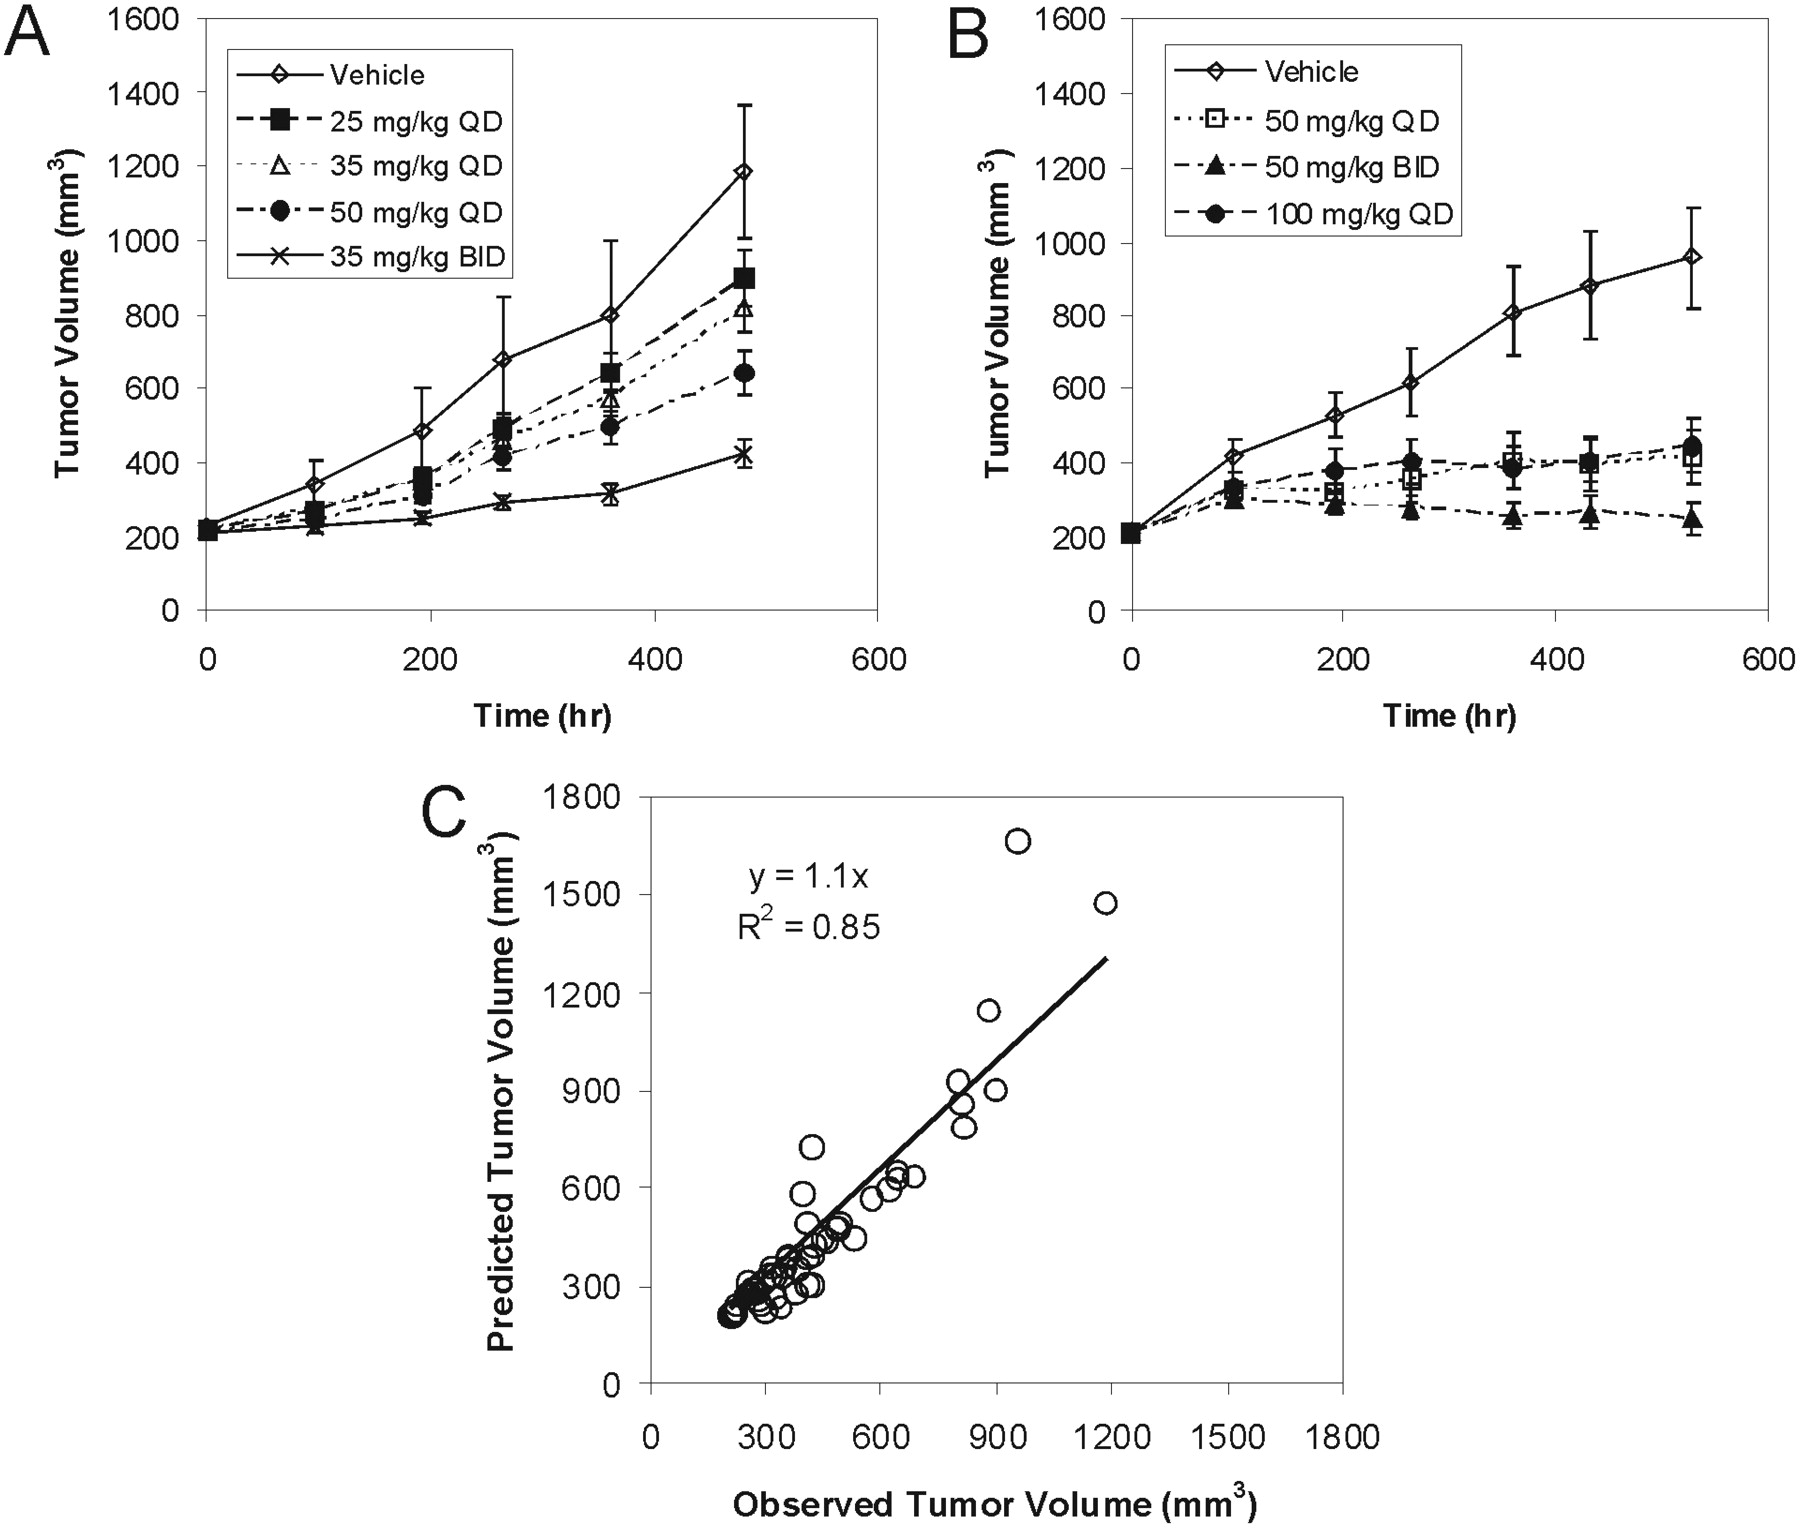
Colo205 colorectal carcinoma xenograft experiments 4 (A) and 5 (B). Tumor volumes are presented as mean ± S.E. Observed versus predicted Colo205 mean tumor volumes after fitting to an indirect response model (C).
GDC-0879 plasma concentrations and corresponding pMEK1/MEK1 ratios for single oral doses of 35, 50, and 100 mg/kg were determined and are presented in Fig. 4, A and B, respectively. Administration of GDC-0879 at all of the tested doses resulted in effective inhibition of the Raf signaling pathway, as measured by pMEK1 levels. The inhibition was profound at 1 and 2 h after dose, especially at the 50 and 100 mg/kg dose levels. Moderate pMEK1 inhibition was observed at 4 to 8 h after dose and the pMEK1 signal was recovered within 12 h. The relationship of GDC-0879 plasma concentrations to tumor pMEK1 inhibition in A375 xenografts was characterized using an indirect response model (eq. 2) in which GDC-0879 inhibits the production rate of pMEK1 in a saturable manner. As seen in Fig. 4C, the model adequately characterizes the relationship between GDC-0879 concentration and pMEK1 inhibition. Estimated pharmacodynamic parameters are shown in Fig. 4C.
The relationship between inhibition of the Raf signaling pathway and efficacy was explored in more detail in A375 xenografts by using an integrated PK-PD efficacy model (Fig. 5A). In brief, the indirect response model relating GDC-0879 plasma concentrations to pMEK1 levels described above was used to simulate pMEK1 inhibition for all doses used in A375 xenograft efficacy experiments (experiments 1–3). Tumor volumes from all A375 xenograft experiments were fit simultaneously to an indirect response model relating pMEK1 inhibition to tumor growth inhibition (eq. 3). Figure 5B is a plot of the observed versus predicted tumor volumes of the resulting fit along with estimated pharmacodynamic parameters. Using these parameters, a plot of the relationship between Raf pathway knockdown (i.e., pMEK1 inhibition) and efficacy (i.e., K, rate constant describing the tumor growth inhibition effects of GDC-0879) was generated and is shown in Fig. 5C. Based upon this plot and the associated pharmacodynamic parameters used in its generation, >40% pMEK1 inhibition seems to be required to obtain tumor growth inhibition in A375 xenografts, and approximately 60% pMEK1 inhibition, at a minimum, is needed for stasis.

GDC-0879 plasma concentrations in A375 xenografts after oral doses of 35, 50 and 100 mg/kg (A) and corresponding pMEK1/MEK1 ratios (B). Observed versus predicted pMEK1/MEK1 ratio following fitting to an indirect response model (C).
Discussion
The Raf/MEK/ERK pathway is a highly conserved signaling pathway that plays a central role in cell proliferation and survival in eukaryotes (McCubrey et al., 2007). Raf kinases are a key component of this pathway and are activated via a complex process involving phosphorylation after recruitment to plasma membranes and binding to Ras, an oncogene that is mutated in 30% of all cancers (Friday and Adjei, 2008). Activated Raf proteins directly phosphorylate multiple serine residues of MEK1 and MEK2, resulting in their activation. Both MEK1 and -2 act on ERK protein kinases, which have multiple and diverse targets that are involved in the regulation of several cellular processes such as cell proliferation, survival, mitosis, and migration (Friday and Adjei, 2008). Three Raf kinase isoforms have been identified and are referred to as A-Raf, B-Raf, and C-Raf (also known as Raf-1) (Madhunapantula and Robertson, 2008). In comparison with other Raf isoforms, mutations in B-Raf are by far the most common, being found in approximately 50 to 70% of melanomas, 30% of papillary thyroid cancer, and 10 to 15% of colorectal and ovarian cancers, making this one of the most frequently mutated genes in human cancers (Davies et al., 2002; Li et al., 2007). The majority of B-Raf mutations are in exon 15, which results in a V600E amino acid substitution, leading to constitutive kinase activation (Mercer and Pritchard, 2003). As such, B-Raf represents an extremely attractive target for the development of anticancer therapies.
GDC-0879 represents a novel potent and selective B-Raf inhibitor that is being evaluated as a potential antitumor agent. The current study shows that GDC-0879 exhibits potent inhibition of Raf/MEK/ERK signaling pathway in V600E B-Raf mutant cell lines with low cellular pMEK1 inhibition IC50 estimates of 59 and 29 nM in A375 melanoma and Colo205 colorectal carcinoma cells, respectively. The comparable in vitro potency of GDC-0879 in these two cell lines translates to similar in vivo potency in the corresponding xenograft models (Table 1). GDC-0879 showed no evidence of activating apoptotic pathways in vitro in either cell line (data not shown); thus, the observed effects seem to be largely attributed to its impact on cell proliferation.
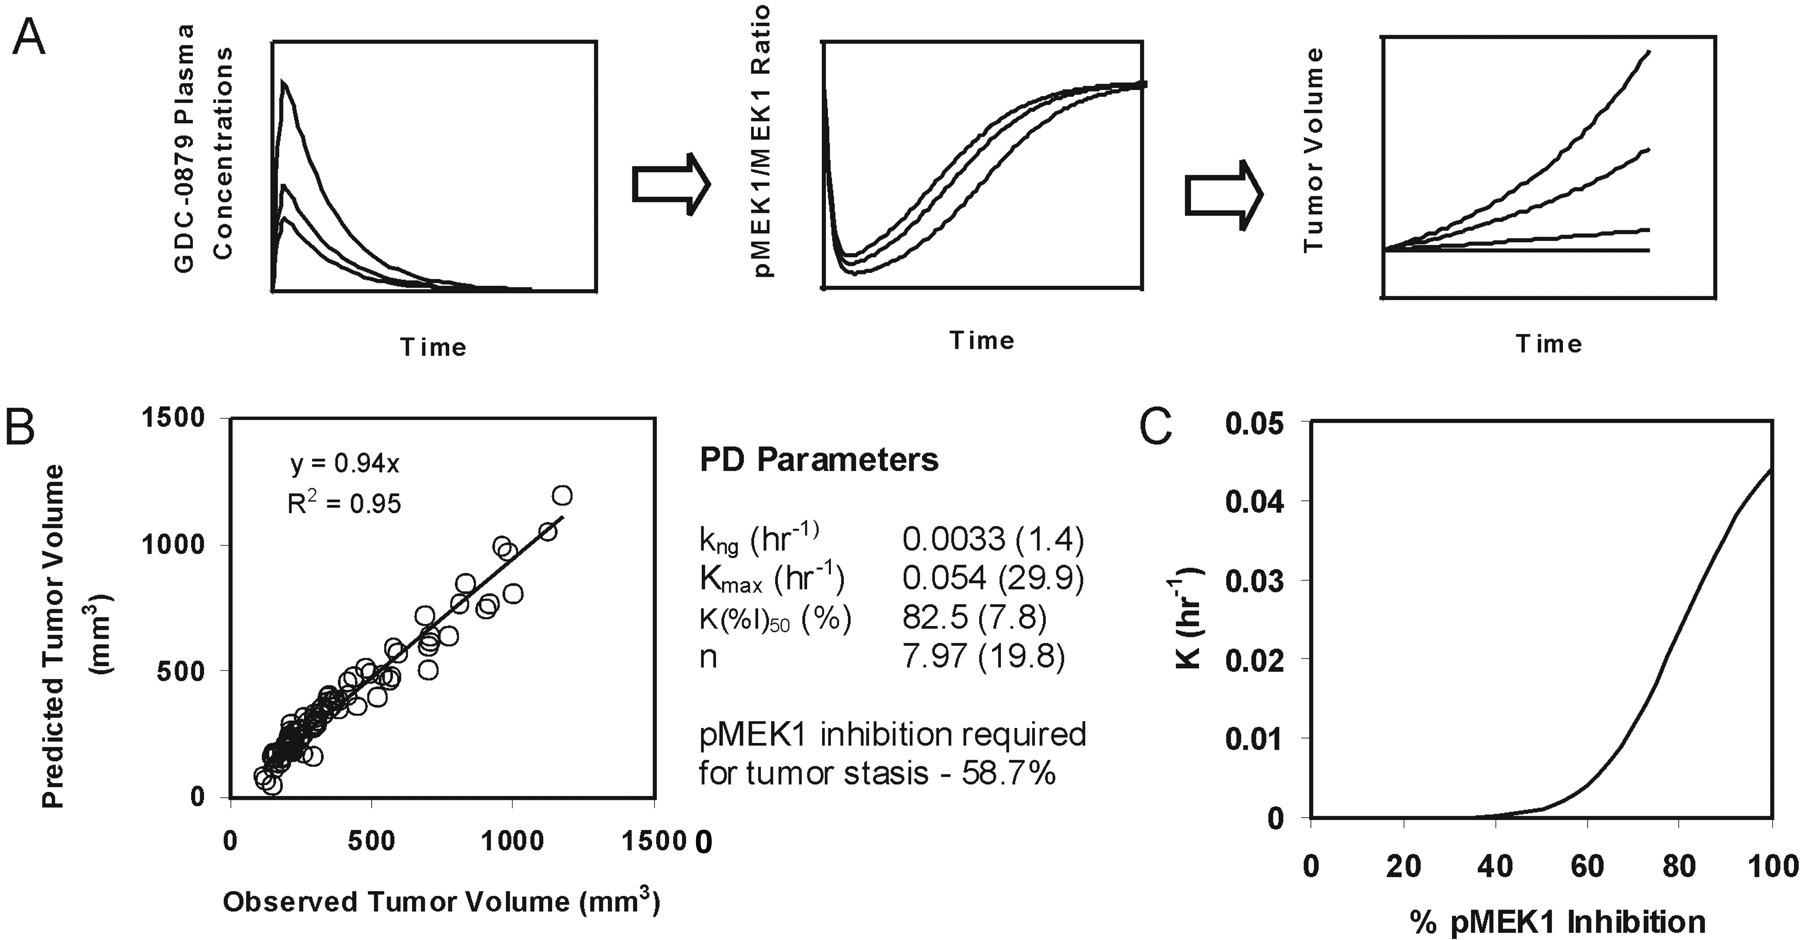
Integrated PK-PD efficacy model linking GDC-0879 plasma concentration, pMEK1 inhibition, and tumor growth inhibition in A375 xenografts (A). Observed versus predicted mean tumor volumes after fitting to integrated PK-PD model and estimated pharmacodynamic parameters (B). Relationship of %pMEK1 inhibition to tumor growth inhibition constant [K] (C).
Indirect response models are useful in the characterization of PD effects where the monitored PD response is a downstream event that results from a specific interaction of an agent with a receptor or enzyme (Mager et al., 2003). This scenario is analogous with the mode of action of GDC-0879, which inhibits B-Raf kinase activity leading to the inhibition of downstream MEK phosphorylation. The ability of GDC-0879 to inhibit the phosphorylation of MEK1 in a concentration-dependent manner was well characterized using an indirect response model (Fig. 4). The estimated in vivo IC50 value of 3.06 μM in plasma is approximately 50-fold higher than in vitro IC50 estimates obtained from studies using A375 melanoma cells (i.e., 59 nM). Observed differences in the in vivo versus in vitro IC50 of pMEK1 inhibition is probably because of a combined effect of plasma protein binding and tumor disposition characteristics of GDC-0879. GDC-0879 is approximately 78% protein bound in mouse plasma, and the volume of distribution was reported to be low, suggesting that the compound does not readily partition to peripheral tissues (E. F. Choo, F. Feng, B. Liederer, E. Plise, N. Randolph, and Y. Ran, unpublished data).
The PK-PD modeling performed in the current study suggests that plasma GDC-0879 concentrations of 3 to 4 μM are necessary for tumor stasis in both Colo205 and A375 xenografts (Table 1). More importantly, we were able to quantify the relationship between pathway modulation (pMEK1 inhibition) and tumor growth inhibition through the use of an integrated PK-PD model (Fig. 5). A “PD marker-response curve” showing the relationship between pMEK1 inhibition and K (a measure of tumor growth inhibition effect of GDC-0879) was sigmoidal in nature, requiring a Hill coefficient of ∼8 to describe it, suggesting a steep PD marker-response curve. GDC-0879 required a threshold of >40% pMEK1 inhibition beyond which a rapid increase in K was observed. This observed “switch-like” behavior is consistent with reports of ultrasensitive stimulus-response curves observed for mitogen-activated protein kinase cascades (Huang and Ferrell, 1996). Overall, these data suggest that a significant degree of pathway modulation (>40% pMEK1 inhibition) is required to trigger tumor growth inhibition in A375 xenografts. Our observations are consistent with anecdotal data from the use of MEK inhibitors in the clinic where it has been suggested that ∼60% pERK knockdown may be required for tumor growth inhibition (Tan et al., 2007; European Organization for Research and Treatment of Cancer Conference).
Similar approaches have been used to describe the inhibitory effects of anticancer agents on tumor growth. In most cases, concentration-tumor growth inhibition, and concentration-PD marker response relationships have been modeled with separate PK-PD models. For example, with the cMet kinase inhibitor PF02341066, an effect compartment model (also referred to as a link model) was used to describe the PK-PD relationship between plasma concentration and cMet phosphorylation (Yamazaki et al., 2008). A separate indirect response model was used to relate PF02341066 plasma concentrations with tumor growth inhibition. Based upon similar estimates of EC50 (213 ng/ml) from tumor modeling and EC90 (167 ng/ml) from cMet phosphorylation modeling, it was concluded that >90% inhibition of PD marker response was required to significantly inhibit tumor growth by >50% (Yamazaki et al., 2008). With everolimus, an mammalian target of rapamycin inhibitor, an effect compartment model (direct-link model) was used to describe the relationship between plasma concentration and inhibition of S6 kinase 1 activity (S6K1), a marker of mammalian target of rapamycin signaling in pancreatic tumor-bearing rats. After scaling of rat pharmacokinetics to human, this PK-PD model was used to accurately describe S6K1 inhibition-time profiles in patients and was later used to predict the PD marker response with different dosing regimens (Tanaka et al., 2008). The relationship between S6K1 inhibition and antitumor activity for everolimus was not quantitatively defined, and the PK-PD model was used largely to compare the effects of different dosing regimens on S6K1 inhibition.
For GDC-0879, an improved understanding of PD marker requirements associated with antitumor activity was enabled by the PD marker response curve simulated from pharmacodynamic parameters estimated using the described integrated PK-PD model (Fig. 5C). A PD marker-response curve is particularly valuable in cases where the monitored PD response is upstream of the antitumor effect. In these situations, potential biological time delays between PD marker-response and antitumor effect can complicate understanding of the relationship between these two events. Similar approaches utilizing integrated PK-PD models have been applied to elegantly describe the action of corticosteroids on multiple PD markers, and in turn their effect on disease progression (e.g., paw swelling/edema and bone mineral density) in a rat model of rheumatoid arthritis (Earp et al., 2008a,b). In addition, an integrated PK-PD model has been used to examine the action of antihyperglycemic agents on disease progression of type II diabetes mellitus (de Winter et al., 2006). However, to our knowledge, use of an integrated PK-PD model and generation of a PD marker-response curve correlating PD marker response to antitumor activity as described here has not been reported previously.
There are several assumptions and caveats associated with preclinical PK-PD modeling of anticancer therapeutics. Mouse xenograft models serve as the most common preclinical in vivo efficacy model in the evaluation of anti-cancer therapies (Kelland, 2004; Teicher, 2006). A primary assumption of preclinical PK-PD modeling using xenografts is that concentrations required for PD marker response and antitumor activity translate directly from mouse xenograft models to humans. This extrapolation requires that the distribution of drug is similar, this is despite reported differences in tumor vasculature and transport in xenograft versus human tumors (Jang et al., 2003). Noted differences in growth rate of human and xenograft tumors also complicate the interpretation of xenograft data. Keeping the mentioned assumptions and caveats in mind, the present PK-PD study of a novel Raf inhibitor may help facilitate the design of future clinical trials and establish pharmacokinetic and pharmacodynamic endpoints through an improved understanding of drug concentrations required for tumor stasis and of pathway suppression required for antitumor efficacy.
Acknowledgments
We thank Jonas Grina, Joshua D. Hansen, and the Chemistry Department of Array BioPharma for the synthesis and supply of GDC-0879 and colleagues in the Translational Oncology, Drug Metabolism and Pharmacokinetics, and the In Vivo Studies Group for contributions in generating data for this study.
Footnotes
-
The work in this article was presented at the 15th North American Regional ISSX Meeting; 2008 October; San Diego, CA; and the IXth World Conference on Clinical Pharmacology and Therapeutics; 2008 July; Quebec, Canada.
-
Article, publication date, and citation information can be found at http://jpet.aspetjournals.org.
-
doi:10.1124/jpet.108.148189.
-
ABBREVIATIONS: MEK, mitogen-activated protein kinase kinase; ERK, extracellular signal-regulated kinase; PK, pharmacokinetic; PD, pharmacodynamic; GDC-0879, 2-{4-[(1E)-1-(hydroxyimino)-2,3-dihydro-1H-inden-5-yl]-3-(pyridine-4-yl)-1H-pyrazol-1-yl}ethan-1-ol; MCT, 0.5% methylcellulose/0.2% Tween 80; p, phosphorylated; TV, tumor volume; CV, coefficient of variation; %I, percentage of inhibition of pMEK1; S6K1, S6 kinase 1.
- Received October 31, 2008.
- Accepted January 14, 2009.
- The American Society for Pharmacology and Experimental Therapeutics


