


Abstract
CYP2B6 is a polymorphic human drug metabolizing cytochrome P450 with clinical relevance for several drug substrates including cyclophosphamide, bupropion, and efavirenz. The common allele CYP2B6*6 [c. 516G>T, Q172H, and c.785A>G, K262R] has previously been associated with lower expression in human liver and with increased plasma levels of efavirenz in human immunodeficiency virus patients, but the molecular mechanism has remained unclear. We present novel data showing that hepatic CYP2B6 mRNA levels are reduced in *6 carriers, suggesting a pretranslational mechanism resulting in decreased expression. As one possibility, we first analyzed the common promoter variant, –750T>C, but the results did not suggest a prominent role in phenotype determination. In contrast, analysis of liver mRNA splicing variants demonstrated that the most common form lacking exons 4 to 6 (SV1) was tightly associated with the *6 allele and apparently also with the rare variant c.777C>A(CYP2B6*3). Further investigation using minigene constructs transfected into eukaryotic cell lines COS-1 and Huh7 demonstrated that the single nucleotide polymorphism c.516G>T in allele CYP2B6*6 was alone responsible for aberrant splicing resulting in high-splice variant (SV) 1 and low-CYP2B6 expression phenotype. Minigenes carrying the single c.785A>G polymorphism or the rare c.777C>A variant resulted in normal and intermediate expression phenotypes, respectively. In conclusion, the mechanism of the common *6 allele involves predominantly aberrant splicing, thus leading to reduced functional mRNA, protein, and activity. These results establish the single nucleotide polymorphism 516G>Tasthe causal sequence variation for severely decreased expression and function associated with CYP2B6*6.
Polymorphisms in metabolizing enzymes and transporters can be valuable biomarkers for variable pharmacokinetics, pharmacodynamics, adverse drug reactions, and clinical efficacy of numerous drugs. The human cytochrome CYP2B6 is a highly polymorphic enzyme, which plays a major role in the biotransformation of an increasing number of endogenous and exogenous substrates (Turpeinen et al., 2006; Hodgson and Rose, 2007; Zanger et al., 2007). CYP2B6 is of particular significance for the cytostatic and immunosuppressant, cyclophosphamide (Chang et al., 1993; Roy et al., 1999), the antidepressant and smoking cessation drug, bupropion (Kirchheiner et al., 2003), and the non-nucleosidic reverse transcription inhibitors, efavirenz (EFV) (Ward et al., 2003) and nevirapine (Erickson et al., 1999). In contrast to the well investigated paradigm polymorphisms of CYP2D6 and 2C19, polymorphisms in CYP2B6 have been discovered relatively recently (Ariyoshi et al., 2001; Lang et al., 2001, 2004; Jinno et al., 2003; Hesse et al., 2004; Klein et al., 2005; Zukunft et al., 2005). To date, 28 defined alleles have been described and numerous nonsynonymous, promoter and intron changes contribute to highly complex haplotype structures (CYPallele nomenclature home page, http://www.cypalleles.ki.se/cyp2b6.htm). The discovery that CYP2B6 is the major catalyst for oxidative EFV metabolism (Ward et al., 2003; Desta et al., 2007) led to subsequent pharmacogenetic studies in human immunodeficiency virus patients, revealing strong associations between severely elevated EFV plasma concentration and homozygosity for the common CYP2B6*6 [Q172H and K262R] and several minor loss of function alleles in various ethnic populations (Haas, 2006; Owen et al., 2006; Telenti and Zanger, 2007). Moreover, recently, CYP2B6 genotyping in Japanese human immunodeficiency virus-infected individuals was successfully applied to reduce the therapeutic dose of EFV, which resulted not only in the expected pharmacokinetic changes but also in improvement of central nervous system-related side effects (Gatanaga et al., 2007). It is noteworthy that the *6 allele occurs with high frequency across different populations, ranging from 14% in Koreans to over 40% in West Africans and Chinese and 62% in Papua New Guineans (Zanger et al., 2007).
Despite its established clinical genotype-phenotype relationship, the molecular basis of the *6 allele has remained unclear, and various studies indicated possible effects at the level of transcription, splicing, protein stability, as well as substrate specificity and turnover. Thus, in our initial study, three *6/*6 homozygotes included had significantly decreased S-mephenytoin N-demethylase activity (Lang et al., 2001). This change was accompanied by a similar change in protein expression that was, however, not significant, presumably due to the limited number of samples available and because additional polymorphisms affecting the genotype-phenotype relationships were not yet known. Partially contradictory findings were reported by others, including confounding effects of ethnicity, sex, and substrate (Jinno et al., 2003; Lamba et al., 2003; Xie et al., 2003; Hesse et al., 2004; Rotger et al., 2007). In a recent extended study, we clearly showed that heterozygous and homozygous carriers of *6 allele indeed express up to 4-fold less protein with concomitant changes in activity as compared with homozygotes of the reference allele CYP2B6*1 (Desta et al., 2007). However, the reason for lower expression in liver remained elusive. One possibility is a lower transcription rate due to linked promoter variants. The most common haplotype among Caucasian populations is *6B, which includes the upstream region SNPs–1456T>C and –750T>C, but their functional effects are not well defined (Lamba et al., 2003; Hesse et al., 2004; Zukunft et al., 2005). It is also possible that one or more of the SNPs in CYP2B6*6, eventually including unknown intronic variants, lead to aberrant splicing of pre-mRNA, thus resulting in less functional transcript and protein in human liver as proposed (Lamba et al., 2003). Based on in silico considerations, the c.516G>T in exon 4 was suggested to disrupt an exonic splicing enhancer, and a SNP 15582C>Tin intron 3 was correlated with a common splice variant (SV1) observed in human liver samples, although a definitive functional impact of splicing on function was not apparent (Lamba et al., 2003).
In this study, we carried out a systematic analysis of hepatic CYP2B6, and we reinvestigated both promoter and splicing variants in a large human liver bank. To prove the involvement of individual SNPs in phenotype determination, we constructed several CYP2B6 minigenes and transfected them into mammalian cell lines to study their effects at the levels of splicing, protein and activity. Our results establish the nonsynonymous c.516G>T [Q172H] polymorphism as the single most important variant for the overall phenotype of the CYP2B6*6 allele. These data emphasize the contribution of alternative splicing to pharmacogenetics and enhance our understanding of CYP2B6 phenotype determination.
Materials and Methods
Patient DNA and Liver Samples. Blood and liver tissue was previously collected from patients undergoing liver surgery at the Department of General, Visceral, and Transplantation Surgery (Prof. Dr. P. Neuhaus and Prof. Dr. A. K. Nuessler, Campus Virchow, University Medical Center Charité, Humboldt University in Berlin, Germany). The preparation of genomic DNA, liver microsomes, and protein has been described before (Lang et al., 2001, 2004). Resected tissue samples were histochemically examined, and only histologically normal liver tissue was used. A total of 235 liver samples were available for protein and activity analysis, whereas high-quality RNA was available from a subset of 150 samples (see below). Clinical patient documentation for all samples included age, gender, medical diagnosis, presurgical medication, alcohol use, and smoking. None of these samples were from patients with hepatitis, cirrhosis, or chronic alcohol use. The study was approved by the local ethics committee of the Charité, Humboldt University Berlin, following the ethical guidelines of the declaration of Helsinki, and written informed consent was obtained from all patients.
CYP2B6Genotyping. The CYP2B6 genotyping for the most important SNPs or respective alleles was performed as described previously (Lang et al., 2001, 2004; Klein et al., 2005; Blievernicht et al., 2007). In brief, 50 ng of whole genomic DNA prepared from whole blood using a QIAamp DNA blood kit (QIAGEN GmbH, Hilden, Germany) was used as a template for amplification of the respective CYP2B6 target sequence employing specific oligonucleotides that discriminate between CYP2B6 and the CYP2B7 pseudogene. The CYP2B6 gene sequence and the CYP2B7 pseudogene sequence (both in NG_000008.5) were used for specific CYP2B6 primer design with the Vector NTI Advance 10 package (Invitrogen, Karlsruhe, Germany). After the PCR reaction, residual dNTPs were dephosphorylated using shrimp alkaline phosphatase (GE Healthcare, Little Chalfont, Buckinghamshire, UK), and the purified PCR products were used as templates for primer extension reactions with extension primers and Termipol DNA Polymerase I (Solis Biodyne, Tartu, Estonia), dNTPs (GE Healthcare), and ddNTPs (BioLog Life Science Institute, Bremen, Germany). The final base extension products were treated with a cationic exchange resin to remove salts. Reaction solutions (0.5 μl) were dispensed onto the 384-well format Anchor Chip target plate (Bruker Daltonik, Leipzig, Germany) prespotted with 1 μl of matrix solution of 3-hydroxypicolinic acid. Mass spectrometric analyses were performed on an Ultraflex Mass Spectrometer, and data were analyzed using the Genotools software (both obtained from Bruker Daltonik).
Preparation of RNA and Reverse Transcription. Total RNA preparation from liver tissue or cells was prepared using either the RNeasy MidiKit (QIAGEN) or TRIzol reagent with subsequent RNA clean-up using the RNeasy mini kit (QIAGEN) with on-column DNase I treatment according to the supplier's instructions. RNA quality was controlled by the Agilent Bioanalyzer using the RNA600 Nano Lab Chip Kit (Agilent Technologies, Waldbronn, Germany). Only RNA samples with an RNA integrity number higher than seven (n = 150) were used for further analyses. Each sample was reverse transcribed using 1 μg of RNA, random hexamers, and the TaqMan Reverse Transcription Kit (Applied Biosystems, Foster City, CA). Reverse transcription of RNA for subsequent TaqMan analysis was carried out at 25°C for 10 min, at 48°C for 30 min, and at 95°C for 5 min. For alternative splicing analysis, the second step was elongated to 90 min to achieve full-length cDNA transcription.
Quantitative Real-Time Reverse Transcription-PCR. Quantification of CYP2B6 mRNA was performed by specific quantitative TaqMan real-time reverse transcription (RT)-PCR assays on an ABI Prism 7500 system (Applied Biosystems), as described previously (Zukunft et al., 2005). Primers (TQ-CYP2B6for/rev) and probe CYB2B6MGB were located in exons 4 and 5 (for primer sequences, see Supplemental Table 1). For normalization, a predeveloped β-actin TaqMan assay was used (Applied Biosystems). The full-length CYP2B6-cDNA was used as positive control, and the splicing variant plasmids lacking exons 4 to 6 (SV1) or only exon 4 (SV8) were used as negative controls.
Analysis of Protein Expression. CYP2B6 apoprotein was quantified in human liver microsomes by Western blotting as described before (Lang et al., 2001). In brief, recombinant CYP2B6 lymphoblast microsomes (BD Biosciences, San Jose, CA) were coanalyzed as standard on each gel (10% polyacrylamide gels; range of 2 to 0.125 pmol). CYP2B6 protein was immunodetected with a specific monoclonal mouse anti-human CYP2B6 antibody (BD Biosciences).
In the case of recombinant CYP2B6 protein expression analysis, β-actin, a monoclonal antibody (Sigma-Aldrich, Deisenhofen, Germany), was used as internal control. The relative S.D. for β-actin was generally less than 10%. In all cases, bound antibody was quantified by secondary IR Dye 800 goat anti-mouse antibody using the infrared imaging system 4300 DNA Analyser Odyssey (LI-COR Biosciences GmbH, Bad Homburg, Germany) and LI-COR Biosciences GmbH analysis software version 1.2.
Cloning and Sequencing of Alternative Splicing Products. Two CYP2B6 cDNA fragments spanning exons 2/3 to 9 were generated by RT-PCR. Primers used for the first fragment (764 bp) from exons 2/3 to 7 were cDNA2B6FE2 and cDNA2B6RE7. The second fragment from exons 5 to 9 (931 bp) was amplified with the primers cDNACYP2B6FE5 and cDNACYP2B6RE9 (Supplemental Table 1). PCR products were analyzed using a 1.5% agarose gel stained with ethidium bromide. Fragments were cut out and extracted using a Gel Extraction kit (QIAGEN). Fragments were cloned into a pCR4TOPO vector (Invitrogen) and transformed in TOP10 chemically competent cells using the described protocol from Invitrogen. Highly pure plasmid was obtained by means of Mini/MidiPrep (QIAGEN), amplified, and sequenced with M13 (forward and reverse) universal primers and previously described CYP2B6-specific sequencing primers (Lang et al., 2004). Sequencing was performed using the 4300 DNA Analysis System (LI-COR Biosciences GmbH). Analysis was performed using the eSeq Software (LI-COR Biosciences GmbH) and the Vector NTI 10.3 (Invitrogen). After RT-PCR, the Agilent Bioanalyzer (Agilent Technologies) was used to quantify the splicing products.
Construction ofCYP2B6Minigene Expression Vectors Including Intronic Regions. A minigene including intronic regions and the reading frame from the ATG transcription start site to TAG stop was designed using Vector NTI 10.3 (Invitrogen). Two overlapping fragments 1 (3073 bp, comprising exons 2 to 4; primers 2B6_3′ecoNItaq_E2_for1 including a 5′ EcoNI restriction site and 2B6_5′sacItaq_E4_rev1 including a SacI restriction site) and fragment 2 (3877 bp, comprising exons 5 to 8; primers CYP2B6-5F and 2B6_spez_I8R_rev1) were amplified from CYP2B6*1/*1 genomic DNA samples (see scheme in Fig. 4A and primer sequences in Supplemental Table 1). After ligation into a pCR-4TOPO vector (Invitrogen) in Escherichia coli Top10 chemically competent cells (Invitrogen), unmutated clones were selected by sequencing using previously described primers (Lang et al., 2001). An internal fragment of 1437 bp was excised from intron 3 using the restriction enzyme MfeI. Intron 6 was also shortened by a fragment of 1535 bp using enzyme BsgI. A previously described CYP2B6 cDNA vector (pIKAT15; Lang et al., 2004) was modified by digestion with HindIII and SbfI and replacing the insert with a 518-bp fragment generated by the primers 2B6_5′SbfI_Ex7_for1 and 2B6_spez_I8R_rev1 to include an additional EcoNI restriction site by the reverse primer (see Fig. 4, C and D). Both fragments 1 and 2 were digested with EcoNI and SacI restriction enzymes and were combined with EcoNI-digested modified pIKAT15 in a three-fragment ligation reaction (see Fig. 4, B and C).
The resulting parental minigene construct [*1] was confirmed by sequencing. Single mutations were introduced by in vitro mutagenesis into the parental [*1] construct using the QuickChange site directed mutagenesis kit (Stratagene, Amsterdam, The Netherlands).
Primers used were 2B6_Ex4_15631T_for/rev (15631G>T in exon 4), 2B6_Ex5_777C_for/rev (18045C>A in exon 5), and 2B6_Ex5_ 18053G_for/rev (18053A>G in exon 5; see Supplemental Table 1). Successful mutagenesis was confirmed by sequencing and fragments obtained by sequential restriction digestion with enzymes MluI and Acc651, or SbfI and Acc651 were subcloned into the wild-type [*1] vector (see Figs. 4 and 5). The resulting minigenes were designated by indicating the allele number set in brackets to indicate the fact that they harbor only the respective key-mutation(s), e.g., minigene [*6] equals the construct with both SNPs 516G>T and c.785A>G. All used restriction enzymes were obtained from New England Biolabs (Frankfurt, Germany), and oligonucleotides were purchased from Metabion (Munich, Germany).
Cell Culture and Transfection of COS-1 and Huh7 Cells. COS-1 cells were cultivated in modified Dulbecco's modified Eagle's medium from Invitrogen (Dulbecco's modified Eagle's medium supplemented with 10% bovine serum, 1% penicillin/streptomycin, and 1% l-glutamine). Huh7 cells were cultured with minimal essential medium from Invitrogen (minimal essential medium supplemented with 10% bovine serum, 1% penicillin/streptomycin, and 1% l-glutamine). Both cell lines were cultured at 37°C in a 5% CO2 atmosphere. On the day before transfection, cells were seeded into 12-well plates (2.5 × 10⁵ cells per well with 1 ml of medium). One hour before transfection, culture medium was changed. Fugene (Roche Applied Science, Mannheim, Germany) was used to transfect the minigene vectors according to the manufacturer instructions. The transfection mix included 1.5 μg of the respective expression plasmid and 300 ng of pCMVβ (Clontech, Mountain View, CA). Additional transfection experiments were performed reducing the amount of minigene construct DNA by dilution (1000-fold) with empty vector.
Preparation of RNA and Protein from Cells. Cells were washed twice with ice-cold phosphate-buffered saline (PBS) after 24 or 48 h and harvested by scraping off the cells (from the plate) in either 500 μl of PBS for protein extraction or in 250 μl of RLT buffer supplemented with β-mercaptoethanol (QIAGEN) for RNA extraction. For RNA preparation, the RLT cell suspension was loaded onto a shredder column (QIAGEN), and RNA was prepared using the RNeasy mini kit (QIAGEN).
To prepare protein lysate for western blotting, the PBS cell suspensions from each well were centrifuged for 1 min at 20,000g. Cell pellets were resuspended in 250 μl of lysis buffer [final concentration, 50 mM Tris-HCl, pH 7.5, 0.25 M NaCl, 0.1% Triton X-100 (v/v), 5 mM EDTA, complete mini protease inhibitor (one tablet; Roche) in 10 ml] and incubated for 30 min on ice. The cell lysate was centrifuged for 2 min at 10,000g. Supernatant was used for determination and immunoblotting of protein content using the Bradford method (Bio-Rad, Munich, Germany). For activity measurements, PBS cell suspensions from two wells were combined and disrupted using Lysing Matrix D and the Fast Prep System (both from Qbiogene Inc., Morgan Irvine, CA) two times at level 6 for 10 s. Protein lysates were cleared by centrifugation for 1 min at 18,000g.
Determination of β-Galactosidase Activity. For determination of β-galactosidase (β-gal) activity, 50 μl of cell suspension was mixed with 50 μl of 2× passive lysis buffer (Promega, Mannheim, Germany) and incubated for 30 min at room temperature. Activity of β-gal was determined from 10 μl of cell extract incubated in 100 μl of assay buffer for 30 min. Relative β-gal activity was determined using Galacto-Light (Tropix, Bedford, MA) on an Auto-Lumat plus (Berthold Technologies, Bad Wildbad, Germany), with 300 μl of β-gal stop mix injected automatically and luminescence being measured for 5 s after a delay of 7 s (as relative light units).
CYP2B6 Enzyme Activity. Bupropion hydroxylation activity (Hesse et al., 2000) was measured in liver microsomes and in COS-1 and Huh7 cell extracts as described previously (Richter et al., 2004; Klein et al., 2005). In brief, 50 μg of protein was incubated in a reaction volume of 0.1 ml. The reaction mixture was equilibrated at 37°C for 3 min and started by adding 10 μl of 10-fold concentrated NADPH-regenerating system (final concentration, 5 mM MgCl2, 4 mM glucose 6-phosphate, 0.5 mM NADP+, and 4 U/ml glucose 6-phosphate dehydrogenase). After 15 min (for human liver microsomes) and 1 h (for CYP2B6 from transfected cell lines) at 37°C, the reaction was terminated by adding 20 μl of 1 N HCl. Substrate concentration was 50 μM for protein and human liver microsomes and 1 mM for CYP2B6 from transfected cell lines. Hydroxybupropion was determined by liquid chromatography-mass spectroscopy with a detection limit of 1 pmol as described before (Richter et al., 2004). All incubations were performed in duplicate, and the data were analyzed with Software HP Chem 4.06 (Agilent Technologies).
Allele Nomenclature and Statistics. Base numbering and allele definitions were according to the published recommendations of the CYPallele Nomenclature Committee (http://www.cypalleles.ki.se). Numbering was based on the cDNA, with the full-length cDNA sequence published by Yamano et al. (1989) defined as the wild type (CYP2B6*1). Genotype and allele frequency data are mainly assumed as described previously (Blievernicht et al., 2007). Data were compiled according to the genotype, and allele frequencies were estimated from the observed numbers of each specific allele and with the assistance of the PHASE program version 2.0.2 (Stephens et al., 2001; Stephens and Donnelly, 2003). Statistical calculations were performed using GraphPad InStat version 3.00 or the GraphPad Prism program (version 3.03; GraphPad Software Inc., San Diego, CA). Because some data sets were not normally distributed, nonparametric methods (Mann-Whitney U test; Spearman rank correlation coefficient, rs) were generally used to compare phenotypic data. Multiple comparisons were performed by one-way analysis of variance and post hoc testing with Dunnett's test. Ninety-five percent confidence intervals of proportions for mutation frequencies were calculated using the Wilson procedure with continuity correction (Newcombe, 1998). All statistical tests were performed two-tailed, and statistical significance was defined as p < 0.05.
Results
General Variability and Genotype-Phenotype Correlation in Human Liver. A previously developed TaqMan assay (Zukunft et al., 2005) was used for mRNA quantification in 150 human liver samples from which high-quality RNA was available. This assay showed specificity for all mRNA transcripts that include exons 4 and 5. CYP2B6 mRNA was not normally distributed with a 481-fold variability. Overall expression in females was 1.64-fold higher than in males (p < 0.05). However, in the subgroup of individuals who did not receive any presurgical drugs, there was no sex difference in expression, indicating that the higher overall expression was probably due to drug induction effects. Several life style factors, including smoking and alcohol consumption, had no significant influence (Supplemental Fig. 1). CYP2B6 apoprotein (n = 235) and bupropion hydroxylase activity were also not normally distributed with 361- and 238-fold variability (Supplemental Figs. 2 and 3). It is note-worthy that there was no significant overall gender difference for either protein or activity. Significant correlations were observed between CYP2B6 mRNA and protein (rs = 0.41, p < 0.0001) as well as between protein and bupropion hydroxylase activity (rs = 0.59, p < 0.0001; Supplemental Fig. 4).
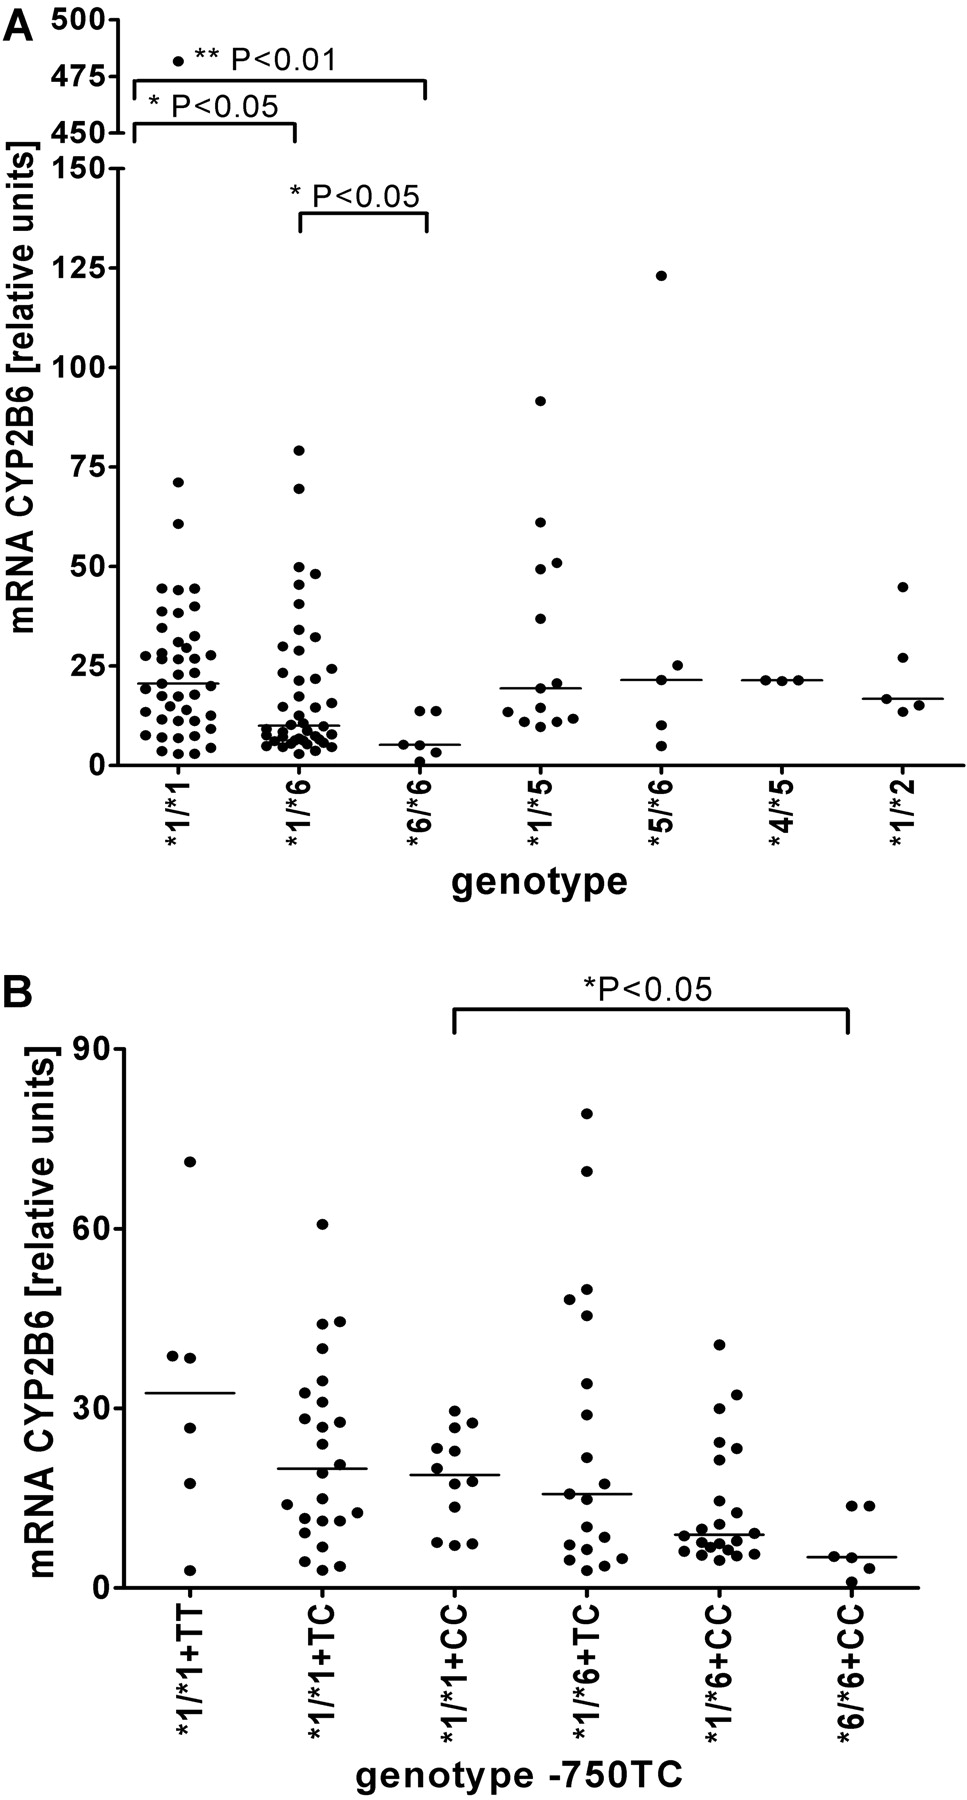
As shown in Fig. 1A, CYP2B6 mRNA expression was significantly lower in samples with *1/*6 (p < 0.05, n = 42) or *6/*6 (p < 0.01, n = 6) genotype compared with *1/*1 (n = 43). The difference between *1/*1 and *6/*6 homozygotes remained statistically significant (p < 0.01) when five individuals treated with the known CYP2B6 inducer metamizole (Saussele et al., 2007) were omitted from the analysis. This pattern closely resembled the observed patterns for protein and bupropion hydroxylase activity; compared with *1/*1, CYP2B6 protein was significantly lower in genotypes *6/*6 (p < 0.001; n = 10) and *5/*6 (p < 0.001, n = 13; Supplemental Fig. 5A), in agreement with previous studies (Lang et al., 2001; Desta et al., 2007); bupropion hydroxylase activity levels (Supplemental Fig. 5B) were also significantly lower in *6/*6 (p < 0.001, n = 10), *1/*6 (p < 0.01, n = 63), *5/*6 (p < 0.05, n = 13), and *1/*15 (p < 0.01, n = 3) as compared with *1/*1, whereas samples with *1/*22 genotype had significantly increased activity (p < 0.05; Zukunft et al., 2005).

Relationship between genotype and CYP2B6 transcript levels in human liver samples. A, scatter plots depicting β-actin normalized CYP2B6 mRNA determined by real-time RT-PCR for various genotypes. The lowest value was arbitrarily set at 1, i.e., values represent -fold differences compared with the lowest expressor. B, mRNA levels in relation to promoter genotype at –750 bp (TT, TC, or CC) in various *1 and *6 genotype contexts. Some genotype groups are not shown due to insufficient number of individuals. Statistical significance is indicated by brackets pointing at the two groups compared by Mann-Whitney test.
Influence of the Promoter Mutation–750T>C. The novel observation that reduced protein expression in *6 carriers was associated with lower mRNA amounts indicated a pretranslational mechanism possibly due to lower transcription rate of the *6 allele. Because most common alleles of CYP2B6 include haplotype variants with or without the previously identified promoter SNP–750T>C (Lamba et al., 2003; Hesse et al., 2004), we reinvestigated the influence of this SNP on expression in the liver bank. Stratification according to genotype revealed decreasing mRNA expression levels in *1/*1 carriers with one or two –750C alleles (Fig. 1B), but these differences were not statistically significant. On the contrary, among –750CC homozygotes, genotype *6/*6 had significantly reduced mRNA levels compared with *1/*1 (p < 0.05). This indicated that the mRNA expression difference between *1 and *6 was not related to the –750T>C polymorphism but to other SNP(s) of the *6 haplotype.
Alternative Splicing of CYB2B6 Pre-mRNA in Human Liver. To analyze alternative splicing of CYP2B6 pre-mRNA in human liver, two RT-PCR assays were designed. Assay 1 amplified a region between exons 2/3 and 7, and assay 2 amplified regions between exons 5/6 and 9. The region upstream of exon 2 was not considered because no splice variants have so far been described in this region (Fig. 2; Supplemental Fig. 6) and because of experimental obstacles due to the size of intron 1 (12.7 kb).
In assay 1, four bands were visible of which the largest fragment (Fig. 3A1 and 3A2, NP) was identified by sequencing as the mRNA transcript that corresponds to the reference cDNA sequence. The smallest fragment (284 bp) was confirmed to be identical to the variant SV1, which lacks exons 4 to 6 as first described (Lamba et al., 2003). Two additional fragments seen in assay 1 were identified as novel splice variants. SV7 lacked exons 4 and 5, except for a residual 50-bp fragment, whereas SV8 lacked only exon 4 (Figs. 2 and 3, A1 and A2; Supplemental Fig. 6). Although SV7 and SV8 were apparently not genotype dependent, the intensity of NP and SV1 varied strongly according to genotype. SV1 was the strongest band in most samples carrying genotype *6/*6 but was hardly detectable in *1/*1 homozygotes, whereas heterozygous samples (*1/*6) had about equal amounts of NP and SV1. The amount of NP was highest in *1/*1, intermediate in *1/*6, and lowest in *6/*6 genotypes (Fig. 3).
It is interesting to note that several samples with genotype *1/*4 and a single sample with genotype *3/*22 also had clearly detectable amounts of SV1 (Fig. 3, A1 and A2). We also genotyped all samples for the intron 3 SNP 15582C>T, which had been suggested to be potentially involved in erroneous splicing (Lamba et al., 2003). Haplotype analysis showed that 15582C>T was not present in any of the homozygous *6/*6 samples (n = 16) but associated with alleles *1C, *13B, and *15. In samples genotyped *1/*1, we detected low amounts of SV1 but normal amounts of NP. The levels of mRNA, protein expression, and enzyme activity were not significantly different in wild-type samples with or without this intronic mutation (data not shown).
The second assay resulted in the amplification of three transcripts present in all genotypes. Sequencing of these fragments revealed two variants in addition to the normal product, one that lacked exon 8 but included an alternative exon 8A (λMP8; Fig. 2; Supplemental Fig. 6) and a second transcript so far not described that lacked exon 8 (SV9; Fig. 2; Supplemental Fig. 6). These two variants were apparently not genotype dependent (data not shown).

Compilation of transcript variants of CYP2B6. Shaded boxes, exonic sequences; white boxes, intronic sequences. If possible, nomenclature of spliced transcripts was used as described before (Miles et al., 1989; Lamba et al., 2003). SV6 was newly designated, and SV7 and SV8 are novel splice variants not described before. A more detailed description of the transcript variants with literature references is given in Supplemental Fig. 6.
Establishment of a Minigene Approach to InvestigateCYP2B6Splicing. To unequivocally identify the deleterious mutation(s) that is causally responsible for the decreased expression phenotype of the *6 allele we designed a series of minigene constructs (Figs. 4 and 5). Our aim was to create constructs that include the entire open reading frame so that effects of mutations could be analyzed on the mRNA, protein, and activity level. Due to the large size of some of the introns, our cloning strategy included deletion of introns 1, 4, and 8 and parts of introns 3 and 6. The final constructs thus contained all nine exons as well as the 5′ and 3′ parts of introns 3 and 6 and the complete introns 2, 5, and 7. Transfection of the parent construct into COS-1 and Huh7 cell lines and analysis by Western blot and enzyme activity measurements demonstrated that this minigene was indeed processed, leading to functional full-length CYP2B6 (see below and data not shown).
We then used in vitro mutagenesis to introduce relevant SNPs (Fig. 5). To elucidate the causative mutation in the *6 allele, both SNPs c.516G>T and c.785A>G were introduced individually (minigenes [*9] and [*4], respectively) as well as combined (minigene [*6]). In addition we also constructed a minigene representing the so-far functionally uncharacterized c.777C>A [*3], which also seemed to be associated with SV1 (see above). Initial transfection experiments with Huh7 and COS-1 cells resulted in differences in fragment NP representing the full-length CYP2B6 cDNA between the different constructs. However, the SV1 variant was generally produced at high amounts, and no differences were seen between the constructs. In addition, other splice variants also seemed to be produced at much higher amounts compared with liver. However, when the plasmid DNA was titrated into empty vector, we observed gradual changes of the relative amounts of NP and SV1. The results shown in Fig. 6 were obtained at 1000-fold dilution of the constructs with empty vector.

Analysis of CYP2B6 aberrant splicing in human liver tissue. A1 and A2, reverse-transcribed total RNA of individual liver samples or cDNA vector pIKAT15 or a negative control (no DNA) was PCR-amplified between exons 2/3 and 7. Products and size markers (1-kb ladder) were separated by agarose gel electrophoresis. Above each gel picture, the CYP2B6 genotypes of analyzed samples are indicated. Positions of relevant products are indicated on the left in relation to a fragment length scale (in base pairs): NP, representing the full-length functional transcript; and SV1, SV8 refers to splice variants identified by sequencing (see Fig. 2). B, quantification of specific transcripts. The purified PCR products (see A) were analyzed on the Agilent Bioanalyzer. The amounts of complete fragment NP including all exons from 2 to 7 and splice variant SV1 lacking exons 4 to 6 were determined relative to an internal standard added to each sample before running the DNA lab-on-a-chip assay.
CYP2B6Expression Analysis in Minigene-Transfected Cell Lines. Transfection of all five minigene constructs resulted in immunologically detectable amounts of full-length CYP2B6 protein, as shown by Western blot analysis (Fig. 6, A1 and A2). Quantitation of β-gal normalized CYP2B6 protein revealed approximately similar expression of [*1] and [*4] minigenes in both cell lines. In contrast, both constructs harboring the c.516G>T SNP, namely [*9] and [*6], consistently expressed very low amounts of protein. The presence of c.785A>G seemed to increase the expression slightly (compare [*4] with [*1] and [*6] with [*9] in Fig. 6A). The [*3] minigene construct expressed approximately one third of CYP2B6 protein compared with the reference construct. Bupropion hydroxylase activity was only measurable in transfected COS-1 cells and closely followed the protein levels. It is noteworthy that the activities of the [*6] and [*9] constructs were extremely low, whereas the [*3] construct showed an intermediate activity level (Fig. 6B).
The mRNA transcripts formed in COS-1 and Huh7 cells transfected with the five minigene constructs were analyzed by the RT-PCR assay 1. As shown in Fig. 6C, the NP fragment was strongest in the [*1]-transfected cells, and only small yet clearly detectable amounts of SV1 were produced. In contrast, the SV1 fragment was most intense in cells transfected with [*6] and [*9], which produced low amounts of NP. These results were consistent with the protein and activity data of the transfected cells (Fig. 6, A and B) and with the observations made in homozygous *1/*1 and *6/*6 human liver samples, although generally the extent of alternative splicing seemed to be significantly increased in transfected cells. Compared with the [*1] and [*9] constructs, the [*3] construct resulted in intermediate amounts of NP and SV1 transcripts.
Discussion
In this study, we investigated the molecular mechanism by which the common CYP2B6*6 allele leads to decreased expression and function in human liver. Our data clearly establish that, first, the exon 4 SNP c.516G>T, one of the two linked nonsynonymous polymorphisms in the *6 allele, is the causal mutation finally leading to reduced function; second, that this mutation is responsible for aberrant splicing resulting in a major splice variant that lacks the region including exons 4 to 6 and the introns in between; and third, that this results in severely reduced levels of functional full-length mRNA transcript, protein, and activity. In addition, our studies characterize the rare CYP2B6*3 allele [c.777C>A, S259R] also as a low-expression allele due to aberrant splicing.
Analysis of protein expression in 235 liver samples confirmed significantly reduced protein and activity in individuals with *6/*6 compared with the *1/*1 genotype, as previously described for a smaller sample set (Desta et al., 2007). It is interesting to note that the specific activity in these livers for bupropion hydroxylation was not reduced for *1/*6 and *6/*6, indicating that the amino acid changes do not have major influence on enzyme function (Supplemental Fig. 5C). To systematically analyze the mechanism by which this low-expressor phenotype originates, we quantified hepatic mRNA levels in relation to genotype, revealing significantly reduced levels for *6/*6 and for *1/*6. This new finding of reduced mRNA in *6 genotypes is in contrast to a previous study (Hesse et al., 2004), which did not find altered mRNA levels in *6B carriers. It is interesting to note that comparing our TaqMan assay with the assay used by Hesse et al. (2004), we expect that the latter also detects splice variant SV1 because a probe set situated between exons 1 to 4 was used, whereas our assay definitively does not detect SV1 and SV8. This explains why no correlation was found between genotype and transcript level in the former study. Moreover, this novel result strongly suggested (a) pretranslational mechanism(s) in the manifestation of the *6B allele. We therefore reinvestigated the possibility that the previously described promoter SNP–750T>C, which is present in most *6 alleles but also in many other alleles, including *1, and had been suggested to disrupt a hepatic nuclear factor 1α-binding site (Lamba et al., 2003), contributing to low expression. However, even with a much larger sample set compared with those of previous studies, no statistically significant differences in relation to the –750T>C polymorphism were found at any level of expression. This finding is in agreement with a previous functional assessment of the *6B promoter haplotype, which also included the SNP–1456C>T, by reporter gene constructs, revealing no functional change compared with the wild-type promoter in rat and human hepatocytes (Zukunft et al., 2005). Additional electrophoretic mobility shift assay studies indicated only weak binding to this site (data not shown). Taken together, these data do not indicate a substantial effect of –750T>C on transcription. The recent observation by a Japanese group that a haplotype including this –750T>C polymorphism but not *6 was associated with decreased cyclophosphamide 4-hydroxylation in cancer patients may be explained by unknown Japanese polymorphisms in linkage disequilibrium with –750T>C (Nakajima et al., 2007).
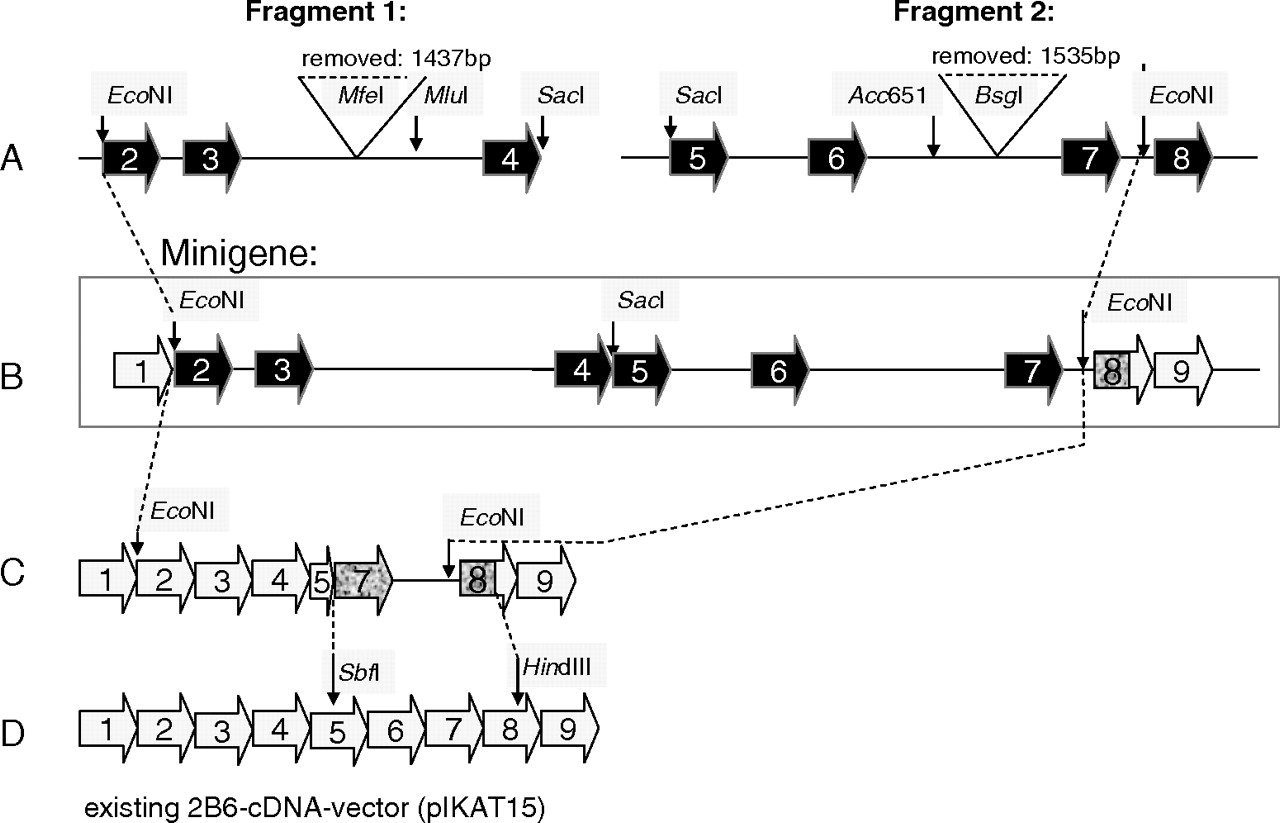
Construction of the CYP2B6 minigene mammalian expression vectors. A, two overlapping fragments 1 (3073 bp) comprising exons 2 to 4, and fragment 2 (3877 bp), comprising exons 5 to 8, were amplified from CYP2B6*1/*1 genomic DNA samples. Exons of amplified fragments are shown in black. An internal fragment of 1437 bp was excised from intron 3 using the restriction enzyme MfeI. Intron 6 was also shortened by a fragment of 1535 bp using enzyme BsgI. B, both fragments 1 and 2 were digested with EcoNI and SacI restriction enzymes and were then combined with EcoNI-digested modified pIKAT15 (C) in a three-fragment ligation reaction. This resulted in the parental mini-gene construct [*1]. Exons remaining from pIKAT15 are shown in light gray. C and D, previously described CYP2B6 cDNA vector (pIKAT15; Lang et al., 2004) was modified by digestion with HindIII and SbfI and replacing the insert with a 518-bp fragment (exons are shaded in dark gray) to include an additional EcoNI restriction site by the reverse primer.

Structure of CYP2B6 minigene constructs. All constructed mini-genes are shown with their mutations indicated.
We next investigated the possibility that the reduced mRNA amount in CYP2B6 might be explained by aberrant splicing, as previously proposed (Lamba et al., 2003). In their study, they characterized several splice variants, including one that lacked sequence corresponding to exons 4 to 6 and was found in many of their liver samples analyzed. The presence of SNP c.516G>T in exon 4 and of g.15582C>Tin intron 3 was found to correlate with the appearance of splice variant SV1. In silico analysis of splice sites suggested that mutation 15582C>T disrupts a cryptic splicing acceptor in intron 3, and c.516G>T in exon 4 may modulate an exonic splicing enhancer. However, phenotypic changes were not unequivocally related to one or the other SNP (Lamba et al., 2003). In our analysis, we could not confirm an association between g.15582C>T and hepatic phenotype and in the RT-PCR analysis samples with this SNP did not have different levels of SV1 (see Fig. 3, A2). In contrast, the RT-PCR data revealed a strikingly different splicing pattern between samples with genotype *1/*1 compared with *6/*6, in that the major transcript detected in *1/*1 samples was the normal splice product, whereas in *6/*6 samples, it was the SV1 variant. Because the *6 allele includes the two nonsynonymous SNPs in exons 4 and 5 and eventually additional unknown SNPs in intronic regions, we applied a recombinant minigene approach to unequivocally identify the causal mutation(s). The minigenes were constructed to include the entire CYP2B6 coding region and most of the intronic regions to allow analysis not only at the mRNA level but also at the protein and activity level. Indeed, transfection of two different mammalian cell lines resulted in full-length CYP2B6 protein that was functionally active. These constructs, which differed in only one or two (only for the [*6] construct) mutations, resulted in strikingly different phenotypes with consistent changes at all levels of gene expression. Thus, although the construct representing the *4 allele resulted in essentially unchanged gene expression, the constructs with the c.516G>T mutation, representing alleles *9 and *6, resulted in high levels of SV1, low levels of normal splice product, low protein levels, and low enzyme activity. It should be emphasized again that these results were only apparent when the plasmids were diluted with control plasmid at least 1000-fold. In a previous study investigating the mechanism of the CYP2D6*41 allele with a similar minigene approach, we also observed enhanced levels of aberrant splice products in transfected cells, which were independent of genotype. We speculate that transfected cells overexpress minigene-derived pre-mRNA to such an extent that splicing cannot be properly performed due to limiting amounts of splicing factors. Indeed, at 1000-fold dilution, the mRNA patterns of transfected cells corresponded well to those in human liver samples of the same genotype. We were also surprised to see such strong effects of the single mutations, which exceed the changes in expression in liver, and we have no explanation for this. It is possible that under in vivo conditions in the liver, the penetrance of these effects is less than under cell culture conditions.

CYP2B6 expression in minigene transfected mammalian cells. A1, 48 h after transfection of minigenes into Huh7 and COS-1 cells, CYP2B6 and β-actin were analyzed by immunoblotting using specific monoclonal antibodies. Transfection efficiency was additionally controlled by measuring β-galactosidase activity. Cells were transfected as follows: lane 0, untransfected; lane 1, empty vector pCMV4; lane 2, cDNA vector pIKAT15; lane 3, minigene [*1]; lane 4, minigene [*4]; lane 5, minigene [*3]; lane 6, minigene [*9]; and lane 7, minigene [*6]. A typical immunoblot is shown for each cell line. A2, CYP2B6 protein was quantified from the immunoblotting results of three independent transfections and normalized to β-galactosidase activity measured in cell extracts. The means with indicated S.D.s are shown relative to the mean protein amount for minigene [*1] set at 1.0. B, bupropion hydroxylase activities were determined in protein extracts and normalized to β-galactosidase activity. Only the result of transfected COS-1 cells is shown because bupropion hydroxylase activities of transfected Huh7 cells were too low to be reliably determined. C, total RNA from Huh7 and COS-1 cells transfected with minigene constructs was reverse transcribed and PCR amplified with primers located in exons 2/3 and 7. Lanes 1 to 7 were from transfected cells as described under A; lane 8, 1-kb ladder; lane 9, total RNA from a liver with genotype *6/*6; lane 10, total RNA from a liver with genotype *1/*1.
Finally, evolutionary considerations revealed some interesting aspects. There is evidence that CYP2B6 and the CYP2B7 pseudogene are derived from a gene duplication event (Hoffman et al., 2001; Wang et al., 2003). It is interesting to note that the key mutations defining CYP2B6*6 (i.e., c.516G>T and c.785A>G) are both present on the reference sequence of CYP2B7 (haplotype TG), whereas the orthologous rodent genes CYP2B1/2 and cyp2b9/10 correspond to the GG haplotype (data not shown). The evolutionary sequence of mutation events is difficult to deduce from these data, and it remains unknown whether the pronounced aberrant splicing observed in a very common human allele has been, or still is, a target for evolutionary selection.
In conclusion, this study firmly establishes the mechanism that leads to decreased protein and activity associated with the common CYP2B6*6 allele. We found that the major effect is due to the SNP c.516G>T in exon 4, a nonsynonymous mutation that results not only in an amino acid change but also affects splicing, thus leading to reduced functional mRNA, protein, and activity. This is an important finding because it establishes the SNP c.516G>T as the causal sequence variation that can now be reliably used in pharmacogenetic studies in various clinical settings including prediction of drug plasma concentration, toxicity, drug effectiveness, and dose adjustment. Our results also emphasize the contribution of partial aberrant splicing to phenotype determination in drug metabolism.
Acknowledgments
We thank Peter Fritz (chief pathologist, Robert-Bosch Hospital) for expert histological assessment of all liver samples. We also thank Britta Klumpp and Igor Liebermann for excellent technical assistance.
Footnotes
-
This study was supported by the German Federal Ministry of Education and Science (Grant 0313080I of the network program HepatoSys) and by the Robert-Bosch Foundation, Stuttgart, Germany.
-
U.M.Z. is a named coinventor of a pending patent application directed to the detection of specific CYP2B6 polymorphisms for diagnostic purposes. All other authors declare no conflict of interest.
-
Article, publication date, and citation information can be found at http://jpet.aspetjournals.org.
-
doi:10.1124/jpet.107.133306.
-
ABBREVIATIONS: EFV, efavirenz; SNP, single nucleotide polymorphism; SV, splicing variant; PCR, polymerase chain reaction; RT, reverse transcription; PBS, phosphate-buffered saline; β-gal, β-galactosidase; NP, normal product.
-
↵
 The online version of this article (available at http://jpet.aspetjournals.org) contains supplemental material.
 - Received October 19, 2007.
- Accepted December 28, 2007.

- The American Society for Pharmacology and Experimental Therapeutics


