


Abstract
Using Caco-2 cell monolayers expressing CYP3A4, we investigated the interplay between metabolism and transport on the first-pass intestinal extraction of the immunosuppressant sirolimus, a CYP3A4/P-glycoprotein (P-gp) substrate. Modified Caco-2 cells metabolized [14C]sirolimus to the predicted amounts of CYP3A4-mediated products based on CYP3A4 content, which was ∼20% of that measured in human small intestinal mucosal homogenate. [14C]Sirolimus also degraded to the known ring-opened product, seco-rapamycin. Unexpectedly, a ring-opened dihydro metabolite (M2) was the major product detected in cells at all sirolimus concentrations examined (2–100 μM). Greater M2 formation after apical versus basolateral dosing (1.6-fold) was explained by higher intracellular content of sirolimus after apical dosing. M2 was not detected in incubations with human liver and intestinal microsomes but was readily detected with corresponding homogenates. M2 formation was NADPH-dependent but unaffected by the CYP3A4 inhibitors ketoconazole and troleandomycin. Although M2 was formed from purified seco-rapamycin (20 μM) in the homogenates, it was not detected in cells when seco-rapamycin was added to the apical compartment, because seco-rapamycin was essentially impermeable to the apical membrane. Sirolimus, seco-rapamycin (basolaterally dosed), and M2 were all actively secreted across the apical membrane, and secretion of each was inhibited by the P-gp inhibitor LY335979 [(2R)-anti-5-{3-[4-(10,11-difluoromethanodibenzo-suber-5-yl)piperazin-1-yl]-2-hydroxypropoxy}quinoline trihydrochloride]. Along with CYP3A4-mediated metabolism and P-gp-mediated secretion, we conclude that the following novel pathway, which occurs at least in the intestine, may contribute significantly to the first-pass extraction of sirolimus in humans: intracellular degradation of sirolimus to seco-rapamycin, metabolism of seco-rapamycin to M2 by an unidentified nonmicrosomal enzyme, and P-gp-mediated secretion of M2 and seco-rapamycin.
Although solid organ transplantation has become a widely practiced surgical procedure in humans, the management of oral drug therapy for the transplant recipient continues to challenge the clinician. For example, the gold standard immunosuppressant cyclosporine (cyclosporine A, Sandimmune, Neoral), as well as its partner tacrolimus (FK506, Prograf), each characteristically exhibits a low average oral bioavailability (27 and 25%, respectively) with wide interindividual variation, both ranging from approximately 4 to 89% (Ptachcinski et al., 1986; Venkataramanan et al., 1995). This property, coupled with a narrow therapeutic window, can lead to an under- or overdosing of the patient, which in turn can lead to graft rejection or toxicity.
Cyclosporine and tacrolimus are both extensively metabolized by cytochrome P450 (CYP) 3A4 (Kronbach et al., 1988; Sattler et al., 1992), the major CYP isoform expressed in the adult liver (Shimada et al., 1994) and in brush-border epithelial cells lining the small intestine (enterocytes) (Kolars et al., 1992a). In addition, these drugs are substrates for the MDR1 gene product P-glycoprotein (P-gp) (Saeki et al., 1993), an apically directed ATP-dependent transmembrane secretory (efflux) pump that is also expressed at high levels in enterocytes (Thiebaut et al., 1987). Because CYP3A4 protein and P-gp levels in the small bowel vary considerably among people, at least 11-fold (Lown et al., 1994; Paine et al., 1997) and 2-fold (Lown et al., 1997; Dürr et al., 2000), respectively, it seems likely that interindividual differences in intestinal CYP3A4-mediated metabolism and P-gp-mediated efflux account, in part, for the unpredictable oral bioavailabilities commonly observed with cyclosporine and tacrolimus.
To further complicate oral cyclosporine or tacrolimus therapy, the transplant recipient typically receives multiple concomitant medications, several of which are potent CYP3A4 modulators. For example, the inhibitors ketoconazole, erythromycin, clarithromycin, and various calcium channel blockers can significantly raise blood levels, whereas the prototypic inducer rifampin and the popular herbal medicine St. John's wort can significantly reduce blood levels (Venkataramanan et al., 1995; Campana et al., 1996; Karliova et al., 2000; Ruschitzka et al., 2000). Likewise, there are increasing reports that some of these CYP3A4 modulators (ketoconazole, rifampin, St. John's wort) can also alter intestinal P-gp levels (Floren et al., 1997; Greiner et al., 1999; Dürr et al., 2000). These findings, along with the contention that intestinal CYP3A4 may be more sensitive to the modulators' effects compared with hepatic CYP3A4 (Thummel et al., 1997), imply that some drug-drug interactions occur largely at the level of the intestine.
Sirolimus (rapamycin, Rapamune) is a macrolide lactone that joined the immunosuppressant arsenal when it was recently approved by the Food and Drug Administration for the prevention of kidney transplant rejection. It is structurally related to tacrolimus but differs in its mechanism of action; whereas tacrolimus and cyclosporine inhibit the first phase of T-cell activation, sirolimus inhibits the second phase of T-cell activation. In common with cyclosporine and tacrolimus, sirolimus displays a low average oral bioavailability, estimated to be 20%, and large interpatient variation in its pharmacokinetics, namely, its absorption-related parameters (absorption rate constant, lag-time, and apparent oral clearance) (Ferron et al., 1997). Likewise, sirolimus is metabolized by CYP3A4 in both human liver and small intestinal microsomes to various demethylated and hydroxylated species (Sattler et al., 1992; Lampen et al., 1998). Degradation products, including an ester hydrolysis product and a ring-opened isomer, have also been described (Wang et al., 1994). Perhaps not surprisingly, sirolimus is a substrate for P-gp (Crowe and Lemaire, 1998). It is therefore likely that variable intestinal metabolism and efflux account in part for the interindividual variation in the oral pharmacokinetics of sirolimus. Moreover, it is anticipated that sirolimus would be subject to similar drug-drug interactions described for cyclosporine and tacrolimus.
The human colon adenocarcinoma cell line Caco-2 is widely used as a model to study the absorption of drugs and other xenobiotics (Meunier et al., 1995; Artursson and Borchardt, 1997). When fully differentiated, polarized monolayers of these cells structurally resemble small intestinal enterocytes. Expression of various transporters involved in the absorptive process, including P-gp, is also apparent (Meunier et al., 1995). However, under standard culturing conditions, several of the drug-metabolizing enzymes, particularly CYP3A4, are lacking. Auspiciously, Schmiedlin-Ren et al. (1997)reported that when a clone of this cell line was treated with the hormone 1α,25-dihydroxy vitamin D3[1α,25-(OH)2-D3], also known as calcitriol, both CYP3A4 expression and associated catalytic activity (midazolam 1′-hydroxylation) markedly increased. Our laboratories and others later demonstrated that this modified Caco-2 cell system could be used to study the presystemic intestinal extraction of midazolam (Fisher et al., 1999) and the CYP3A/P-gp substrate indinavir (Hochman et al., 2000, 2001). We therefore reasoned that this modified cell system would serve as a useful model to study the roles of metabolism and efflux on the intestinal first-pass extraction of sirolimus and to predict sirolimus-drug interactions at the level of the intestine. We further anticipated that our investigation would identify a strategy to improve, and reduce the variation in, the oral bioavailability of this drug.
Experimental Procedures
Materials and Chemicals.
Uncoated track-etched polyethylene terephthalate inserts (1-μm pore size, 4.2-cm2growth area) and mouse laminin were purchased from Collaborative Biochemical Products (Bedford, MA). Dulbecco's modified Eagle's medium (DMEM), nonessential amino acids (NEAA), penicillin, and streptomycin were purchased from Invitrogen (Carlsbad, CA). Fetal bovine serum (FBS) was purchased from Hyclone Laboratories (Logan, UT). dl-α-Tocopherol, sodium selenite, zinc sulfate, troleandomycin, cyclosporine, ketoconazole, and NADPH were purchased from Sigma Chemical (St. Louis, MO). 1α,25-(OH)2-D3 was purchased from BIOMOL Research Laboratories (Plymouth Meeting, PA). Midazolam was a gift from Roche Applied Science (Nutley, NJ). LY335979, a selective P-gp inhibitor (Dantzig et al., 1999), was a gift from Eli Lilly (Indianapolis, IN). Sirolimus, [14C]sirolimus (radiochemical purity, >95%; specific activity, 43.0 μCi/mg), seco-rapamycin, and 32-desmethoxy sirolimus were obtained from Wyeth-Ayerst (Pearl River or Rouses Point, NY); [14C]sirolimus was radiolabeled at the positions 2 and 6 of the piperidine ring. Ultima Gold and Ultima Flow scintillation cocktails were purchased from Packard Instrument Co. (Meriden, CT). High-pressure liquid chromatography (HPLC) grade water and solvents were purchased from EM Scientific (Gibbstown, NJ). All other chemicals and reagents were of tissue culture, electrophoresis, or reagent grade where appropriate.
Cell Culture Conditions.
All cell cultures were maintained in a 37°C, humidified incubator with a 5% carbon dioxide atmosphere. Culture inserts were coated with 5 μg/cm2 mouse laminin, an extracellular matrix protein, as previously described (Fisher et al., 1999). The Caco-2 clone P27.7 (Schmiedlin-Ren et al., 1997), passage 33, was seeded at a density of approximately 5 × 10⁵ cells/cm2 and grown in complete growth medium (DMEM containing 25 mM glucose and 4 mMl-glutamine, 20% heat-inactivated FBS, 0.1 mM NEAA, 100 U/ml penicillin, 100 μg/ml streptomycin, and 45 nMdl-α-tocopherol). Upon achieving confluence (trans-epithelial electrical resistance values ≥250 Ω · cm2), the cell monolayers were treated for 2 weeks with differentiation medium [DMEM, 5% heat-inactivated FBS, 0.1 mM NEAA, 100 U/ml penicillin, 100 μg/ml streptomycin, 45 nM dl-α-tocopherol, 0.1 μM sodium selenite, 3 μM zinc sulfate, and 0.25 μM 1α,25-(OH)2-D3] as previously described (Schmiedlin-Ren et al., 1997; Fisher et al., 1999). To render these modified Caco-2 cells more amenable for the study of first-pass metabolism, differentiation medium devoid of FBS and 1α,25-(OH)2-D3(hereafter termed incubation medium) was used for all metabolism and transport experiments. Under these conditions, CYP3A4 activity (midazolam 1′-hydroxylation) was previously found to be relatively stable for the first 4 h of incubation (Fisher et al., 1999). Therefore, all incubation times were not allowed to exceed ∼4 h.
For a given experiment, incubation medium was prepared fresh and kept at 37°C; it was spiked with drug(s) and/or vehicle just before its addition to duplicate or triplicate cultures. Unlabeled sirolimus was dissolved as 100-fold concentrated solutions in ethanol, and [14C]sirolimus was diluted in ethanol. Midazolam was dissolved as a 1000-fold concentrated solution in DMSO. All cell monolayers were washed thrice with 1 ml of warm DMEM before addition of spiked or plain incubation medium. For the sirolimus-treated cultures, apical and basolateral media were collected at the indicated times, immediately placed on dry ice, and protected from light. The remaining monolayers were quickly rinsed with 1 ml of cold DMEM, the cells scraped into 0.4 ml of cold incubation medium, and then placed on dry ice and protected from light. As a positive control for CYP3A4 activity (midazolam 1′-hydroxylation) and protein content, 1.5 ml of incubation medium containing 3 μM midazolam was added to the apical chamber, followed by an equal volume of plain incubation medium to the basolateral chamber of duplicate cultures. After 2 h, apical and basolateral media were collected and placed on dry ice. The remaining cell monolayers were washed thrice with warm DMEM then harvested for Western blot analysis (see below). All collections were stored at −80°C pending analysis. Media and cell scrapings collected from sirolimus-treated cultures were analyzed for sirolimus and drug-related products by HPLC with radiochemical detection, LC/MS, and LC/MS/MS (see below). Media collected from midazolam-treated cultures were analyzed for 1′-hydroxymidazolam by gas chromatography/mass spectrometry as previously described (Schmiedlin-Ren et al., 1997).
Dose-Response and Time Course Studies.
For the dose-response study, 1.5 ml of incubation medium containing vehicle (1% ethanol, v/v) or 2, 8, 25, or 100 μM sirolimus and 0.1 μCi of radioactivity were added to the apical chamber, followed by an equal volume of plain incubation medium to the basolateral chamber of duplicate cultures. Apical and basolateral media and cell scrapings were collected after 0 or 1 h. Based on results from this study (percentage of recovery, sink conditions, linearity of metabolism, and maintenance of vectorial transport), a sirolimus concentration of 20 μM was used (and radioactivity increased to 1 μCi) for all ensuing experiments. For the time course study, incubation medium containing vehicle or sirolimus was added to the apical or basolateral chamber, followed by plain incubation medium to the opposite chamber of duplicate cultures. Apical and basolateral media and cell scrapings were collected after 0, 0.5, 1, 2, or 4 h.
Effects of CYP3A4/P-gp Inhibitors on Sirolimus Disposition.
The following CYP3A4 and/or P-gp inhibitors were used to distinguish the roles of metabolism and secretion on sirolimus disposition: troleandomycin (CYP3A4), cyclosporine (CYP3A4 and P-gp), and LY335979 (P-gp). Troleandomycin and LY335979 were dissolved as 1000-fold concentrated solutions in DMSO. Cyclosporine was dissolved as a 1000-fold concentrated solution in ethanol. As a preincubation step, incubation medium containing vehicle or the various inhibitors was added to the apical or basolateral chamber, followed by plain incubation medium to the opposite chamber of at least duplicate cultures. After 30 min, apical and basolateral media were removed and immediately replaced with each inhibitor (or vehicle) plus sirolimus. After 4 h, apical and basolateral media and cell scrapings were collected. Final concentrations of troleandomycin, cyclosporine, LY335979, DMSO, and ethanol were 30 μM, 40 μM, 0.5 μM, 0.1% (v/v), and 1.1% (v/v), respectively. In a separate experiment, the effect of each inhibitor on midazolam 1′-hydroxylation was examined in the same manner as described for sirolimus, but the cultures were dosed apically only.
The effect of another CYP3A4 inhibitor, ketoconazole, on sirolimus metabolism was next examined and compared with its effect on midazolam 1′-hydroxylation. Ketoconazole was dissolved as 1000-fold concentrated solutions in ethanol. Incubation medium containing sirolimus or midazolam plus ketoconazole (1 or 10 μM) was added to the apical chamber, followed by plain medium to the basolateral chamber of duplicate cultures. After 2 h, apical and basolateral media and cell scrapings were collected.
Metabolism of Sirolimus in Human Tissue Homogenates.
To determine whether a nonmicrosomal enzyme mediated the formation of the sirolimus metabolite M2, human jejunal mucosal and liver homogenates and Caco-2 homogenates were used. The jejunal and liver homogenates had been previously prepared as described (Paine et al., 1997). Triplicate incubation mixtures containing 0.5 mg of homogenate protein and unlabeled sirolimus (dissolved in ethanol) in potassium phosphate buffer (0.1 M, pH 7.4) were preincubated for 5 min at 37°C in a shaking water bath. NADPH was prepared fresh in phosphate buffer. Reactions were initiated by the addition of NADPH to yield final incubation volumes of 0.5 ml. Final concentrations of sirolimus, NADPH, and ethanol were 20 μM, 1 mM, and 1% (v/v), respectively. Reactions were terminated after 1 h by immediately placing the mixtures on dry ice and protecting from light. For comparison, human jejunal and liver microsomes (which exhibited average and low CYP3A catalytic activity, respectively, within each tissue bank) (Paine et al., 1997) were incubated similarly, only the liver microsomal reactions were terminated after 0.5 h. All incubation mixtures were stored at −80°C pending analysis (see below).
As a positive control for CYP3A activity, the same human tissue preparations were examined in parallel for midazolam 1′-hydroxylation activity. Triplicate incubation mixtures containing 0.5 mg (homogenate), 0.05 mg (liver microsomes), or 0.1 mg (jejunal microsomes) of protein and midazolam (dissolved in DMSO) were preincubated for 5 min. Reactions were initiated by the addition of NADPH to yield final incubation volumes of 0.5 ml. Final concentrations of midazolam, NADPH, and DMSO were 3 μM, 1 mM, and 0.1% (v/v), respectively. Reactions were terminated after 4 min by the addition of 0.5 ml of cold sodium carbonate (0.1 M, pH 12). Incubates were further processed and analyzed for 1′-hydroxymidazolam by gas chromatography/mass spectrometry as previously described (Paine et al., 1997).
Disposition of Seco-Rapamycin in Caco-2 Cells and Human Homogenates.
To determine whether the sirolimus metabolite M2 was formed from the degradation product seco-rapamycin, duplicate Caco-2 cell cultures were dosed apically or basolaterally with 20 μM seco-rapamycin and incubated for 4 h. To determine whether seco-rapamycin is a substrate for P-gp, duplicate cultures were incubated with 0.5 μM LY335979 in the same manner as described previously for sirolimus. For comparison, a parallel set of cultures was incubated similarly with 20 μM sirolimus, but dosed apically only. M2 formation was also examined in human jejunal mucosal and liver homogenates and Caco-2 homogenates by incubating each preparation, in duplicate, with 20 μM seco-rapamycin in the same manner as described previously for sirolimus. For comparison, a parallel set of incubations containing 20 μM sirolimus was also performed. To determine whether a high dose of ketoconazole (100 μM) inhibited the formation of M2, parallel experiments with Caco-2 cells and the various homogenates were performed in a similar manner as described above, only ketoconazole (dissolved as a 100-fold concentration solution in ethanol) was included in the incubation medium/mixtures.
Harvesting for Western Blot Analysis.
Cell monolayers from the midazolam-treated cultures were lysed by adding 0.35 ml of ice-cold homogenizing buffer (20% glycerol, 0.1 M Tris-HCl, and 10 mM EDTA, pH 7.4) containing the following protease inhibitors: 1 mM dithiothreitol, 1 mM phenylmethylsulfonyl fluoride, 1 mM benzamidine, and 100 μg/ml aprotinin. The cells were scraped, transferred to a conical ground glass tissue grinder, and hand-homogenized (∼30 strokes). The homogenate was then sonicated for 10 s and stored at −80°C.
Western Blot Analysis of CYP3A, Villin, and P-gp.
Total protein concentrations of the cell homogenates were determined by the method of Lowry et al. (1951) by using bovine serum albumin as the reference standard. Homogenates were diluted in sample buffer (2% sodium dodecyl sulfate, 5% sucrose, 5% 2-mercaptoethanol, and 50 mM Tris-HCl, pH 6.8) to final concentrations of 15 μg/60 μl. For comparison, human intestinal mucosal homogenates prepared previously (Paine et al., 1997), specifically, from a 1-ft section of proximal jejunum and distal ileum obtained from two different donors, were diluted similarly. (Microsomes prepared previously from both donors exhibited average CYP3A protein content and catalytic activity within our tissue bank.) Samples (60 μl) were then loaded onto 0.1% sodium dodecyl sulfate-7% polyacrylamide gels. cDNA-expressed human CYP3A4 (Gentest, Woburn, MA) was used as a reference standard and loaded into adjacent lanes. The proteins were electrophoretically separated (∼3.5 h) then transferred overnight to a polyvinylidene difluoride membrane (0.45-μm pore size; Amersham Biosciences, Inc., Piscataway, NJ). Total CYP3A protein was detected using a mouse monoclonal antibody, termed 13-7-10 (Beaune et al., 1985), that recognizes all human CYP3A isoforms. Villin, a constitutive cytoskeletal protein, was detected using a mouse monoclonal antibody (Chemicon International, Temecula, CA). P-gp was detected using a rabbit polyclonal antibody raised against a peptide of human P-gp, a kind gift from Dr. Erin G. Schuetz (St. Jude's Children's Research Hospital, Memphis, TN). Horseradish peroxidase-conjugated rabbit anti-mouse IgG and goat anti-rabbit IgG/A/M (Zymed Laboratories, South San Francisco, CA) were used as secondary antibodies. All proteins were visualized with the use of enhanced chemiluminescence reagents (Amersham Biosciences, Inc.) and a Chemi-Doc imaging system (Bio-Rad, Hercules, CA). Band intensities were assessed by densitometry with the Bio-Rad software program Quantity One (version 4.1).
Determination of Radioactivity in Apical, Basolateral, and Cellular Fractions.
Duplicate aliquots (20 μl) of apical or basolateral fractions were analyzed for radioactivity. Cell scrapings (in 0.4 ml of incubation medium) were mixed with 50 μl of ethanol, sonicated in a water bath for 5 min at room temperature, and brought up to 1 ml with potassium phosphate buffer (0.1 M, pH 7.4). Duplicate aliquots (10 μl) of the cell scraping mixtures were analyzed for radioactivity. Samples were mixed with 10 ml of liquid scintillation cocktail, and radioactivity was determined using a Packard 2750 TR/LL liquid scintillation spectrophotometer (Canberra Packard, Downers Grove, IL). Each vial was counted for 5 min or 2% ς error, whichever occurred first. Counts per minute were converted to disintegrations per minute by using a quench curve generated from external standards of known radioactivity.
Extraction of Radioactivity from Apical, Basolateral, and Cellular Fractions for Analyses by HPLC and/or LC/MS.
Apical and basolateral fractions or cell scraping mixtures (1 ml) were applied to C18 solid phase extraction cartridges (100 mg; Waters, Milford, MA), which had been prewashed with 1 ml of methanol followed by 1 ml of deionized water. After washing the cartridge twice with 1 ml of deionized water, the sample was eluted with 2 ml of methanol. The methanol eluate was collected, evaporated to dryness under a stream of nitrogen (Turbovap LV; Zymark Co., Hopkinton, MA), and reconstituted with 300 μl of methanol/water (6:4). Duplicate 10 μl-aliquots of the extracts were analyzed for radioactivity by scintillation counting; a separate 100-μl aliquot was analyzed by HPLC and/or LC/MS.
HPLC.
HPLC analyses were performed on a Waters HPLC system consisting of a 715 Ultra WISP autosampler, a 600E system controller, a 486 Tunable absorbance detector, and a Radiomatic Flow-One A-500 radioactivity detector (Canberra Packard). Data acquisition and analysis were performed using the software programs Radiomatic (Canberra Packard), PE Nelson Turbochrom (PerkinElmer, Inc., Wellesley, MA), or Millenium 32 (Waters). Separation of sirolimus and drug-derived products was achieved on a Supelcosil (Supelco, Bellefonte, PA) LC-18 column (250 × 4.6 mm; 5 μm) by using a linear gradient of 65:35 to 86:14 methanol/ammonium acetate (5 mM) over 80 min at a flow rate of 0.2 ml/min. The eluant was monitored at 276 nm.
Electrospray Ionization LC/MS and LC/MS/MS.
All electrospray ionization (ESI) LC/MS and LC/MS/MS analyses were performed using a Hewlett Packard (Palo Alto, CA) 1090 M HPLC connected via 0.005-in. i.d. peek tubing to a Sciex (Thornhill, Toronto, ON, Canada) API III+ mass spectrometer. Chromatographic separation of sirolimus and its metabolites was achieved on a BDS Hypersil (Keystone Scientific Inc., Bellefonte, PA) C18 column (150 × 2 mm, 5 μm) by using a linear gradient of 58:42 to 85:15 methanol/ammonium acetate (10 mM) over 80 min at a flow rate of 0.2 ml/min. The column was maintained at 40°C. The eluate was split postcolumn with 50 to 80 μl/min being pneumatically sprayed into the mass spectrometer. The spray needle was maintained at +5kV for ESI LC/MS analysis in the positive ion mode. The interface heater was maintained at 55°C during analysis. Desolvation of the solvent droplets was performed at a declustering potential of +30 V. The [M + NH4]+ ions of sirolimus and its metabolites were monitored at unit mass resolution in the ESI LC/MS-SIM experiment. The following ions were monitored:m/z 903.6, didemethyl sirolimus;m/z 917.6, demethyl sirolimus;m/z 931.6, sirolimus and isomers;m/z 933.6, hydroxy-demethyl sirolimus;m/z 947.6, hydroxy sirolimus;m/z 949.6, sirolimus plus water; andm/z 963.6, dihydroxy sirolimus.
Full scan ESI LC/MS/MS analysis in the negative ion mode was conducted by spraying the LC eluate at −4 kV. Declustering potential was set at −70 V. Molecular anions ([M − H]−) corresponding to sirolimus and its metabolites were selected by Q1 at resolution 3 to 4 Da at half-height. Collision-activated dissociation of the molecular anion was induced by argon at a collision gas thickness of 240 to 250 × 1012 atoms of argon per cubic centimeter and at collision energy of 33 eV. The resultant product ions were mass analyzed at unit mass resolution by scanning Q3 from m/z 50 to 950 in 0.17 ms and at step size of 0.1 Da. Ions were detected with the electron multiplier set at saturation (4500 V). Structural elucidation of sirolimus-derived products was based on the mass shift of the m/z321 and m/z 590 fragments. Peak area integration was performed manually using MacSpec (version 3.22; PE Sciex, Concord, Ontario, Canada).
High-Resolution LC/MS/MS.
High-resolution LC/MS/MS was performed on a Finnigan MAT900S instrument (Thermo Finnigan, Bremen, Germany) equipped with a nanospray ESI source. Ionization was in the positive ESI mode with the spray voltage and multiplier set at 4.7 and 1.8 kV, respectively. The resolution was 25,000 form/z 931 at 10% peak valley. The nanospray flow rate was 0.1 μl/min by using a solution of 60:40 acetonitrile/ammonium acetate (10 mM). Accurate mass measurements were performed by both manual peak matching and auto peak matching at resolution 25,000 by using [M + NH4]+ atm/z 901.57895 (C50O12N2H81) of 32-desmethoxy sirolimus as an internal reference ion. The electric sector analyzer was calibrated before the measurement by using [M + NH4]+ atm/z 931.58951 (C51O13N2H83) of sirolimus standard and [M + NH4]+ atm/z 901.57895 of 32-desmethoxy sirolimus reference standard.
Calculations.
The apparent permeability coefficient (Papp) of sirolimus in Caco-2 cells from the dose-response study was determined according to the following equation:
The first-pass intestinal extraction fraction (EI) of sirolimus was determined according to the following equation:
Statistical Analysis.
The unpaired Student's ttest with equal variance was used to determine whether a significant difference existed (p < 0.05) between the effect of vehicle and each CYP3A4/P-gp inhibitor on the disposition of sirolimus and M2 in modified Caco-2 cells. This analysis was performed using StatView (version 5.0.1; SAS Institute, Inc., Cary, NC).
Results
Relative CYP3A Protein and P-gp Content in Modified Caco-2 Cells and Human Small Intestinal Mucosal Homogenates.
When the Caco-2 clone P27.7 was treated with 0.25 μM 1α,25-(OH)2-D3 for 2 weeks postconfluence, CYP3A immunoreactive protein became readily detectable, villin content remained relatively unchanged, and P-gp content increased (Fig. 1), reproducing results reported previously (Schmiedlin-Ren et al., 1997). Using cDNA-expressed human CYP3A4 as a reference standard, the amount of CYP3A4 protein per 1α,25-(OH)2-D3-treated culture insert ranged from 2.3 to 2.8 pmol (mean ± S.D., 2.6 ± 0.2 pmol), consistent with results reported by Fisher et al. (1999). Relative CYP3A content (CYP3A/villin ratio) varied little among the Caco-2 cell homogenates (range 0.39–0.53), with the average (0.47 ± 0.07) ranging from 16 to 30% of the CYP3A/villin ratio for the two different human jejunal (2.96 and 2.12) and ileal (2.50 and 1.56) mucosal homogenates, all of which contained average CYP3A protein content and catalytic activity within our tissue bank. P-gp/villin ratios also varied little among the Caco-2 cell homogenates (range 1.32–1.48; mean ± S.D., 1.39 ± 0.08), were comparable to those for jejunal homogenates (1.56 and 1.38), and were ∼70% of those for ileal homogenates (1.94 and 2.09). Interestingly, jejunal P-gp migrated slightly slower compared with ileal and Caco-2 cell P-gp. To our knowledge, this has not been reported previously and could reflect differing degrees of glycosylation of the protein. The P-gp/villin ratio for the representative non-1α,25-(OH)2-D3-treated Caco-2 culture insert was 0.48.
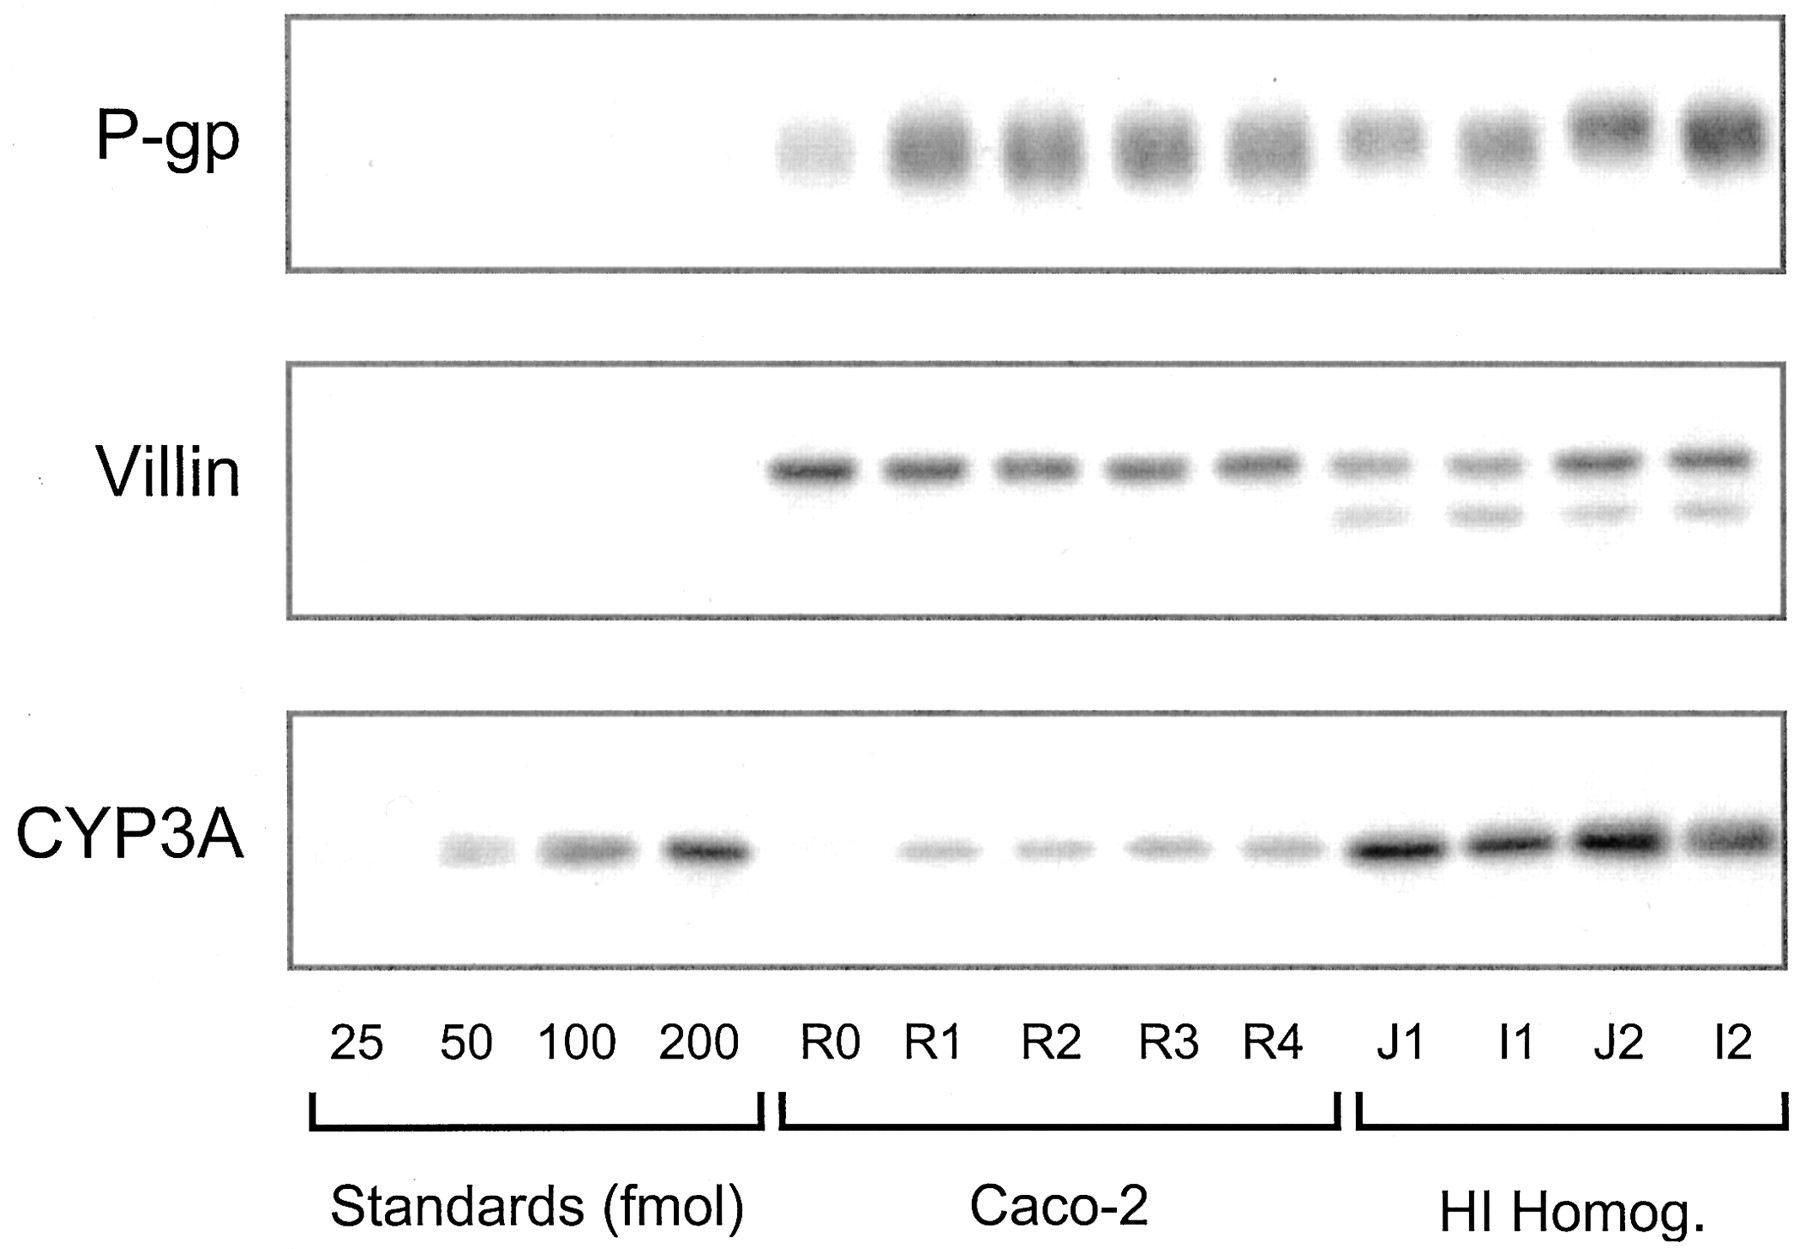
Western blot of Caco-2 and human intestinal mucosal homogenates analyzed for P-gp, villin, and CYP3A4. Lanes 1 to 4, cDNA-expressed human CYP3A4 (25, 50, 100, and 200 fmol). R0, Caco-2 homogenate obtained from a representative non-1α,25-(OH)2-D3-treated culture insert. R1–R4, Caco-2 homogenates obtained from a representative 1α,25-(OH)2-D3-treated culture insert from four separate experiments. JI, I1 and J2, I2, jejunal and ileal mucosal homogenates from donor 1 and 2, respectively. Lanes 5 to 13 were loaded with 15 μg of protein.
Concentration-Dependent Transport and Metabolism of Sirolimus after Apical Application.
The flux of sirolimus across modified Caco-2 cell monolayers, at apical concentrations ranging from 2 to 100 μM and using an incubation time of 1 h, was more than dose proportional. The amount of sirolimus recovered in the basolateral compartment increased from 0.1 to 3.2% of the applied dose. The amount of sirolimus recovered in cells was 6% for the 2 μM dose and ∼15% for the remaining drug concentrations. The apparent permeability coefficient of sirolimus (Papp) also increased with substrate concentration but was less than dose-proportional (from 9.9 to 10−8 to 9.7 × 10⁻⁷ to 2.3 × 10⁻⁶ to 3.2 × 10⁻⁶cm/s at 2, 8, 25, and 100 μM, respectively). These findings are consistent with an apically located secretory mechanism. With the exception of the 2 μM sirolimus concentration, total radioactivity recovery (apical, basolateral, and cell fractions) was virtually quantitative.
HPLC analyses of apical, basolateral, and cell fraction extracts showed the presence of at least four drug-derived products (designated D1, D2, M1, and M2) besides parent drug. As discussed in detail under “Sirolimus Product Identification”, D1 and D2 were characterized as previously described nonenzyme-dependent degradation products of sirolimus, whereas M1 and M2 were characterized as NADPH-dependent sirolimus metabolites. In this and all subsequent experiments, modified Caco-2 cells produced 1′-hydroxymidazolam in expected amounts based on previous reports (Schmiedlin-Ren et al., 1997; Fisher et al., 1999).
Shown in Fig. 2 is the dose-dependent formation of sirolimus metabolites (sum of M1 and M2). At sirolimus concentrations ≤25 μM, the metabolites preferentially “sorted” to the apical compartment. The appearance of metabolites in the basolateral and cellular compartments increased linearly throughout the sirolimus concentration range, whereas the appearance of metabolites in the apical compartment reached a plateau at approximately 25 μM. Consequently, total metabolite formation (sum of metabolites in apical, basolateral, and cellular compartments) began to deviate from linearity above 25 μM. Extraction fractions, when calculated based on the formation of M1 and M2, decreased from a value of 0.87 to values of 0.62, 0.38, and 0.20 at a sirolimus concentrations of 2, 8, 25, and 100 μM, respectively. Because 25 μM sirolimus was the highest concentration at which total metabolite formation was linear and the apical/basolateral sorting of metabolites was maintained, a concentration of 20 μM was chosen to evaluate the time course of transport and metabolism of sirolimus across the modified Caco-2 cell monolayers.

Concentration-dependent formation of sirolimus metabolites (M1 and M2) in modified Caco-2 cell monolayers after apical application of sirolimus (2, 8, 25, and 100 μM) and a 1-h incubation. Each point represents the mean of duplicate culture inserts.
Time-Dependent Transport and Metabolism of Sirolimus after Apical or Basolateral Application.
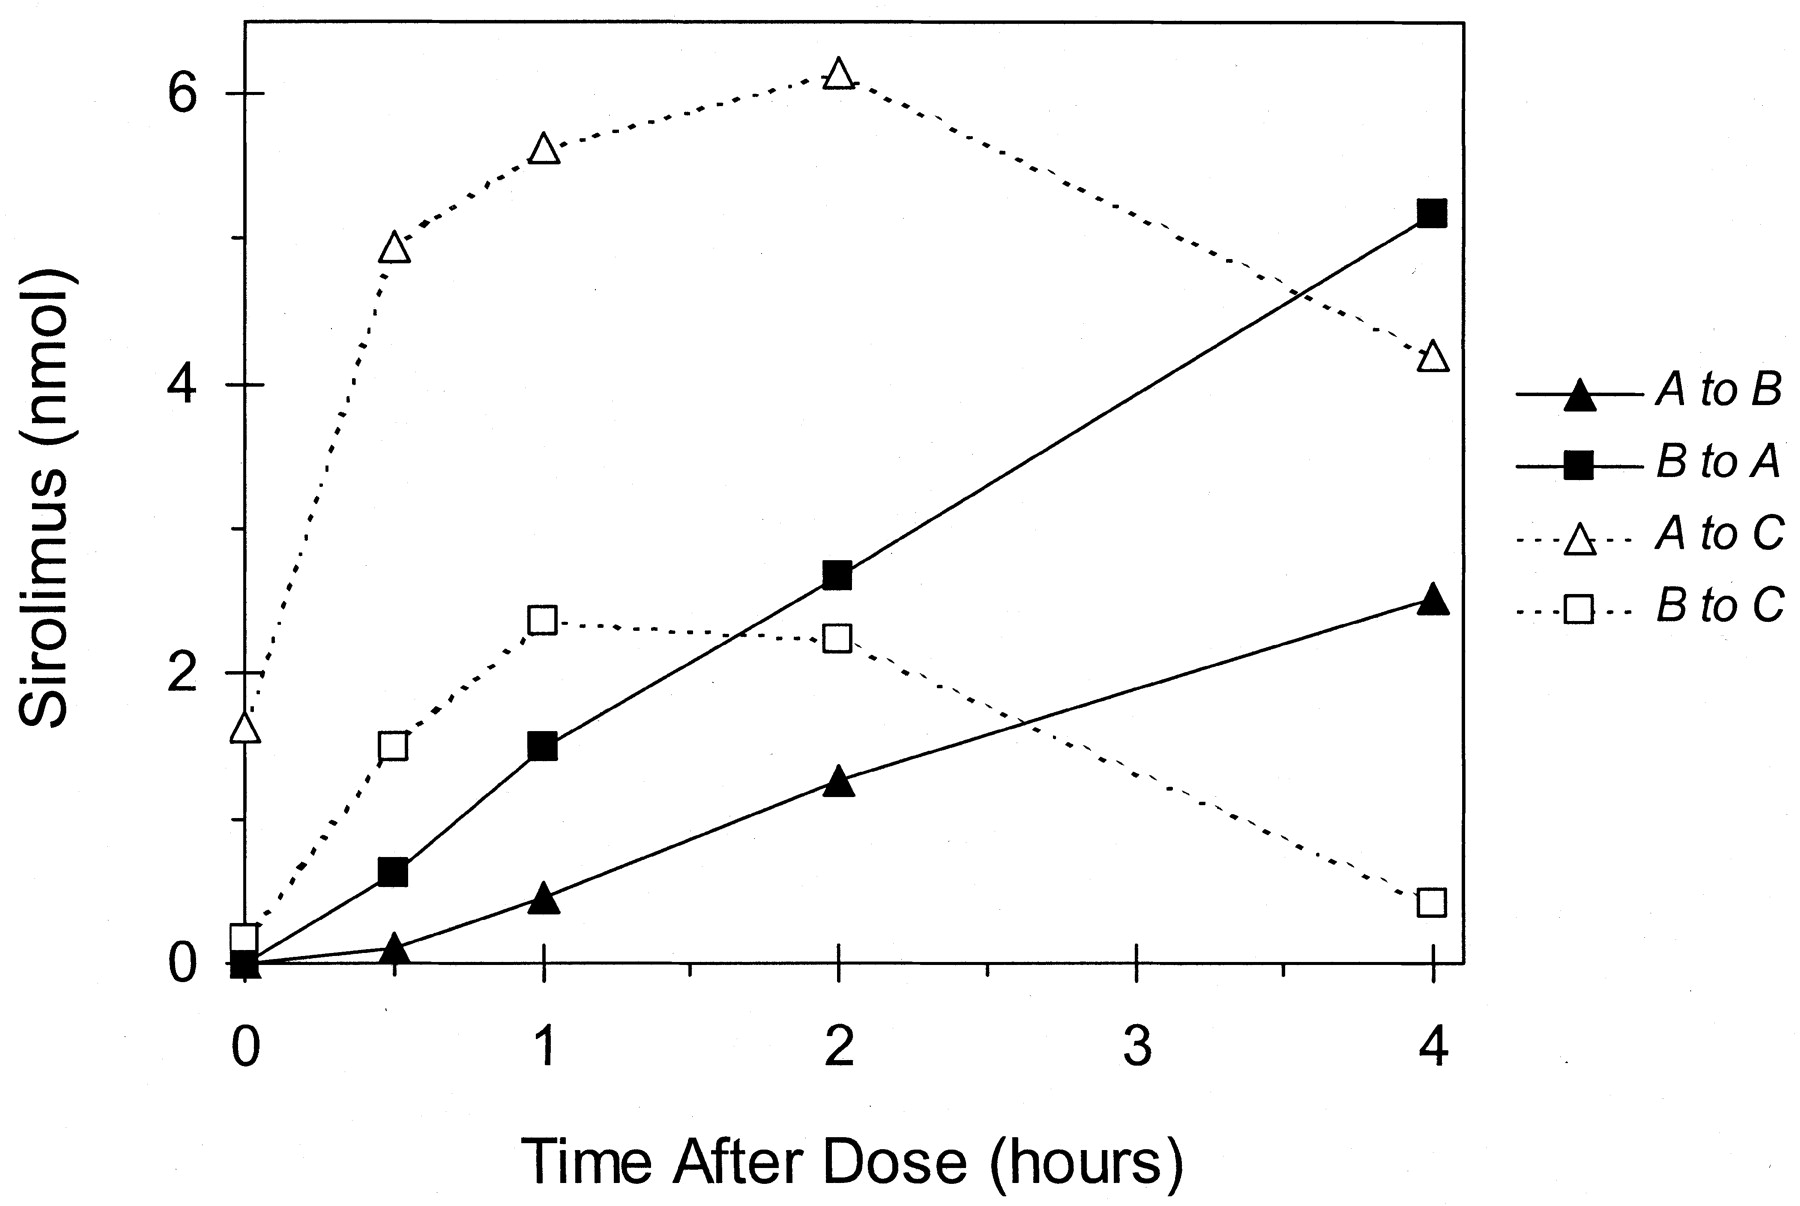
The flux of sirolimus from the basolateral-to-apical (B→A) direction was always greater than that from the apical-to-basolateral (A→B) direction (Fig.3). The ratio B→A/A→B, a measure of net secretion, decreased from 5.6 at 0.5 h to 2.1 at 2 h, which remained constant to 4 h. This time-dependent decrease in net secretion was largely due the nonlinear increase in A→B flux, where it was negligible at 0.5 h and increased after 1 h; B→A flux was virtually constant throughout the time course. The amount of sirolimus in cells increased until ∼0.5 to 1 h, appeared to plateau at 1 to 2 h, and then declined thereafter (Fig. 3). The intracellular amount of sirolimus after an apical dose was always greater than that after a basolateral dose.

Time-dependent transfer of 20 μM sirolimus across modified Caco-2 cell monolayers. A to B, apical-to-basolateral transfer; B to A, basolateral-to-apical transfer; A to C, apical-to-cellular transfer; and B-to-C, basolateral-to-cellular transfer. Each point represents the mean of duplicate culture inserts.
Figure 4 shows radiochromatograms of apical, basolateral, and cell fractions at 0 and 4 h after an apical dose of sirolimus. At zero time after apical application (Fig.4A), sirolimus was the most dominant drug-related product in both apical and cell fractions, whereas D1 was present at low levels. D2 levels were also low in the apical fraction but rivaled that for sirolimus in the cell fraction. Similarly, sirolimus was the most dominant drug-related product in both basolateral and cell fractions after a basolateral dose (data not shown). At zero time, no drug-derived peaks were detected in the basolateral compartment after an apical dose (Fig. 4A) or in the apical compartment after a basolateral dose (data not shown). After 4 h of incubation following an apical (Fig. 4B) or basolateral dose (data not shown), in addition to D1, D2, and sirolimus, M1 and/or M2 were present in apical and basolateral compartments and cell fractions.

Radiochromatograms of apical, basolateral, and cell fractions at 0 (A) and 4 (B) h after apical application of 20 μM sirolimus. D1 and D2 are nonenzymatic degradation products of sirolimus. M1 and M2 are NADPH-dependent metabolites of sirolimus.
Figure 5 depicts the amount of total metabolites (sum of M1 and M2) present in apical and basolateral compartments and cell fractions after apical (Fig. 5A) or basolateral (Fig. 5B) application of 20 μM sirolimus. Regardless of the side of drug application, the apical compartment always contained the highest amount of total metabolites. Total metabolite formation was roughly linear for up to 4 h. At 4 h, the total amount of metabolite formed after a basolateral dose (1.2 nmol) was approximately two-thirds that after an apical dose (1.9 nmol).

Time-dependent formation of sirolimus metabolites (sum of M1 and M2) in modified Caco-2 cell monolayers after apical (A) or basolateral (B) application of 20 μM sirolimus. Apical, amount in apical compartment; basolateral, amount in basolateral compartment; cellular, amount in cell scrapings; and total, sum of metabolites in apical, basolateral, and cell fractions. Each point represents the mean of duplicate culture inserts.
Sirolimus Product Identification.
Reconstructed ion chromatograms (RICs) of extracts from the apical compartment after an apical dose of sirolimus are shown in Fig.6. Both sirolimus and D2 were detected in the RIC of m/z 931.6. The earlier elution of D2 relative to sirolimus was consistent with D2 being the ring-opened isomer of sirolimus (seco-rapamycin) (Wang et al., 1994; Leung et al., 1996). D1 was detected in the RIC of m/z 949.6 and was consistent with a hydrolysis ring-opened degradation product reported previously (Wang et al., 1994). M1 was detected in the RIC ofm/z 947.6 and was consistent with a hydroxy sirolimus metabolite; however, the low levels of M1 precluded further structural confirmation by LC/MS/MS analyses. M2 was detected in the RIC of m/z 933.6, corresponding to either a hydroxy-demethyl or a dihydro sirolimus metabolite. The product ion spectrum of M2 (Fig. 7) exhibited a molecular anion at m/z 914.9, which is 2 Da more than that of sirolimus, and can be explained by the loss of a methyl group and the addition of oxygen (hydroxylation) or the addition of two hydrogens (reduction) to the parent molecule. LC/MS/MS analyses provided two complimentary diagnostic ions that were useful for the localization of structural changes on the sirolimus molecule. The ion at m/z 321 contained C25 to C31 and C37 to C44 of the molecule, whereas the ion at m/z 590 contained C1 to O24 and C32 to C36 of the molecule. These ions were designated as the “northern” and “southern” fragments of sirolimus, respectively (Canton and Chan, 1992). The mass shift of the northern fragment of M2 (m/z 323) from the corresponding fragment of sirolimus (m/z 321) indicated that biotransformation occurred on the northern fragment of the parent molecule.
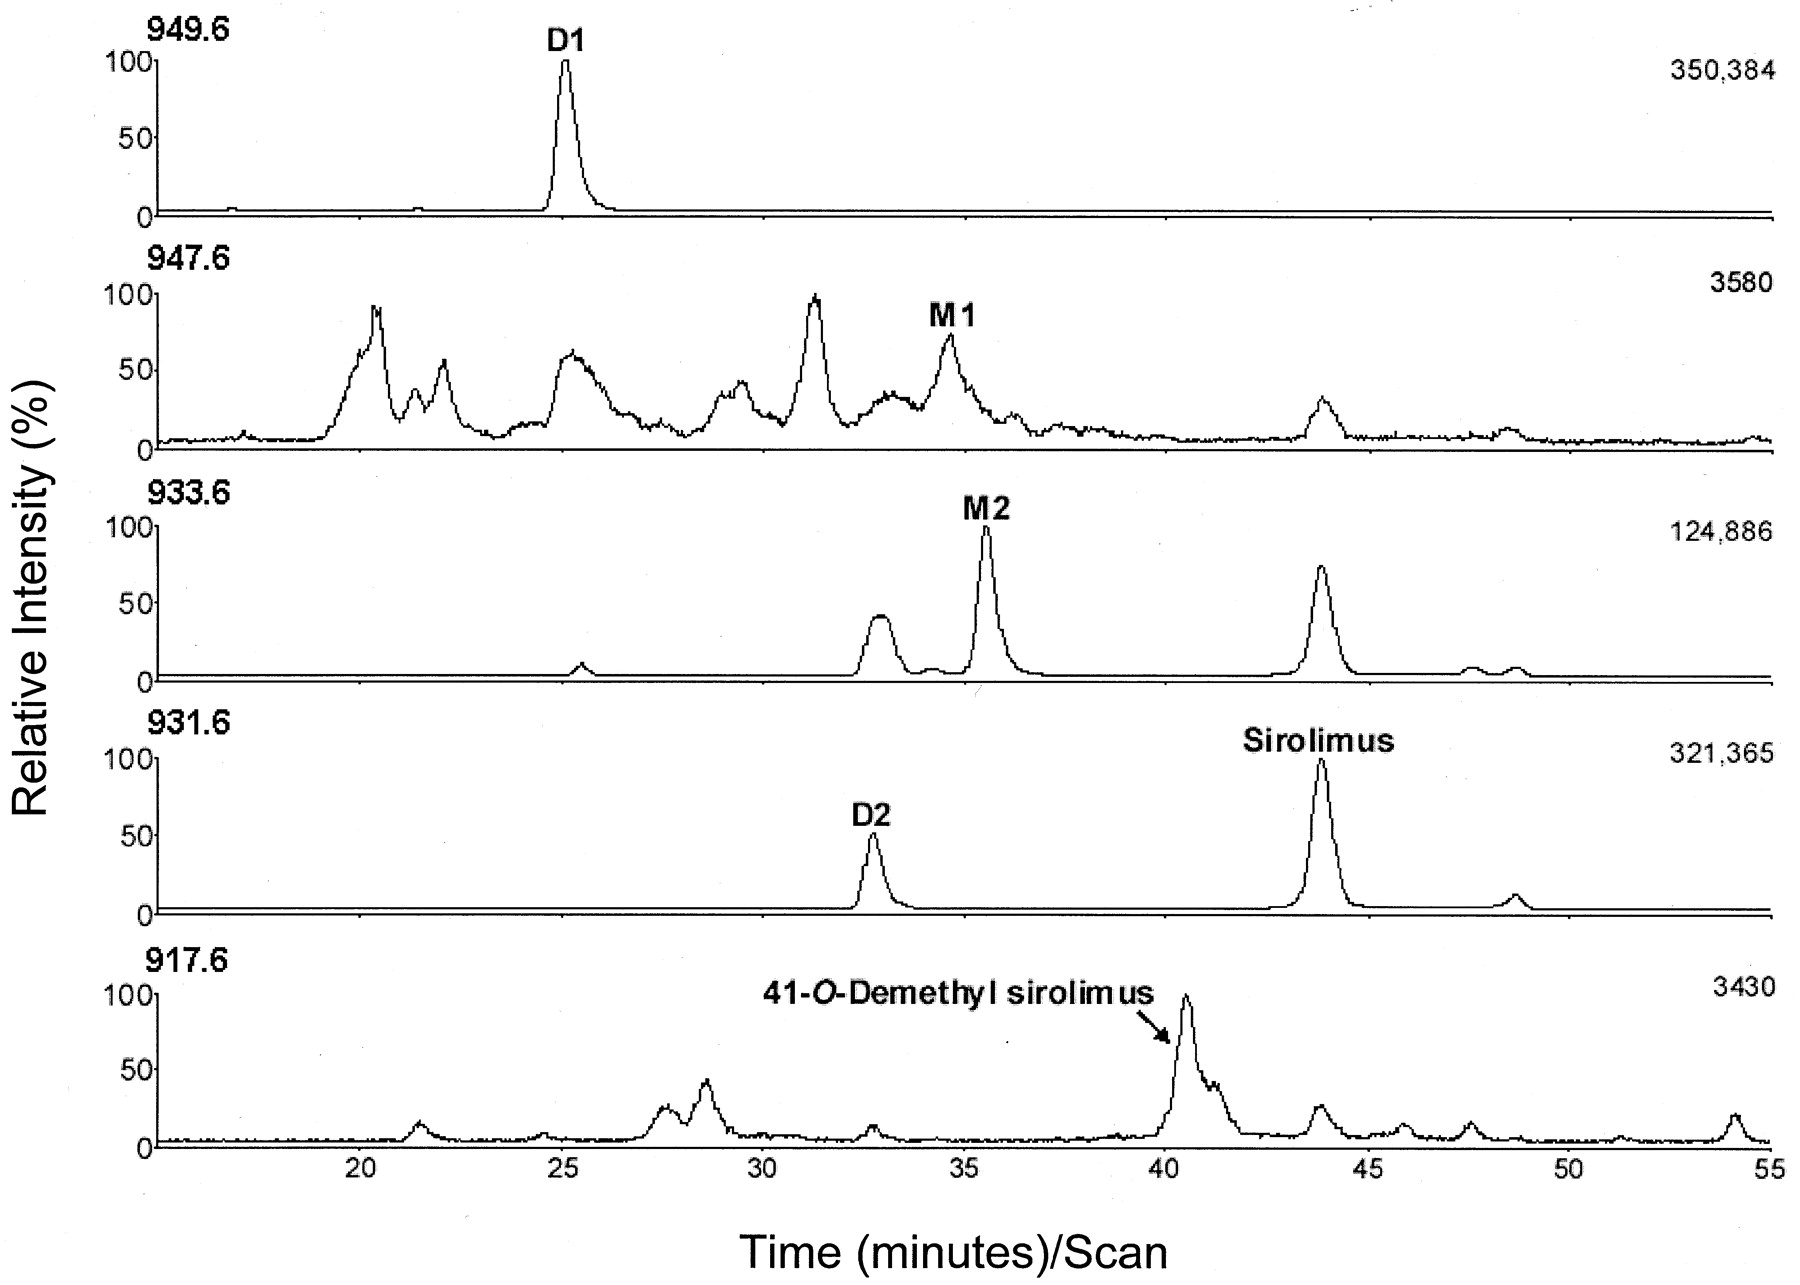
Reconstructed ion chromatograms from the LC/MS-SIM analyses of medium collected from the apical compartment of Caco-2 cell culture inserts at 4 h after apical application of 20 μM sirolimus. Displayed from top to bottom are the [M + NH4]+ ions withm/z 949.6 (sirolimus plus water), 947.6 (hydroxy sirolimus), 933.6 (hydroxy demethyl sirolimus or dihydro sirolimus), 931.6 (sirolimus and isomers), and 917.6 (demethyl sirolimus).

Product ion spectrum of dihydro sirolimus (M2) showing the molecular anion ([M − H]−) atm/z 914.9, which was 2 Da more than that of sirolimus. The fragment ion at m/z 323 was 2 Da more than the corresponding (northern) fragment of sirolimus, whereas the fragment ion at m/z 590 was the same as the corresponding (southern) fragment of sirolimus, consistent with biotransformation having occurred on the northern fragment of the parent molecule.
To further confirm the structural identification of M2, accurate mass measurements of M2 were determined by high-resolution LC/MS. The exact mass of M2 was determined to be at m/z 933.6040 and m/z 933.6074 by manual and auto peak matching, respectively. The corresponding mass deviation of M2 from dihydro sirolimus (calculated m/z 933.6052) was 1 and 2 ppm, respectively, whereas the corresponding mass deviation of M2 from hydroxy-demethyl sirolimus (calculated m/z933.5688) was 38 and 42 ppm, respectively. The close approximation of the measured mass of M2 to the calculated mass of dihydro sirolimus confirmed the proposed structure of this metabolite, where the addition of two hydrogens occurred on the northern fragment of the molecule (Fig. 8).

Scheme for the formation of seco-rapamycin (D2) from sirolimus and proposed scheme for the formation of dihydro sirolimus (M2) from seco-rapamycin.
In addition to D1, D2, M1, and M2, LC/MS SIM analyses of the apical, basolateral, and cell fractions indicated the presence of demethyl and hydroxy sirolimus that were previously shown to be CYP3A-dependent (Sattler et al., 1992). The metabolite profile of sirolimus with respect to these metabolites in modified Caco-2 cell monolayers was qualitatively very similar to those from incubations of sirolimus with human liver microsomes. Based on the RIC of m/z917.6 (Fig. 6) and LC/MS/MS analyses (data not shown), the major demethyl metabolite was characterized as 41-O-demethyl sirolimus reported previously (Sattler et al., 1992). In the RIC ofm/z 947.6 (Fig. 6), several peaks were detected as hydroxy metabolites. The full scan mass spectra of the hydroxy metabolites (data not shown) were consistent with mono-oxygenation occurring on the southern fragment of the molecule. With the exception of M1 and M2, cDNA-expressed human CYP3A4 produced a metabolite profile of sirolimus virtually identical to those from the modified Caco-2 cell monolayers or human liver microsomes.
Effects of CYP3A4 and/or P-gp Inhibitors on the Transport and Metabolism of Sirolimus.
After an apical dose, in the absence of inhibitors, total radioactivity in the basolateral compartment after 4 h was 7.6 ± 0.4% (mean ± S.D.) of the applied dose. This value was essentially unchanged (7.7%, n = 2) in the presence of troleandomycin. Similarly, the extraction fraction remained unchanged (0.48 and 0.47 for control and troleandomycin, respectively) (Table 1). LY335979 had little to no effect on total radioactivity in the basolateral compartment (8.5% of the applied dose) and on the extraction fraction (0.45). Although modest, cyclosporine significantly increased total radioactivity in the basolateral compartment to 10.9 ± 1.1% of the applied dose and significantly decreased the extraction fraction to 0.42 (Table 1). After a basolateral dose, total radioactivity in the apical compartment in the absence of inhibitors was 19.8 ± 1.2% of the applied dose. Although troleandomycin was without effect (17.5 ± 0.6%), LY335979 and cyclosporine significantly decreased total radioactivity in the apical compartment to 16.5 ± 0.2 and 15.3 ± 2.0% of the applied dose, respectively. Similarly, troleandomycin had no effect on the extraction fraction of sirolimus compared with control (0.13 and 0.12, respectively), whereas LY335979 and cyclosporine significantly increased this value to 0.20 and 0.19, respectively (Table 1). Due to the low levels of CYP3A4-dependent demethyl and hydroxy metabolites present, the effect of the inhibitors on their formation could not be unambiguously determined.
Effects of CYP3A4/P-gp inhibitors on the extraction fraction of sirolimus in modified Caco-2 cells
Table 2 summarizes the effects of the various CYP3A4/P-gp inhibitors on the apical-to-basolateral ratio of the major metabolite (M2) formed in modified Caco-2 cells. In the absence of inhibitors, M2 preferentially sorted to the apical compartment, whether sirolimus was added to apical or basolateral compartment. Moreover, this ratio was much greater after a basolateral dose (>100) compared with that after an apical dose (13.4). Similar to results with the extraction fraction of sirolimus, troleandomycin had no effect on the apical-to-basolateral ratio of M2 (11.6 and >100 after apical and basolateral dosing, respectively). In contrast, LY335979 and cyclosporine significantly decreased these ratios to 8.5 and 5.2, respectively, after apical application, and to 2.4 and 4.7 after basolateral application of sirolimus.
Effects of CYP3A4/P-gp inhibitors on the apical/basolateral ratio of M2 in modified Caco-2 cells
Shown in Fig. 9A are the effects of CYP3A4/P-gp inhibitors on the formation of 1′-hydroxymidazolam after apical application of midazolam, our positive control for CYP3A4 activity in modified Caco-2 cells. As expected, ketoconazole, troleandomycin, and cyclosporine inhibited midazolam 1′-hydroxylation relative to control, from 57% by cyclosporine to abolishment by ketoconazole at 10 μM. LY335979 had no effect on midazolam 1′-hydroxylation, consistent with its low affinity for CYP3A4 (Dantzig et al., 1999). The effects of these same inhibitors on the formation of M1 and M2 after apical application of sirolimus are depicted in Fig.9B. The lack of effect by the three CYP3A4 inhibitors on sirolimus metabolism prompted us to determine whether 1α,25-(OH)2-D3pretreatment (i.e., CYP3A4 expression) was necessary for M1 and M2 formation. Indeed, after apical application of sirolimus, there was no difference between treated and untreated Caco-2 cells with respect to total metabolite formed (1.9 versus 2.0 nmol) and the extraction fraction of sirolimus (0.52 versus 0.51).

Effects of CYP3A4/P-gp inhibitors on the total formation of 1′-hydroxymidazolam (A) and the sirolimus metabolites M1 and M2 (B) in modified Caco-2 cell monolayers after apical application of midazolam or sirolimus, respectively. Keto, ketoconazole; TAO, troleandomycin; CsA, cyclosporine; and LY, LY335979. Culture inserts were incubated with vehicle or the various inhibitors for 2 (keto) or 4 h (TAO, CsA, and LY). Each bar represents the mean of two to three determinations.
Metabolism of Sirolimus in Caco-2 Cell Homogenates and in Human Liver and Intestinal Tissues.
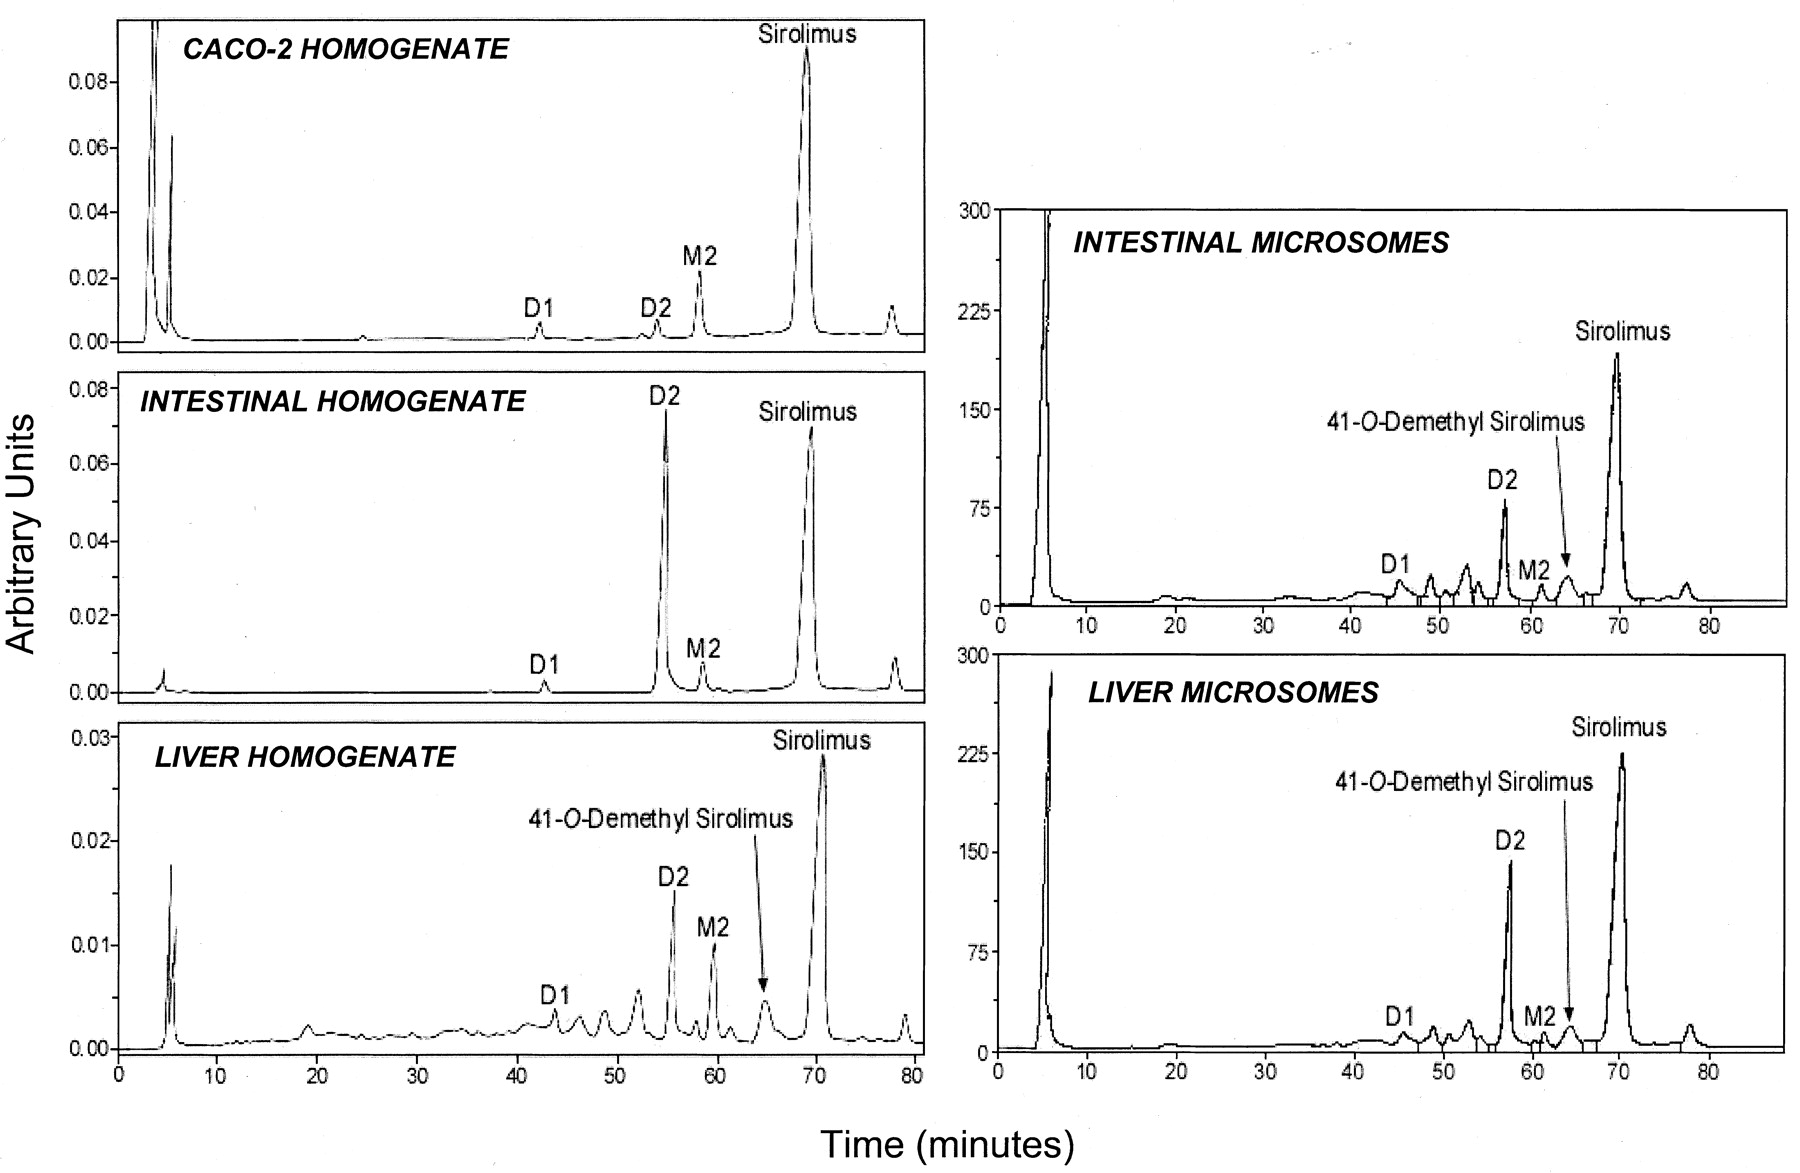
Consistent with results from intact modified Caco-2 cell monolayers [1α,25-(OH)2-D3-treated], sirolimus underwent degradation in corresponding homogenate to the hydrolysis product (D1) and seco-rapamycin (D2), and NADPH-dependent metabolism to M2 (Fig. 10). CYP3A-mediated metabolites (i.e., demethyl and hydroxy) and M1 were also detected at very low levels relative to M2 in Caco-2 cell homogenates and only by LC/MS SIM analyses (data not shown). Interestingly, as with the Caco-2 homogenate, M2 was the most dominant metabolite formed from sirolimus in intestinal mucosal and liver homogenates, whereas this metabolite was minor in incubations from microsomes from both organs (Fig. 10). Ketoconazole inhibited the formation of demethyl and hydroxy metabolites, but not M2, in liver homogenates and in the different microsomal preparations tested (data not shown). Except for Caco-2 homogenates (in agreement with results with sirolimus and for reasons that are unclear), all of the tissue preparations produced 1′-hydroxymidazolam in expected amounts (data not shown).

Chromatograms of extracts from incubations of 20 μM sirolimus with Caco-2 homogenate, human small intestinal mucosal and liver homogenate, and human small intestinal and liver microsomes. 41-O-Demethyl sirolimus is a CYP3A-mediated metabolite of sirolimus.
Disposition of Seco-Rapamycin in Human Tissue Homogenates and Caco-2 Cell Monolayers.
To determine whether seco-rapamycin (D2) can be metabolized to dihydro sirolimus (M2), 20 μM seco-rapamycin was incubated with human liver, jejunal mucosal, and Caco-2 homogenates. All of these homogenates produced M2 in an NADPH-dependent manner (data not shown). Ketoconazole, at a high concentration (100 μM), had no effect on the formation of M2 in any of the homogenates examined. To determine whether seco-rapamycin can be metabolized to M2 in intact cells, 20 μM seco-rapamycin was added to Caco-2 cell monolayers. When applied to the apical compartment, little seco-rapamycin was detected in the basolateral compartment and in the cellular fraction after 4 h (data not shown). In addition, little M2 was detected. LY335979 had little effect on the distribution of seco-rapamycin after an apical dose, although M2 became detectable in the apical compartment (data not shown). In contrast, when seco-rapamycin was applied to the basolateral compartment, both seco-rapamycin and M2 were readily detected in the apical compartment; LY335679 decreased the flux of seco-rapamycin to the apical compartment and increased the amount of M2 in both apical and basolateral compartments (data not shown).
Discussion
Like its immunosuppressant counterparts cyclosporine and tacrolimus, sirolimus exhibits a low average oral bioavailability (∼20%) that is believed to arise in part from extensive presystemic extraction occurring in the intestine and liver. Using modified Caco-2 cell monolayers expressing CYP3A4 (Schmiedlin-Ren et al., 1997), we investigated the roles of intestinal metabolism and transport on the oral bioavailability of, and in potential drug-drug interactions involving, sirolimus. As reported by others (Crowe and Lemaire, 1998), we found sirolimus to be a substrate for the secretory (efflux) transporter P-gp. In addition, modified Caco-2 cells metabolized sirolimus to CYP3A-dependent demethyl and hydroxy metabolites, identical to those produced by human liver and small intestinal microsomes, and to amounts that were consistent with the level of CYP3A4 expression. That is, the Vmaxfor the formation of 41-O-demethyl sirolimus, one of the major CYP3A-mediated metabolites detected in human liver microsomes, was ∼0.07 pmol/pmol of cytochrome P450/min (L. Y. Leung and K. Liao, unpublished data); this corresponds to a turnover number of ∼0.23 pmol/pmol of CYP3A4/min, assuming CYP3A4 represents on average 30% of total hepatic cytochrome P450 (Shimada et al., 1994). Because the modified Caco-2 cells in the present study contained on average 2.6 pmol of CYP3A4 per culture insert, the maximum amount of 41-O-demethyl sirolimus that could be formed was estimated to be 150 pmol (approximately 160 ng) per insert during a 4-h incubation period, assuming linearity of product formation. Because 1) the concentration of sirolimus added to the Caco-2 cell monolayers approximated the Km determined in human liver microsomes (∼20 μM; L. Y. Leung and K. Liao, unpublished results); and 2) sirolimus appeared to quickly degrade in the cells to D1 and D2, it is likely that the effective concentration of sirolimus at the enzyme active site was below theKm. Given these considerations, it is not surprising that 41-O-demethyl sirolimus levels were below the limit of quantification by HPLC with radiochemical detection (40 ng).
Unexpectedly, dihydro sirolimus (M2) was the major metabolite formed in modified Caco-2 cells over the range of concentrations examined (2–100 μM). M2 was initially thought to be a CYP3A4-dependent hydroxy-demethyl metabolite based on its molecular weight determined by LC/MS and LC/MS/MS analyses, which showed that M2 contained 2 Da more than that of sirolimus. However, the lack of effect of CYP3A4 inhibitors on M2 formation prompted us to further investigate the structure of M2. High-resolution LC/MS/MS analyses clearly indicated that M2 contained two hydrogens more than that of sirolimus and was consistent with a dihydro metabolite (Fig. 8). A ring-opened sirolimus metabolite, possibly identical to M2 characterized in this study, was recently reported as a minor metabolite in incubations of sirolimus with human liver microsomes (Hallensleben et al., 2000). We also found M2 to be a minor metabolite in human liver (and intestinal) microsomes, but it was the dominant metabolite produced by human liver and intestinal mucosal homogenates and in Caco-2 cell homogenates (Fig.10). These results suggest that a cytosolic enzyme (or enzymes) catalyze(s) the formation of M2, most likely via a reductive process.
Because both seco-rapamycin and possibly M2 are ring-opened species, we evaluated whether M2 can be formed from seco-rapamycin. Indeed, seco-rapamycin was metabolized primarily to M2 in the three different homogenates in an NADPH-dependent manner. Preliminary studies showed that reductive enzymes such as alcohol dehydrogenase, aldehyde oxidase, xanthine oxidase, and tetrahydrofolate reductase did not catalyze the formation of M2 from seco-rapamycin (L. Y. Leung and A. Oganesian, unpublished data). The identity of the cytosolic enzyme(s) responsible for M2 formation therefore awaits further investigation.
Degradation of [14C]sirolimus to seco-rapamycin appeared to require the presence of Caco-2 cell monolayers, because there was no time-dependent increase in the formation of this product when the dosing solution was maintained at 37°C for 4 h in the absence of cells. Moreover, seco-rapamycin was essentially impermeable to the apical membrane when added to the apical compartment of the cell monolayers. The small effect of LY335979 on apical membrane permeability indicates factors other than P-gp, perhaps other transporters, are responsible for the lack of absorption of seco-rapamycin. Nonetheless, seco-rapamycin was rapidly transported from the B→A direction, and P-gp inhibition markedly reduced this flux, suggesting that seco-rapamycin is P-gp substrate. Regardless of the mechanism, the impermeability of the apical membrane to apically dosed seco-rapamycin implies that the formation of M2 would first require sirolimus to enter the cell and then degrade to seco-rapamycin. Whether M2 is formed in human subjects, however, remains to be assessed. In whole blood of renal graft recipients (Leung et al., 1996) and healthy volunteers (Leung et al., 1997) given sirolimus, a metabolite (with a molecular weight 2 Da more than that of sirolimus) was tentatively characterized by LC/MS-SIM analyses as hydroxy-demethyl sirolimus. It is possible that this metabolite could instead be M2 (both having the same m/z by LC/MS SIM). Little seco-rapamycin was detected in whole blood of human subjects after sirolimus administration (Leung et al., 1996, 1997), presumably due to the protection of sirolimus from degradation by its distribution into erythrocytes (Yatscoff et al., 1995; Ferron and Jusko, 1998). However, seco-rapamycin could still be formed in vivo within enterocytes or hepatocytes upon the first passage of sirolimus across the respective eliminating organs. Because seco-rapamycin appears to be a substrate at least for P-gp, its secretion into the intestinal lumen or bile would be anticipated, thus minimizing its appearance in blood.
Like sirolimus and seco-rapamycin, M2 was found to be a substrate for an apically located efflux mechanism in modified Caco-2 cells, because M2 preferentially sorted to the apical compartment (Table 2). Likewise,Lampen et al. (1998) found that when sirolimus was added to the mucosal (luminal) side of pig duodenum, >99% of the metabolites were detected on the mucosal side. Apical (luminal) sorting was also reported for cyclosporine metabolite(s) in rat jejunum (Kolars et al., 1992b) and in Caco-2 cells (Gan et al., 1996), and for the major indinavir metabolites in Caco-2 cells (Hochman et al., 2000, 2001). The marked inhibition of sorting by cyclosporine and LY335979 in the current study supports the involvement of P-gp, as was previously postulated (Lampen et al., 1998). To our knowledge, M2 represents the first intracellularly generated non-CYP3A-mediated metabolite shown to be a substrate for P-gp. Secretion of this metabolite into the intestinal lumen (and possibly bile) may further account for why this metabolite has not been reported in human blood after oral administration of sirolimus.
Over a 4-h incubation, the total amount of metabolite (M1 + M2) formed in modified Caco-2 cells was 1.6-fold higher after an apical dose compared with a basolateral dose of 20 μM sirolimus (Fig. 5). A greater extent of metabolism after apical dosing was also reported for cyclosporine (∼2.7-fold) (Gan et al., 1996). These authors proposed this resulted from increased “residence time” of parent drug due to the location of P-gp in the apical membrane. Others have hypothesized that P-gp “recycles” parent drug in and out of cells across the apical membrane, thereby increasing exposure of parent drug to the enzyme (Wacher et al., 1998). Measurements of cellular amounts of parent drug in the current study provide a simpler explanation. With apical dosing, the intracellular content of sirolimus was higher than with basolateral dosing (Fig. 3). This presumably reflected saturation of P-gp with apical dosing, rendering P-gp ineffective in secreting sirolimus from inside the cell. With basolateral dosing, saturating concentrations at the apical membrane were not achieved, and effective secretion of sirolimus led to lower intracellular concentrations. Because metabolism was not saturated at the concentration of sirolimus used in our studies (Fig. 2), the higher intracellular levels achieved with apical dosing are sufficient explanation for the increased extent of metabolism.
In clinical studies, ketoconazole significantly increased both the area under the blood concentration-time curve and maximum blood concentration (Cmax) of sirolimus compared with control (10.9- and 4.3-fold, respectively) (Rapamune product information; Wyeth-Ayerst). This interaction could be due to an inhibitory effect of ketoconazole on CYP3A4 and/or P-gp. Results from the current study using modified Caco-2 cells and intestinal homogenates suggest that CYP3A4-mediated biotransformation may represent a relatively minor pathway for the intestinal extraction of sirolimus. Selective inhibition of intestinal CYP3A4 may therefore contribute minimally in improving the oral bioavailability of sirolimus. Collectively, these observations imply that the increase in sirolimus blood exposure during ketoconazole administration is more likely due to the inhibitory effect of ketoconazole on intestinal P-gp and hepatic CYP3A4.
In summary, by using Caco-2 cell monolayers expressing CYP3A4, the immunosuppressant sirolimus was shown to undergo saturable efflux by P-gp, metabolism to demethyl and hydroxy sirolimus by CYP3A4, and nonenzymatic conversion to seco-rapamycin, which then underwent metabolism to M2. Along with CYP3A4-mediated metabolism and P-gp-mediated secretion of sirolimus that were reported previously, we conclude that the following novel pathway, which occurs at least in the intestine, may contribute significantly to the first-pass extraction of sirolimus in humans: intracellular degradation of sirolimus to seco-rapamycin, metabolism of seco-rapamycin to M2 by an unidentified nonmicrosomal enzyme, and P-gp-mediated secretion of M2 and seco-rapamycin (Fig. 11). It is imperative to note that traditional drug metabolism screening methods, which rely primarily on microsomes and recombinant microsomal enzymes, would have missed (and did miss) this potentially important pathway. Because the initial degradation step is likely to be rate-limiting in this pathway, strategies aimed at improving sirolimus oral bioavailability by inhibiting seco-rapamycin or M2 transport, or by inhibiting M2 production, would probably be unsuccessful. Nonetheless, a prominent role for intestinal P-gp in the disposition of sirolimus suggests P-gp represents a major locus for improving sirolimus oral bioavailability and for potential sirolimus-drug interactions.

Scheme depicting the proposed novel pathway for sirolimus extraction in the human enterocyte after oral administration of sirolimus. SECO, seco-rapamycin.
Acknowledgments
We thank Justina Calamia (Department of Pharmaceutics, University of Washington, Seattle, WA) for the GC/MS analysis of 1′-hydroxymidazolam and Anne Criss (General Clinical Research Center, University of North Carolina, Chapel Hill, NC) for excellent technical assistance with the human homogenate and microsomal incubations.
Footnotes
-
↵1 Present address: Aventis Pharmaceuticals, ADME/DMPK, Bridgewater, NJ 08807-0800.
-
This work was supported in part by a National Research Service Award from the National Institute of General Medical Sciences, GM19034 (to M.F.P.) and by National Institutes of Health Grant GM38149 (to P.B.W.), and was presented at the International Society for the Study of Xenobiotics Sixth International Meeting, Munich, Germany, 2001 October 7–11.
- Abbreviations:
- P-gp
- P-glycoprotein
- 1α,25-(OH)2-D3
- 1α,25-dihydroxy vitamin D3
- DMEM
- Dulbecco's modified Eagle's medium
- NEAA
- nonessential amino acids
- FBS
- fetal bovine serum
- HPLC
- high-pressure liquid chromatography
- LC
- liquid chromatography
- MS
- mass spectrometry
- DMSO
- dimethyl sulfoxide
- ESI
- electrospray ionization
- SIM
- selective ion monitoring
- RIC
- reconstructed ion chromatogram
- LY335979
- (2R)-anti-5-{3-[4-(10,11-difluoromethanodibenzo-suber-5-yl)piperazin-1-yl]-2-hydroxypropoxy}quinoline trihydrochloride
- Received September 27, 2001.
- Accepted December 20, 2001.
- The American Society for Pharmacology and Experimental Therapeutics


