


Abstract
Effective treatments for primary brain tumors and brain metastases represent a major unmet medical need. Targeting the CDK4/CDK6-cyclin D1-Rb-p16/ink4a pathway using a potent CDK4 and CDK6 kinase inhibitor has potential for treating primary central nervous system tumors such as glioblastoma and some peripheral tumors with high incidence of brain metastases. We compared central nervous system exposures of two orally bioavailable CDK4 and CDK6 inhibitors: abemaciclib, which is currently in advanced clinical development, and palbociclib (IBRANCE; Pfizer), which was recently approved by the U.S. Food and Drug Administration. Abemaciclib antitumor activity was assessed in subcutaneous and orthotopic glioma models alone and in combination with standard of care temozolomide (TMZ). Both inhibitors were substrates for xenobiotic efflux transporters P-glycoprotein and breast cancer resistant protein expressed at the blood–brain barrier. Brain Kp,uu values were less than 0.2 after an equimolar intravenous dose indicative of active efflux but were approximately 10-fold greater for abemaciclib than palbociclib. Kp,uu increased 2.8- and 21-fold, respectively, when similarly dosed in P-gp–deficient mice. Abemaciclib had brain area under the curve (0–24 hours) Kp,uu values of 0.03 in mice and 0.11 in rats after a 30 mg/kg p.o. dose. Orally dosed abemaciclib significantly increased survival in a rat orthotopic U87MG xenograft model compared with vehicle-treated animals, and efficacy coincided with a dose-dependent increase in unbound plasma and brain exposures in excess of the CDK4 and CDK6 Ki values. Abemaciclib increased survival time of intracranial U87MG tumor-bearing rats similar to TMZ, and the combination of abemaciclib and TMZ was additive or greater than additive. These data show that abemaciclib crosses the blood–brain barrier and confirm that both CDK4 and CDK6 inhibitors reach unbound brain levels in rodents that are expected to produce enzyme inhibition; however, abemaciclib brain levels are reached more efficiently at presumably lower doses than palbociclib and are potentially on target for a longer period of time.
Introduction
Effective treatments for primary brain tumors and brain metastases represent a major unmet medical need. Glioblastoma is the most common primary brain tumor; despite improvements in detection and treatment, the 5-year survival for patients with glioblastoma is less than 3% (Ohgaki and Kleihues, 2005). Brain metastases occur in approximately 20%–40% of all cancer patients, and the incidence is expected to increase with improved therapy of primary tumors (Patchell, 2003; Steeg et al., 2011). More than 100,000 patients per year die with symptomatic intracranial metastases in the United States, and the estimated number of new cases of brain metastases diagnosed in the United States is 170,000 per year (Langer and Mehta, 2005; Motl et al., 2006). Brain metastases can develop from a variety of different primary tumors, but the frequency is highest for lung, breast, and melanoma cancers (Patchell, 2003; Siena et al., 2010). Metastatic brain tumors are the most common type of brain tumor, with an annual 4-fold greater incidence compared with primary brain tumors (Chamberlain, 2010).
The cell cycle is the process by which mammalian cells regulate proliferation (Malumbres and Barbacid, 2001). The G1 restriction point was originally described by Pardee (1974) as the point where cell proliferation becomes independent of mitogens and growth factors, and the normal function of the restriction point is essential for maintaining control of cellular proliferation (Blagosklonny and Pardee, 2002; Ortega et al., 2002). The restriction point is controlled by the retinoblastoma pathway (CDK4/CDK6-cyclin D1-Rb-p16/ink4a). The retinoblastoma protein (Rb) is a tumor suppressor that inhibits proliferation through binding to and suppressing the activity of the E2F family of transcription factors (Dyson, 1998), and the restriction point is controlled by phosphorylation of Rb by the CDK4 and CDK6 kinases (Lundberg and Weinberg, 1998; Blagosklonny and Pardee, 2002). The central role of the Rb pathway in controlling cellular proliferation is highlighted by its frequent dysregulation in human cancer, including glioblastoma and tumors with a high incidence of brain metastases. Genomic analysis has shown that the Rb pathway is dysregulated in approximately 78% of glioblastoma (Cancer Genome Atlas Research Network, 2008), including amplification of CDK4 and deletion of p16/ink4a (Schmidt et al., 1994; Reifenberger et al., 1995). A central role of this pathway has also been established in other tumors with a high incidence of brain metastases, such as breast cancer, including HER2-positive breast cancer (Landis et al., 2006; Malumbres and Barbacid, 2006; Yu et al., 2006; Lin et al., 2008), lung cancer (Eichler and Loeffler, 2007), and melanoma (Flaherty and Fisher, 2011). The approval of palbociclib (IBRANCE; Pfizer) by the U.S. Food and Drug Administration in 2015 as a first-in-class selective dual inhibitor of CDK4 and CDK6 highlights the importance of this pathway for therapeutic intervention in cancer.
The current standard of care for the treatment of brain tumors and metastases includes radiotherapy, surgery, and chemotherapy, but the prognosis for patients is still poor (Eichler and Loeffler, 2007). Delivery of antitumor drugs to primary and metastatic cancers in the central nervous system (CNS) continues to challenge clinical oncologists. This can be attributed to the blood–brain barrier (BBB) in normal tissue as well as unique features of the blood–tumor barrier (BTB). The BBB physically restricts passive diffusion by many oncolytics, and expression of ATP-binding cassette (ABC) efflux transporters at the BBB further limits many anticancer drugs from efficiently reaching brain tumors at a concentration required for efficacy (Deeken and Löscher, 2007). P-glycoprotein (P-gp; ABCB1 or MDR1) and breast cancer resistance protein (BCRP; ABCG2) are two efflux transporters with substrate promiscuity sometimes toward transport of the same drug molecule (Sharom, 2008; Chu et al., 2013). Numerous studies have shown that P-gp and BCRP work together at the BBB to restrict brain penetration of drugs (Kodaira et al., 2010; Agarwal et al., 2011a). Although the BBB in brain tumors, or the BTB, can be physically leakier to diffusion of an anticancer drug, this mostly increases drug levels in the tumor core and not at the leading margin, or rim region, of a tumor that is advancing into surrounding normal brain tissue (Lee et al., 2009; Agarwal et al., 2011b). Consequently, recent literature emphasizes the need for new chemotherapy agents that can cross the BBB to allow for improved and durable clinical responses.
The objectives of the studies presented here were to compare CNS exposure of two CDK4 and CDK6 inhibitors either currently in advanced clinical development (abemaciclib) or approved by the U.S. Food and Drug Administration (palbociclib), and to assess the antitumor activity of abemaciclib in subcutaneous and orthotopic glioma models alone and in combination with temozolomide (TMZ).
Materials and Methods
Chemicals and Reagents
Abemaciclib ([5-(4-ethyl-piperazin-1-ylmethyl)-pyridin-2-yl]-[5-fluoro-4-(7-fluoro-3-isopropyl-2-methyl-3H-benzoimidazol-5-yl)-pyrimidin-2-yl]-amine) and palbociclib ([6-acetyl-8-cyclopentyl-5-methyl-2-[[5-(1-piperazinyl)-2-pyridinyl]amino]pyrido[2,3-d]pyrimidin-7(8H)-one]) were synthesized and characterized for purity and identity at Lilly Research laboratories (Indianapolis, IN). Data for abemaciclib and palbociclib described herein were obtained using the methanesulfonate salt of each compound (Table 1). TMZ (CAS no. 85622-93-1) and LSN335894 [(R)-4-[(1a,6,10b)-1,1-dichloro-1,1a,6,10b-tetrahydrodibenzo[a,e]cyclopropa[c]cyclohepten-6-yl]-[(5-quinolinyloxy)methyl]-1-piperazineethanol] were obtained from the Lilly Compound Collection. LSN335984 is structurally related to the P-gp–specific inhibitor LY335979 or zosuquidar [(R)-4-[(1a,6,10b)-1,1-difluoro-1,1a,6,10b-tetrahydrodibenzo[a,e]cyclopropa[c]cyclohepten-6-yl]-[(5-quinolinyloxy)methyl]-1-piperazineethanol] (Dantzig et al., 1999). Dimethylsulfoxide (DMSO; 99.7%), 1,2-propanediol, and tetrahydrofuran were purchased from Acros Organics (Thermo Fisher Scientific, Waltham, MA). UV-grade methanol and acetonitrile were from Honeywell Burdick and Jackson (Muskegon, MI). All other reagents or materials used herein were purchased from Sigma-Aldrich (St. Louis, MO), excluding all cell culture products, which were from Invitrogen Life Technologies (Carlsbad, CA) unless otherwise stated.
Physicochemical properties of abemaciclib and palbociclib
In Vitro Studies
Efflux Transporter Substrate Assays.
Madin-Darby canine kidney (MDCK) cells expressing either human MDR1 (or ABCB1) or mouse bcrp1 (or abcg2) were obtained at passage number 12 from Dr. Piet Borst (The Netherlands Cancer Institute, Amsterdam, The Netherlands). Details of the assay, including calculation of apparent permeability coefficients (Papps), are described by Desai et al. (2013). For specific inhibition of P-gp, LSN335984 (IC50 = 0.4 µM) was used at 2.5 μM (Tombline et al., 2008). For specific inhibition of bcrp, Chrysin (IC50 = 2.5 µM) was used at 20 μM (Zhang et al., 2004). Cell monolayers were rinsed and extracted with methanol to achieve mass balance and to measure a buffer/cell distribution defined as the percent of mass that was added to the donor and recovered in the methanol rinse of the cells (%cell). Quantification of test compound was done using liquid chromatography–tandem mass spectrometry (LC-MS/MS).
Efflux Transporter Inhibition Assays.
MDCK-MDR1 or MDCK-bcrp cells were plated at a density of 40,000 cells/well in 96-well, flat-bottom cell culture plates in a growth medium volume of 200 μl, which was replaced on day 3. On day 4, cells were washed once with phosphate-buffered saline containing 10 mM 4-(2-hydroxyethyl)-1-piperazineethanesulfonic acid (HEPES) buffer at pH 7.4 (PBSH) and incubated with test compound in PBSH at 37°C under room atmosphere. For the two-dose inhibition screen, cells were washed once with PBSH and preincubated with 80 μl of 5 μM or 25 μM test compound, or a range of concentrations to determine an IC50 value, in PBSH at 37°C for 30 minutes. Incubation solutions were then changed to include 0.5 μg/ml Calcein-AM (Invitrogen Life Technologies), a P-gp substrate, or 1 μM BODIPY-prazosin (Invitrogen Life Technologies), a bcrp substrate (Robey et al., 2003), and were incubated for another 20 minutes. Intracellular fluorescence was measured on a CytoFluor series 4000 multiwell plate reader (PerSeptive Biosystems, Framingham, MA) with λex and λem set to 485 and 530 nm for calcein and for BODIPY-prazosin. Percent inhibition was determined for each test compound by comparing relative fluorescence units (RFUs) to that of cells inhibited 100% with either 2.5 μM LSN335984 for P-gp or 20 μM chrysin for bcrp. IC50 values were calculated using GraphPad Prism software (version 4.03; GraphPad Software, Inc., La Jolla, CA). Briefly, the compound concentration was plotted as the log micromolar concentration versus RFUs, and a nonlinear dose-response analysis was applied without any special weighting (i.e., assume constant variance) or constraints on the parameter estimates.
Determination of Plasma Protein and Brain Binding
The extent of protein binding was determined in vitro by equilibrium dialysis using an HTDialysis 96-well, 150-μl half-cell capacity, teflon equilibrium dialysis plate and cellulose membranes (molecular mass cutoff of 12–14 kDa) (HTDialysis LLC, Gales Ferry, CT) as described elsewhere (Zamek-Gliszczynski et al., 2012). Either plasma with K2EDTA as the anticoagulant (Lampire Biologic Laboratories, Pipersville, PA), adjusted to pH 7.4 with phosphoric acid immediately prior to use, or mouse or rat brain homogenate was used. Brain homogenate was prepared in 100 mM phosphate buffer (1:3 w/v; pH 7.4) by probe sonication. Matrices were spiked with DMSO stock solutions of test compounds to give final concentrations of 0.1% DMSO and 1 μM compound. Initial plasma and brain homogenate concentrations were determined by LC-MS/MS as described below. Compound-spiked brain homogenate or plasma was placed into the donor chambers of the dialysis plate (100 μl per half-well), and an equal volume of phosphate buffer (100 mM, pH 7.4) was placed in each corresponding receiver well (n = 3 per compound per matrix). The dialysis plate was sealed with the kit adhesive and dialysis was conducted on an orbital shaker (175 rpm) at 37°C for 4.5 hours. After incubation, donor and receiver chamber compound concentrations were determined by LC-MS/MS. Brain homogenate, plasma, and dialysate samples were prepared for bioanalysis by methanol protein precipitation. Fraction unbound (fu) values were calculated as the ratio of the receiver chamber (buffer) concentration and the donor chamber concentration. The brain fraction unbound data were determined by correcting the values in brain homogenate for the 3-fold dilution of brain tissue with phosphate buffer (Kalvass and Maurer, 2002). Fraction unbound data were acceptable when compound recovery was 100% ± 30%.
In Vivo Studies
All animal studies were performed in accordance with American Association for Laboratory Animal Care institutional guidelines, and all protocols were approved by the Eli Lilly and Company or Covance Laboratories Animal Care and Use Committee.
Mouse and Rat Brain Uptake Assay.
Male CF-1 (normal) or mdr1a(−/−)–deficient CF-1 mice, also known as P-gp knockout (KO) mice, were obtained from Charles River Laboratories (Germantown, MD). A simplified, calibrated mouse brain uptake assay (MBUA) has been described in detail elsewhere (Raub et al., 2006). Mice were acclimated for 1 week prior to use at 23 ± 1 g body weight. Nonfasted mice were dosed intravenously by tail vein injection with 50-μl injectate containing 55 nmol (2.2 μmol/kg) test compound in 8:2 (wt/wt) 1,2-propanediol/DMSO. Alternatively, Sprague-Dawley rats were dosed intravenously with vehicle or vehicle containing 30 mg/kg LSN335984 1 hour before dosing with test compound as described. At 5 and 60 minutes postinjection, plasma samples from cardiac blood collected in tubes containing K2EDTA as the anticoagulant, and excised cerebral hemispheres were immediately frozen and stored at −80°C until bioanalysis. Samples were thawed with 2:1 (v/v for plasma or v/wt for brain) addition of 1:9 (v/v) tetrahydrofuran/acetonitrile and brain samples were homogenized using a Model 100 Sonic Dismembrator (Fisher Scientific, Pittsburgh, PA) prior to removal of precipitated proteins by centrifugation and injection of 1 μl supernatant onto the column. Brain concentrations were corrected for an average measured plasma volume of 16 μl/g brain tissue (Raub et al., 2006).
Pharmacokinetic Studies in Rodents.
Three female Sprague-Dawley rats or 12 female CD-1 mice (Charles River Laboratories, Hollister, CA) were given either a bolus i.v. dose in 10% (v/v) N-methylpyrrolidone and 18% (v/v) sulfobutyl-7-β-cyclodextrin in 22.5 mM phosphate buffer at pH 3 or a p.o. dose in 1% (w/v) hydroxyethylcellulose, 0.25% (v/v) polysorbate 80, and 0.05% (v/v) antifoam in purified water. For the p.o. dose, a portion (approximately 20%) of the vehicle was added to the compound and stirred to wet, followed by the remainder of the vehicle. The suspension was probe sonicated on an ice bath to reduce particle size. In mice, blood samples were obtained by retro-orbital bleed or terminal cardiac puncture while the animals were anesthetized with isoflurane. For pharmacokinetic studies in rats, blood samples (0.15 ml) were withdrawn via an indwelling femoral arterial cannula in rats. In studies in which brain samples were collected, blood was collected by terminal cardiac puncture while animals were anesthetized with isoflurane. Blood samples were collected at the indicated times in tubes containing K2EDTA as the anticoagulant. Samples were centrifuged within 1 hour of collection and plasma was collected and stored at −80°C until analysis. Total concentrations of the compound were determined by LC-MS/MS. Where brain concentration was determined, brains were collected from three different animals at each time point, rinsed with ice-cold saline, weighed, and stored at −80°C until analysis. Brain homogenate concentrations were converted to brain concentrations for the calculations of brain-to-plasma ratios.
Distribution Studies in Rats.
The distribution of abemaciclib-related radioactivity was evaluated by quantitative whole-body autoradiography. For Sprague-Dawley rats, one animal per time point was administered a single oral dose of 10 mg/kg containing 200 μCi [14C]abemaciclib. The dose was formulated in purified water containing 1 M phosphoric acid and was administered to rats as a solution. After drug administration, rats were euthanized via exsanguination under isoflurane anesthesia at 1, 2, 4, 8, 12, 24, 48, 72, 120, 168, 336, 504, and 672 hours postdose. Blood (at least 5 ml) was collected into tubes containing K2EDTA. The carcasses were immediately frozen in a hexane/dry ice bath for approximately 10 minutes. Each carcass was drained, blotted dry, placed into a bag, and stored at approximately −70°C for at least 2 hours and then stored at −20°C. The frozen carcasses were embedded in chilled carboxymethylcellulose and frozen into blocks. Prior to section collection, standards fortified with 14C radioactivity were placed into the frozen block containing the carcass and were used for monitoring the uniformity of section thickness. Appropriate sections were collected on adhesive tape at 40-μm thickness using a Leica CM 3600 cryomicrotome (Leica, Wetzlar, Germany). Sections were collected at five to eight levels of interest in the sagittal plane for analysis. The mounted sections were tightly wrapped with Mylar film and exposed on phosphor imaging screens along with fortified standards for subsequent calibration of the image. After 4 days of exposure, screens were scanned using a Strom scanner (Amersham Biosciences, Piscataway, NJ). The standard image data were analyzed using AIS software (Imaging Research Inc., St. Catharines, ON, Canada) to create a calibrated standard curve. Tissue concentrations were then interpolated from each standard curve in nanocuries per gram and then converted to nanogram equivalents per gram on the basis of the test article–specific activity. Pharmacokinetic parameters including maximum concentration (Cmax) and area under the concentration-time curve (AUC) from time 0 to the last measurable time point were calculated by using WinNonlin Professional Edition (version 5.2; Pharsight Corporation, Cary, NC).
LC-MS/MS Analysis
All compound concentrations were determined with LC-MS/MS assays developed at Lilly using precursor and product ions specific to each compound. Plasma samples and standards were deproteinated with acetonitrile/tetrahydrofuran (9:1, v/v) or acetonitrile/methanol (1:1, v/v). Brain samples were extracted with acetonitrile/tetrahydrofuran (9:1, v/v) or homogenized with methanol/water (1:4, v/v) and then mixed with acetonitrile/methanol (1:1, v/v) to precipitate proteins. Fractions of the resulting supernatants were then submitted to LC-MS/MS analysis. TMZ was measured by selected reaction monitoring (SRM) in positive ion mode [mass-to-charge ratio (m/z) transition of 195.1 > 137.9] with a Polar RP column (2 × 100 mm, 5 μm; Phenomenex, Torrance, CA) and a 10 mM ammonium acetate mobile phase eluted with a methanol gradient. Palbociclib was measured by SRM in positive ion mode (m/z transition of 448.2 > 380.2) with either an XTerra MS-C8 column (2.1 × 100 mm, 5 μm; Waters Corp, Milford, MA) or a Polar RP column (2 × 100 mm, 5 μm) and a 5 mM formic acid mobile phase eluted with a methanol gradient. Abemaciclib was measured by SRM in positive ion mode (m/z transition of 507.3 > 393.1) with either a Polar RP column (2 × 100 mm, 5 μm) and a 5 mM formic acid mobile phase eluted with a methanol gradient or a Betasil C18 Javelin column (2 × 20 mm, 5 μm; Thermo Fisher Scientific) using either a 5 mM ammonium bicarbonate mobile phase and methanol gradient or a 0.4% trifluoroacetic acid/1 mM ammonium bicarbonate mobile phase and acetonitrile gradient. All mass spectrometric detection was performed with an API 4000 (Applied Biosystems, Foster City, CA) mass spectrometer equipped with a TurboIonSpray source and tuned to achieve unit resolution (0.7 DA at 50% full width at half maximum). Data were acquired and processed with Analyst 1.4.2 (Applied Biosystems).
In Vivo Xenograft Studies
U87MG glioblastoma cells were obtained from American Type Culture Collection (Manassas, VA) and were maintained using the recommended culture conditions. Cell line authenticity was confirmed by DNA fingerprinting (IDEXX BioResearch, Columbia, MO).
For subcutaneous xenograft studies, cells were harvested and resuspended in a 1:1 mixture of serum-free media and Matrigel (BD Biosciences, San Jose, CA), and 5 × 10⁶ cells were injected subcutaneously into the rear flank of 5- to 6-week-old CD1 nu/nu female mice (Harlan Laboratories, Indianapolis, IN). Tumor volume was estimated by using the formula: volume = l × w2 × 0.536, where l and w are measured perpendicular diameters, and l is greater than or equal to w.
When the mean tumor volume was approximately 150–300 mm3, animals were randomized to treatment groups by tumor volume. Abemaciclib was formulated in 1% hydroxyethyl cellulose and 0.1% antifoam in 25 mM phosphate buffer, pH 2, and was administered orally by gavage (final volume 0.2 ml) at the indicated dose and schedule. TMZ was formulated in distilled water containing 1% carboxymethyl cellulose and 0.25% Tween-80 and was administered by intraperitoneal injection. Tumor volume and body weight were measured twice weekly. For analysis, tumor volume data were transformed to a log scale to equalize variance across time and treatment groups. The log volume data were analyzed with a two-way repeated-measures analysis of variance by time and treatment using the MIXED procedure in SAS software (version 9.2; SAS Institute, Cary, NC). The spatial power law covariance structure, SP(POW) option, was used to account for unequal longitudinal spacing of the volume measurements. Treated groups are compared with the control group at each time point.
The orthotopic xenograft studies were performed similarly as described elsewhere (Agarwal et al., 2013) with 5 × 10⁵ cells implanted. The animals were randomized to treatment groups 4 days after tumor implantation (eight animals per group). The primary outcome variable was survival. Animals were monitored daily until death or were euthanized, in consultation with the veterinary staff and in adherence with the policy on tumor implantation, if they became moribund. Data analysis was performed using JMP software (SAS Institute) and a log-rank test.
Results
Transport Studies in Transfected Cell Lines
The bidirectional transport of abemaciclib and palbociclib was assessed in MDCK cell lines overexpressing human P-gp or mouse bcrp (Tables 2 and 3). The mean apparent passive permeability coefficients (Ppass) measured in the presence of LSN335984, a specific inhibitor of P-gp, were slow (abemaciclib) and moderate (palbociclib) at 18 nm/s and 180 nm/s, respectively. However, the Ppass values for both compounds were most likely undermeasured because of their propensity to partition into the cell monolayer, as indicated by the recovery of 56% and 32%, respectively, of the total mass added and recovered in the methanol wash (e.g., %cell) (Table 2). The range of Ppass values measured in this assay was 5–700 nm/s (G. Sawada, data not shown). In the absence of P-gp inhibition, both compounds had net efflux ratios of 4.6 (abemaciclib) and 9.2 (palbociclib), indicating that both were substrates for P-gp (Table 2). Inhibition of P-gp with LSN335984 decreased the efflux ratio values to 0.8 and 1.4, respectively, as expected for loss of net efflux in this assay. Chrysin, an inhibitor of bcrp, had no effect (data not shown). The %cell for both compounds also decreased with P-gp inhibition, but only by 18% (abemaciclib) and 30% (palbociclib) due to their apparently high cell partitioning. Inhibition of P-gp activity by 5 μM of each compound, equivalent to the concentration used in the flux experiment, was measured as a percent decrease in transport of the P-gp substrate Calcein-AM relative to the LSN335984 (Table 2). Abemaciclib inhibited P-gp activity by 30% relative to 100% inhibition by LSN335984, whereas palbociclib had minimal effect at up to 25 μM.
Bidirectional flux studies using MDCK cell monolayers that overexpress human P-gp
Inhibition with 2.5 μM LSN335984. Average values are from duplicate test runs where variability is <22%.
Bidirectional flux studies using MDCK cell monolayers that overexpress mouse bcrp
Inhibition with 20 μM chrysin. Average values from duplicate test runs where variability is < 18%.
In the absence of bcrp inhibition, both compounds had net efflux ratios of 9 (abemaciclib) and 11 (palbociclib), indicating that both are substrates for bcrp in vitro (Table 3). Inhibition of bcrp with chrysin decreased the efflux ratios to 1.2 and 1.5, respectively, as expected for loss of net efflux in this assay. LSN335984, which is an inhibitor of P-gp, had no effect (data not shown). The %cell for palbociclib also decreased 82% with bcrp inhibition, but abemaciclib %cell did not change. Inhibition of bcrp activity by 5 μM of each compound, equivalent to the concentration used in the flux experiment, was measured as a percent decrease in transport of the bcrp substrate BODIPY-prazosin relative to the chrysin (Table 3). Abemaciclib and palbociclib similarly inhibited bcrp activity by 21%–29% at 5 μM relative to assumed 100% inhibition by chrysin.
Plasma Protein and Brain Tissue Binding
Binding of abemaciclib and palbociclib to plasma proteins was 95–98% and approximately 78%, respectively, for at least two animal species, but palbociclib was approximately 5-fold less bound than abemaciclib in plasma at 1 μM (Table 4). Binding to brain tissue was greater for both compounds but was approximately 2.5- to 6-fold less for palbociclib versus abemaciclib, albeit within the 3- to 4-fold variability characteristic of the assay (Table 4). These unbound fraction values were used in calculations of unbound exposures obtained for rodent pharmacokinetic and efficacy studies.
Percentage of unbound fraction in plasma and brain homogenate for three species
Data are presented as means ± S.D.
Pharmacokinetics in Mice
The unbound plasma and brain concentrations versus time profiles of abemaciclib after a single p.o. administration of 30 mg/kg to mice are presented in Fig. 1. Oral absorption was fast and the time to reach maximum brain concentration (Tmax) was 2 hours (Table 5). Abemaciclib free brain concentrations between 0.5 and 24 hours were 26-fold ± 14-fold the mean CDK4/cyclin D1 KiATP of 0.6 nM and 6-fold ± 3-fold the CDK6/cyclin D1 KiATP of 2.4 nM (Gelbert et al., 2014), suggesting that abemaciclib would be able to modulate the CDK4 and CDK6 pathway in the brain at this dose. The Kp,brain (AUC or Cmax) remained unchanged and was 0.21 ± 0.04 over 24 hours postdose. The unbound brain-to-unbound plasma concentration ratio (Kp,uu) was 0.03 ± 0.01, consistent with active efflux limiting brain exposure (Hammarlund-Udenaes et al., 2008) (Table 5).

Unbound plasma and brain exposures for abemaciclib dosed orally once in normal CD-1 mice at 30 mg/kg and samples analyzed at intervals over 24 hours. Total exposures were corrected for protein binding using the measured unbound fraction (Table 4). The data are means and standard deviations of triplicate animals. The reference concentrations are as follows: 1) P-gp EC50 of 95 nM or the mean unbound plasma concentration where 50% of the BBB P-gp is saturated (as determined in Fig. 2), 2) CDK4/cyclin D1 KiATP of 0.6 nM or the mean unbound concentration where 50% of the enzyme is inhibited in vitro (Gelbert et al., 2014), and 3) and CDK6/cyclin D1 KiATP of 2.4 nM or the mean unbound concentration where 50% of the enzyme is inhibited in vitro (Gelbert et al., 2014).
Mouse and rat pharmacokinetics for abemaciclib using a 30 mg/kg oral dose
Data are mean values from three animals.
In a separate study, abemaciclib and palbociclib were dosed intravenously (bolus) at 0.5, 2.2, 5.4, and 10.9 µmol/kg in the MBUA using normal CF-1 mice, and the 5-minute plasma and brain levels were measured. Plasma exposures for both compounds were proportional to dose (Supplemental Table 1). Likewise, brain exposures for both compounds were proportional to dose (Supplemental Table 1). However, Fig. 2 shows the nonlinear relationship between Kp,brain and plasma concentration for abemaciclib, indicative of saturation of efflux transport. Kp,brain increased from 0.37 to 2.9, compared with the Kp,brain measured in P-gp KO mice (Table 6; Supplemental Table 1). Kp,uu,brain increased from 0.04 to 0.48 (Supplemental Table 1). Apparently, the exposures of palbociclib were too low to achieve saturation at the doses used, in which Kp,brain was approximately 0.14 except for the highest dose but all were well below the Kp,brain of 2.4 in P-gp KO mice (Table 6; Supplemental Table 1). The total and unbound EC50 values for palbociclib estimated from the plot were 8.5 μM and 1.5 μM, respectively. These values are approximations given the extrapolation of the minimally defined, dose-response curve. The total and unbound EC50 values for abemaciclib were 1.8 μM and 95 nM, respectively. Thus, this suggests that abemaciclib more readily (approximately 16-fold) saturated the BBB efflux transport, resulting in greater brain exposure for abemaciclib at equivalent doses of palbociclib. We called this the BBB P-gp EC50 that assumes the unbound fraction (measured at a total concentration of 1 μM) is not changing within this range of total concentrations (up to 13 μM) and ignores that net exposure may be greater after the bolus i.v. dose (Padowski and Pollack, 2011).

Exposure-dependent increase in brain-to-plasma ratios (Kps) relative to total and unbound plasma exposure for abemaciclib and palbociclib. Wild-type CF-1 mice were dosed intravenously (bolus) at 0.5, 2.2, 5.4, and 10.9 µmol/kg and plasma and brain levels were measured at 5 minutes. Kp is plotted against total and unbound plasma concentrations (fu,abemaciclib = 0.054; fu,palbociclib = 0.23). Values are means and standard deviations of triplicate animals and are reported in Supplemental Table 1.
MBUA results for abemaciclib and palbociclib in CF-1 (normal) or CF-1 mdr1a(−/−) mice
Total concentrations in plasma and brain were measured 5 minutes after an intravenous dose of 2.2 µmol/kg. Brain concentrations were corrected for plasma volume, and unbound concentrations were calculated using the measured unbound fraction (Table 4).
Exposure in Efflux Transporter KO Mice
Abemaciclib or palbociclib were dosed intravenously (bolus) in the MBUA using male normal CF-1 or P-gp KO mice at 2.2 µmol/kg (approximately 1.2 mg/kg) (Table 6). Total brain exposure of palbociclib increased 16- to 43-fold in P-gp KO mice compared with normal mice at 5 and 60 minutes postdose (Supplemental Table 2). By contrast, abemaciclib appears to penetrate the BBB of normal mice more effectively (approximately 12-fold), despite it also being an efflux transporter substrate. Moreover, total brain exposure of abemaciclib only increased 3- to 7-fold in P-gp KO mice, implying that abemaciclib is a less efficient P-gp substrate.
Table 6 compares the unbound plasma and brain exposures in these experiments. Despite 4.2-fold greater unbound plasma levels for palbociclib in mice, abemaciclib reached approximately 3-fold greater unbound brain levels in normal mice. This is explained by the differential effect of efflux transport on each compound and the differences in unbound fractions. The Kp,brain in normal mice was 1.2 for abemaciclib and 0.1 for palbociclib, and deletion of P-gp in the KO mice resulted in similar Kp,brain values of 3.2 and 2.3, respectively. However, accounting for the unbound fractions and calculating Kp,uu,brain clearly showed that abemaciclib was approximately 17-fold more effective at equilibrating with the brain than palbociclib under these conditions and exposures after equimolar intravenous doses. There was no indication in these studies that systemic clearance of either compound is dependent on P-gp because the relative decrease in total plasma levels from 5 minutes to 60 minutes in normal versus P-gp KO mice was comparable (Supplemental Table 2). Abemaciclib had a loss of 67% ± 4% in plasma levels in normal mice and 78% ± 4% in plasma levels in P-gp KO mice. Palbociclib had a loss of 55% ± 8% in normal mice and 68% ± 5% in P-gp KO mice. By contrast, loss of both compounds from the brain was delayed by deletion of P-gp. Abemaciclib had a loss in brain levels of 53% ± 15% in normal mice and 26% ± 15% in P-gp KO mice, and palbociclib had a loss of 36% ± 4% in normal mice and 0% in P-gp KO mice, in which brain levels appeared to be increasing at 60 minutes versus 5 minutes (Supplemental Table 2). In a separate study, the plasma AUC0–8 h of abemaciclib was shown to be increased less than 2-fold after p.o. dosing 10 mg/kg in Friend Leukemia Virus, strain B (FVB) mdr1a/1b(−/−) and bcrp(−/−) KO mice (Taconic Farms, NY) compared with FVB control (data not shown); however, corresponding brain levels were not measured.
Pharmacokinetics in Rats
The unbound plasma and brain concentration versus time profiles of abemaciclib and palbociclib after a single p.o. administration of 30 mg/kg to rats are shown in Fig. 3. Oral absorption of abemaciclib was slow, with a brain Tmax of 4 hours (Table 5). Abemaciclib free brain concentrations between 2 and 48 hours were 14-fold ± 5-fold the mean CDK4/cyclin D1 KiATP of 0.6 nM and 3.5-fold ± 1.3-fold the CDK6/cyclin D1 KiATP of 2.4 nM, suggesting that abemaciclib should be able to modulate the CDK4 and CDK6 pathway in the brain at this dose. The AUC and Cmax Kp,brain values were similar and Kp,brain remained unchanged at 0.86 ± 0.14 over 48 hours postdose. Kp,uu,brain was 0.10 ± 0.02, consistent with active efflux limiting brain exposure (Table 5). Unbound plasma concentrations of abemaciclib were approximately equal to the in vivo mouse BBB P-gp EC50 of 95 nM, suggesting that P-gp might be partially saturated at 30 ml/kg p.o. On the basis of these data and increased exposures observed with increasing dose up to a p.o. dose of 100 mg/kg, abemaciclib was dosed at 20, 40, and 80 mg/kg for the intracranial xenograft experiments discussed below.
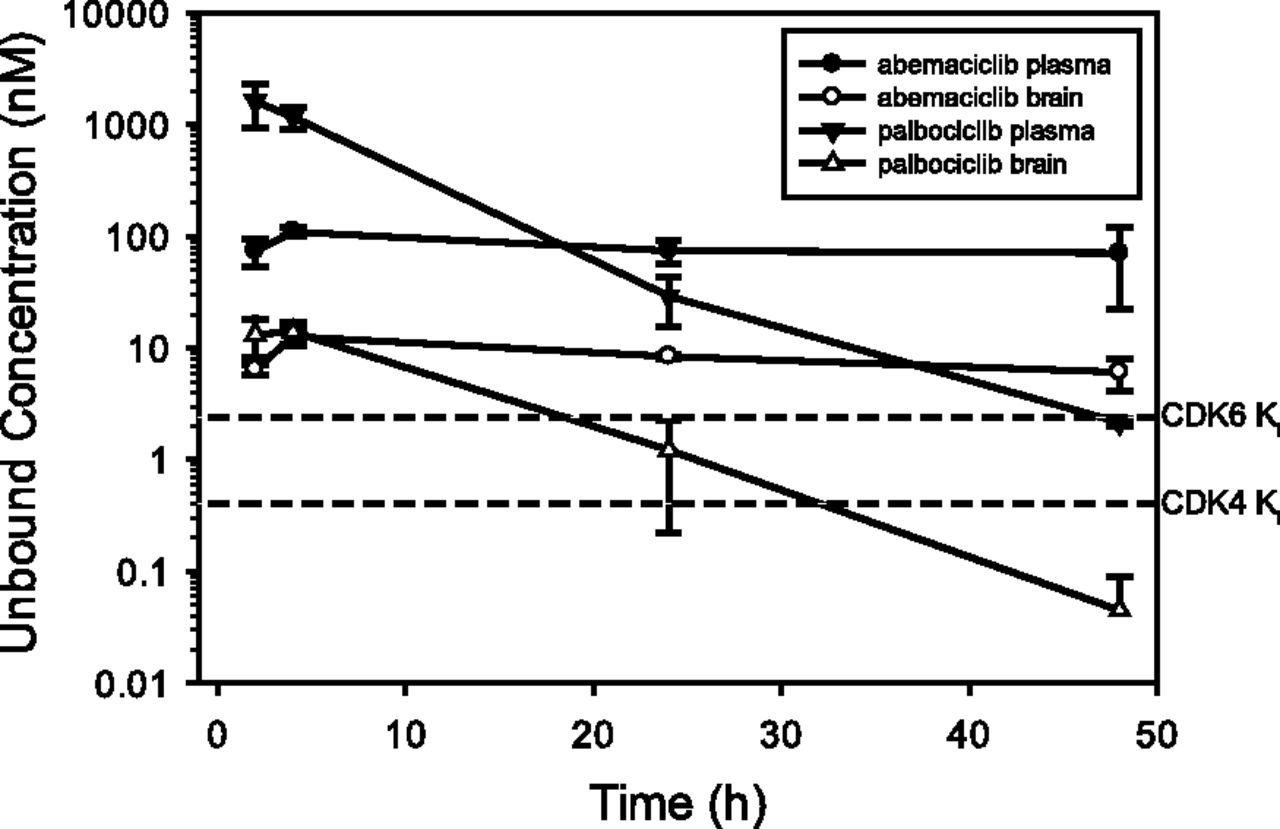
Unbound plasma and brain exposures for abemaciclib and palbociclib dosed orally once in rats at 30 mg/kg and samples analyzed at intervals over 48 hours. Total exposures were corrected for protein binding using the measured fraction unbound (Table 4). The data are means and standard deviations of triplicate animals. The reference concentrations for abemaciclib are as follows: 1) CDK4/cyclin D1 KiATP of 0.6 nM or the mean unbound concentration where 50% of the enzyme is inhibited in vitro (Gelbert et al., 2014), and 2) CDK6/cyclin D1 KiATP of 2.4 nM or the mean unbound concentration where 50% of the enzyme is inhibited in vitro (Gelbert et al., 2014).
A CDK4/cyclin D1 KiATP of 2.9 nM and a CDK6/cyclin D1 KiATP of 1.4 nM were similarly measured for palbociclib (R. Torres, unpublished data). Using the brain exposures measured in the rat pharmacokinetics study, palbociclib free brain concentrations were 6.3-fold ± 0.2-fold its measured CDK4 Ki and 2.9-fold ± 1.9-fold its measured CDK6 Ki for up to 4 hours, suggesting that palbociclib should be able to modulate the CDK4 pathway in the brain. However, unlike abemaciclib, the palbociclib brain and plasma levels decreased with time, resulting in unbound levels (Fig. 3) that were markedly less than the CDK4 and CDK6 Ki values. The AUC Kp,brain was 0.17 and Kp,uu was 0.02 ± 0.01 over time, consistent with active efflux limiting brain exposure.
Brain Exposure in Rats Codosed with a P-gp Inhibitor
The brain exposures of abemaciclib and palbociclib also were compared using Sprague-Dawley rats in an experimental design identical to the above-described MBUA. Instead of using P-gp–deficient rats that were not yet available at the time, we dosed rats intravenously with 30 mg/kg LSN335984 (specific P-gp inhibitor) at 1 hour before dosing with test compound at 2.2 µmol/kg. Similar to mice, BBB penetration of palbociclib was markedly limited by P-gp efflux, whereas abemaciclib was less so (Table 7; Supplemental Table 2). Accounting for the unbound fractions to calculate Kp,uu,brain, abemaciclib is approximately 9-fold more effective at crossing the BBB than palbociclib under these conditions and systemic exposures after equimolar doses. As with P-gp KO mice, there was no indication in these studies that systemic clearance of either compound is dependent on P-gp or influenced by pretreating with LSN335984 (Supplemental Table 2).
Rat brain uptake assay results for abemaciclib and palbociclib in Sprague-Dawley rats
Rats were dosed intravenously with vehicle (control) or vehicle containing 30 mg/kg of the P-gp inhibitor LSN335984 (+ Inhibitor) at 1 h before dosing with test compound at 2.2 µmol/kg. Total concentrations in plasma and brain were measured 5 minutes after intravenous dose. Brain concentrations were corrected for plasma volume and unbound concentrations were calculated using the measured unbound fraction (Table 4).
Regional Brain Exposure of Abemaciclib in Rats
After a single oral dose of 10 mg/kg [14C] abemaciclib to rats, drug-related radioactivity was extensively distributed into tissues and organs. Radioactivity concentrations in CNS tissues, cerebellum, cerebrum, medulla, and olfactory lobe were measurable up to 12 hours. Radioactivity concentrations in the choroid plexus were measurable up to 72–336 hours. Radioactivity exposure (AUC0–t) in these tissues relative to plasma exposure is shown in Fig. 4. Except for the choroid plexus, the tissue-to-plasma ratios (Kps) based on the AUC and Cmax for the CNS regions ranged from 0.12 to 0.45 and from 0.26 to 0.79, respectively, with the highest ratios observed for the cerebrum. It was determined that 80% of the plasma radioactivity represented parent abemaciclib.
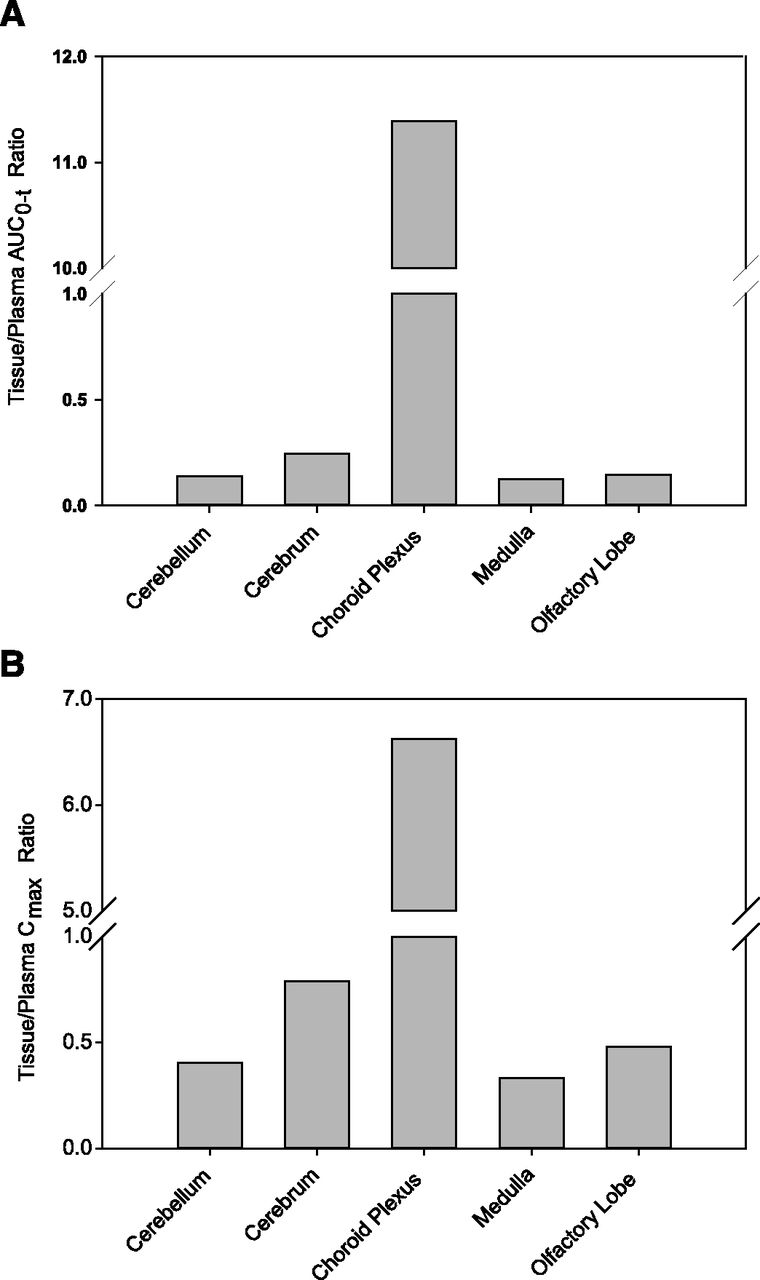
Distribution of abemaciclib-related radioactivity in brain tissues. Sprague-Dawley rats were administered a single 10-mg/kg oral dose of [14C] abemaciclib and the tissue concentrations were determined by quantitative whole-body autoradiography (Supplemental Fig. 1). Data are presented as tissue-to-plasma AUC (A) and Cmax (B) ratios.
Efficacy in a Brain Tumor Model
Abemaciclib was previously shown to have in vitro and in vivo antitumor activity against subcutaneous human xenograft tumors of diverse histologic origin, including lung, breast and melanoma representing human cancers that frequently metastasize to the brain (Dempsey et al., 2013; Gelbert et al., 2014). In this study, we used both subcutaneous and orthotopic glioblastoma U87MG xenografts to assess the antitumor activity of abemaciclib alone or when combined with TMZ. Fig. 5A shows the dose-dependent increase in survival in a rat orthotopic U87MG xenograft study with abemaciclib compared with vehicle-treated animals, in which the 40 mg/kg and 80 mg/kg doses significantly increased survival by 7.5 ± 1.3 days (P = 0.032) and 10 ± 1.3 days (P = 0.0006), respectively. No animals were lost in the groups treated with abemaciclib during the treatment period (days 4–25), suggesting that tumor growth was inhibited during treatment. Consistent with the survival data, a dose-dependent increase in both total and unbound plasma and brain exposure was observed (Fig. 5B). Only the 40 mg/kg and 80 mg/kg dose groups showed unbound brain levels in excess of both the CDK4 and CDK6 Ki values.
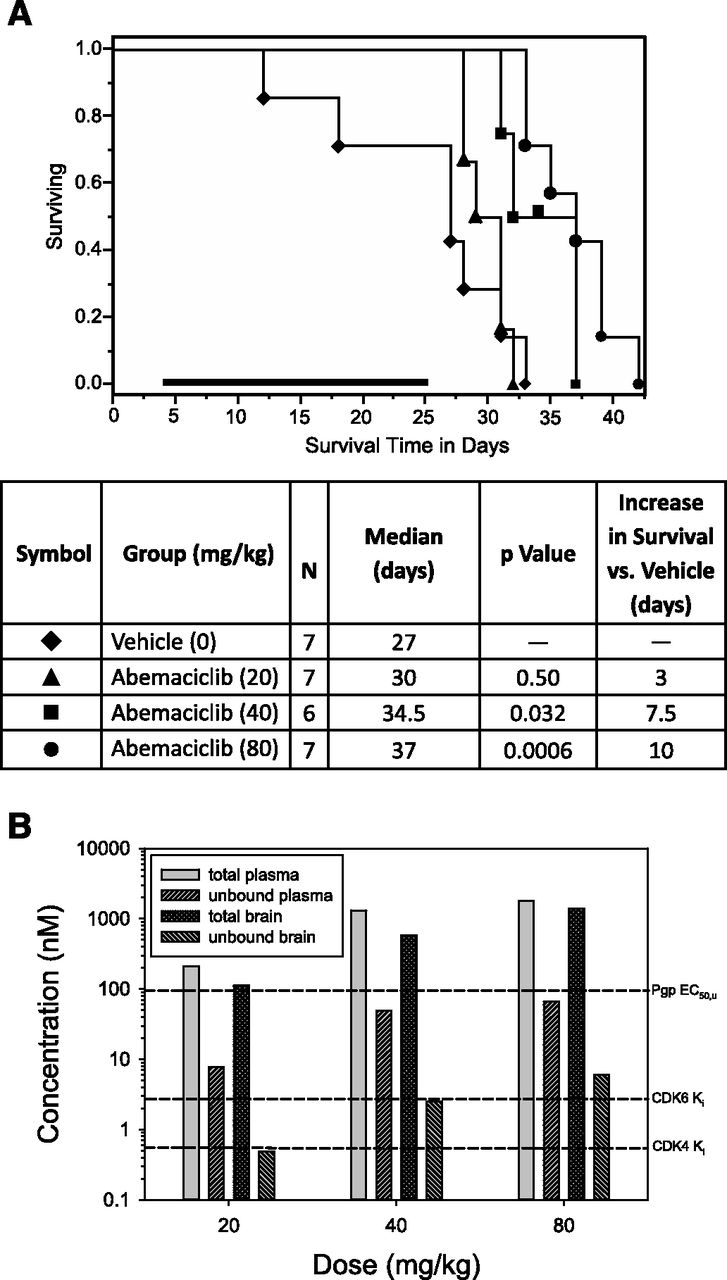
Dose-dependent antitumor activity of abemaciclib in an orthotopic U87MG rat glioma model. Tumor-bearing animals were treated for 21 days with abemaciclib beginning on day 4 (bold bar). (A) Antitumor effect of abemaciclib as indicated by increased survival of animals. Median survival was increased by 3, 7.5, and 10 days for the 20 mg/kg, 40 mg/kg, and 80 mg/kg doses, respectively. (B) Total and unbound plasma and brain exposures of abemaciclib were determined in nontumor-bearing rats after 4-daily doses and 24 hours after last dose. Animals (N = 2) were euthanized 24 hours after last dose. Total exposures were corrected for protein binding using the measured fraction unbound (Table 4). The reference concentrations are as follows: 1) P-gp EC50 of 95 nM or the mean unbound plasma concentration where 50% of the BBB P-gp is saturated (as determined in Fig. 2), 2) CDK4/cyclin D1 KiATP of 0.6 nM or the mean unbound concentration where 50% of the enzyme is inhibited in vitro (Gelbert et al., 2014), and 3) and CDK6/cyclin D1 KiATP of 2.4 nM or the mean unbound concentration where 50% of the enzyme is inhibited in vitro (Gelbert et al., 2014).
TMZ is an alkylating agent approved for the treatment of glioblastoma, and the effect of combining abemaciclib with TMZ was assessed first in mouse subcutaneous U87MG glioblastoma xenografts. Abemaciclib at 50 mg/kg or 3 mg/kg TMZ alone had a similar inhibition of xenograft growth, and the combination gave a greater inhibition of tumor growth than either individual treatment (Fig. 6). Comparison of changes in body weight for all groups showed little effect of the treatments on body weight, indicating that the combination treatment was well tolerated (data not shown).

In vivo antitumor activity of abemaciclib in combination with TMZ. Subcutaneous U87MG glioblastoma xenografts were treated with abemaciclib by oral gavage daily for 21 days, with TMZ by intraperitoneal injection every 7 days for a total of two doses, or both compounds together. Treatment period is indicated by the horizontal black line next to the x-axis, and the effect on body weight is shown in the upper left corner. Dose routes: IP, intraperitoneal; PO, oral.
The combination of abemaciclib and TMZ was then assessed using the rat U87MG orthotopic model. Abemaciclib (40 mg/kg) or TMZ (3 mg/kg) alone was efficacious, because either treatment significantly increased survival by 9 and 16.5 days, respectively, compared with the vehicle-treated group (Fig. 7). The combination of abemaciclib (40 mg/kg) and TMZ (3 mg/kg) had an additive or greater than additive effect on survival compared with the survival benefit of the individual treatments alone, in which survival was increased by 31–37.5 days (relative to untreated control) depending on the dosing schedule (Fig. 7).

Combinations of abemaciclib and TMZ are additive in a rat orthotopic glioma model. Treatments were started on day 6 at the indicated dose and schedule (horizontal bar next to the x-axis indicates treatment period). All treatments resulted in a statistically significant increase in survival, with the combination of abemaciclib daily/TMZ resulting in an additive effect, and the combination of abemaciclib every other day/TMZ resulting in a greater than additive effect. IP, intraperitoneal; PO, oral; QD, twice daily.
Discussion
Targeting the CDK4/CDK6-cyclin D1-Rb-p16/ink4a pathway through the discovery of potent CDK4 and CDK6 kinase inhibitors has potential for treating primary CNS tumors such as glioblastoma and certain peripheral tumors with a high incidence of brain metastases. The G1 restriction point is critical for regulating the cell cycle and is controlled by the CDK4 and CDK6 kinases and their associated pathway. Abemaciclib or palbociclib specifically inhibits CDK4 and CDK6, thereby inhibiting Rb protein phosphorylation in early G1. This prevents CDK-mediated G1-S phase transition, which arrests the cell cycle, suppressing DNA synthesis and inhibiting cancer cell growth.
The clinical responsiveness of brain tumors to standard chemotherapy and molecularly targeted drugs are “unambiguously disappointing” (Steeg et al., 2011). Despite the high frequency of metastatic brain tumors, there is no accepted paradigm for treatment with chemotherapy (Gerstner and Fine, 2007). The BBB restricts the diffusion of many drugs into the brain inclusive of limiting highly permeable drugs by active efflux transporters expressed at the BBB and the BTB. By contrast, the BTB is assumed by many clinicians to be leaky, as suggested by the diffusion of contrast agents for computed tomography or magnetic resonance imaging into tumors. However, researchers are calling this a misconception, as evidenced by the low tumor concentrations for most chemotherapeutic agents in brain tumors and the poor clinical outcomes (Vogelbaum and Thomas, 2007). BBB leakiness associated with CNS tumors is typically local and heterogeneous. The compromised barrier occurs in the tumor core but is fully intact at the growing tumor border. Gliomas are associated with aggressive invasion of the surrounding brain parenchyma (de Vries et al., 2009; Lee et al., 2009). Although resection reduces the primary tumor burden, extensive migration of glioma cells away from the primary tumor mass prevents the complete removal of tumor cells (Lee et al., 2009). Thus, after surgical removal of the primary tumor core, these residual tumor cells that infiltrate the normal parenchyma at the tumor border are protected by an intact BBB, and these cells often grow into larger and more aggressive tumors (Agarwal et al., 2011a).
In contrast with primary gliomas, metastatic brain tumors appear to have a more permeable BTB, suggesting that metastatic brain tumors could be treated differently than gliomas (Gerstner and Fine, 2007; Fortin, 2012). Studies also suggest lower P-gp expression in the BBB of metastatic brain tumors compared with gliomas (Gerstner and Fine, 2007). Using an experimental model for brain metastasis, Lockman et al. (2010) demonstrated partial BTB permeability compromise in greater than 89% of experimental metastatic lesions. More importantly, cytotoxic concentrations were reached in only 10% of the most permeable metastases. A similar conclusion was reached for lapatinib and its activity against brain metastases of breast cancer (Taskar et al., 2012). Both studies concluded that the BTB remains a significant impediment to standard chemotherapeutic delivery and efficacy in experimental brain metastases. Given these arguments, the next generation of clinically successful oncolytics must be effectively delivered across the BBB in consideration of treating brain tumors as a disease of the whole brain (Agarwal et al., 2011b).
The unbound brain concentration is the most relevant parameter in assessing the pharmacodynamic response of a CNS agent (Wager et al., 2011). However, it is obvious that abemaciclib and palbociclib do not entirely meet the physicochemical guidelines for optimal unbound exposure of CNS compounds (Wager et al., 2011). Abemaciclib and palbociclib have suitable log octanol-water partition coefficients but exceed the recommended molecular mass of 305 Da and topological polar surface area of 45 Å2. Greater than 75% of CNS drugs also have good passive permeability and low efflux liability (Wager et al., 2011). Some have even advised not advancing efflux transporter substrates for CNS targets because of a high risk associated with low confidence in human translation (Di et al., 2013). These non-CNS optimal, physicochemical attributes are not atypical for most of the antitumor drugs developed to date, especially kinase inhibitors.
Abemaciclib and palbociclib are substrates for human P-gp and mouse bcrp; both compounds have restricted BBB penetration that is improved by elimination of P-gp in rodents. However, the efficiency of efflux for abemaciclib appears to be lower than palbociclib, as shown by the in vitro efflux ratios of 4.1 and 12, respectively, which align with the greater Kp,uu,brain measured for abemaciclib. Unfortunately, we were unable to assess the in vivo impact of bcrp on brain exposure of these compounds. Numerous studies have shown that P-gp and BCRP work together at the BBB to restrict brain penetration of drugs (Kodaira et al., 2010; Agarwal et al., 2011a). This might be the reason that the Kp,uu of neither abemaciclib (0.48; Table 6) nor palbociclib (0.21; Table 6) in P-gp KO mice approached a value of 1.0, indicative of passive diffusion, such that bcrp is still active in these mice. This was also seen in the rat studies predosed with the P-gp–specific inhibitor (Table 7).
Optimizing unbound brain and plasma concentration ratios may increase the probability of conclusively testing the pharmacological hypotheses in clinical studies. Ultimately, enough unbound brain concentration delivered to the target is most important. To monitor scaffold optimization, we used the ratio of the unbound brain concentration to the in vitro enzyme IC50 or Ki, which we call the target engagement ratio (TER), as a crude predictor for expectations of efficacy. If the TER is close to or greater than 1.0 for a predetermined period of time, then a 50% or greater inhibition of CDK4 and CDK6 should occur. In these experiments, we have assumed that the inhibitors’ potencies at the targets are not different across species. When rats were dosed orally with 30 mg/kg and brain levels were measured for 48 hours (Fig. 3), both abemaciclib and palbociclib reached unbound brain concentrations of 13 nM and 19 nM, respectively, at 4 hours or Cmax,plasma to give TER values of 21 and 6.5, respectively, for CDK4 inhibition, which primarily reflects their difference in enzyme inhibition potency. However, abemaciclib brain TER values of >10 were sustained approximately 40 hours longer than for palbociclib due to its slower intrinsic unbound clearance from the rat plasma and brain. Similarly, abemaciclib had sustained brain TER values of 3.3–14.3 for approximately 12 hours in mice dosed with 30 mg/kg. These data suggest that both compounds can reach unbound brain levels that would be expected to produce enzyme inhibition, but that abemaciclib brain levels are more efficiently reached at presumably lower doses than palbociclib and are most likely on target longer. The distribution study using radiolabeled abemaciclib indicated that radioactivity is distributed to all regions of the rat brain, with the highest concentrations observed in the cerebrum.
Approximately 78% of gliomas have alterations in the CDK4 and CDK6 pathway, most notably amplification of CDK4, suggesting potential sensitivity to CDK4 and CDK6 inhibitors. Likewise, U87MG cells have a homozygous deletion of p16/ink4a that also occurs in 52% of primary human tumors, including lung and breast. Loss of p16/ink4a results in activation of the CDK4 pathway (Parsons et al., 2008). U87MG cells have a high and reproducible tumor take rate and a narrow survival window so that tumors can be generated easily for preclinical testing. Moreover, U87MG cells are also null for phosphatase and tensin homolog or PTEN, as are approximately 36% of human glioblastoma multiformi, which results in resistance to TMZ (Jiang et al., 2007). Unlike gliomas, orthotopic U87MG tumors have a nondiffusely infiltrative growth pattern with a well demarcated tumor mass (de Vries et al., 2009; Radaelli et al., 2009; Jacobs et al., 2011). Orthotopic U87MG tumors also have significantly more homogeneous and leaky vessels (de Vries et al., 2009) compared with gliomas, which allows even poorly brain-penetrant compounds to reach the tumor. For example, 2.3-fold more unbound drug was measured in tumor compared with contralateral, nontumor-bearing brain tissue (Carcaboso et al., 2010). U87MG tumors also express P-gp and BCRP (Carcaboso et al., 2010) consistent with clinical findings in gliomas (Fattori et al., 2007), but the functional significance of this expression can be questioned. For example, GDC-0941[2-(1H-indazol-4-yl)-6-(4-methanesulfonyl-piperazin-1- ylmethyl)-4-morpholin-4-yl-thieno[3,2-d]pyrimidine], a P-gp and BCRP substrate, was efficacious in the orthotopic U87MG model, reducing tumor volume by >60% despite limited brain penetration in the presence of an intact BBB (Salphati et al., 2012). Some of these criticisms about the translatability of the U87MG model were acknowledged by demonstrating activity in this model, which is typically used as a prerequisite for clinical testing. Abemaciclib as a single treatment was shown here to dose-dependently increase rat survival in this model. TMZ is approved for the treatment of adult patients with newly diagnosed glioblastoma multiforme (Friedman et al., 2000). We also showed here that abemaciclib (40 mg/kg) alone or TMZ (3 mg/kg) alone had similar increases in survival time of intracranial U87MG tumor-bearing rats. These data show that the combination of abemaciclib and TMZ was additive or greater than additive for increased days of survival.
We calculated the brain TER values for CDK4 Ki obtained in the three oral doses of 20, 40, and 80 mg/ml per day for 21 days to be 0.8, 4.2, and 9.9 at 4 hours after the last dose (Fig. 5B). This corresponded well with the observed increased survival of tumor-bearing mice, in which the lowest dose was not significantly efficacious (with a brain TER value of <1) and prolonged survival in the two higher dose groups was significant (with brain TER values of >1). The same trend was observed for the TER values using CDK6 Ki. Unbound levels of palbociclib were reported in normal brain surrounding the U87MG xenograft tumor and in the contralateral hemisphere of approximately 25–40 nM after 4 weeks at 150 mg/kg per day (Michaud et al., 2010), which is the maximum tolerated dose. This corresponds to estimated brain TER values of 8.6–15 for the CDK4 Ki used herein and is similarly consistent with the observed arrested growth of U87MG cell xenografts and significantly improved survival of tumor-bearing mice.
We also showed that abemaciclib is capable of saturating mouse BBB P-gp efflux with an unbound EC50 of 95 nM (Fig. 2), which suggests that brain exposure of abemaciclib might be enhanced because of this innate characteristic. However, is it really possible to rescue a P-gp/BCRP substrate for CNS indications using saturation as a clinical strategy for compound design? Others have argued that saturation of P-gp/BCRP at the human BBB is very difficult to achieve clinically for several reasons. First, the unbound blood concentration of drug is usually too low even at high doses; second, efflux transporters are typically of high capacity and low affinity (Di et al., 2013; Kalvass et al., 2013). However, BBB efflux transport saturation has been achieved in animal models (Cisternino et al., 2003; Geldof et al., 2008; Polli et al., 2009; Sane et al., 2012). In our case, although we achieved unbound plasma concentrations (902 nM in mouse, Fig. 1; 109 nM in rat, Fig. 3) that were greater than the mouse BBB P-gp unbound EC50 of 95 nM, we did not observe a marked change in the Kp,uu,brain values of 0.03 (mouse) and 0.11 (rat) after oral dosing relative to the Kp,uu,brain values obtained with low intravenous doses. This suggests that abemaciclib is unlikely able to predictably increase its own diffusion across the BBB or BTB, or that the 2-fold increase expected at a Cu,plasma/EC50 ratio of approximately 1.0 is insignificant. Clinical evidence indicates that drug interactions at the human BBB due to efflux transporter inhibition by marketed drugs are low in magnitude or less than a 2-fold increase in Kp,brain (e.g., a 50% inhibition) (Kalvass et al., 2013). The mean unbound plasma levels for abemaciclib of 15 nM achieved clinically (Shapiro et al., 2013) are markedly less than the mouse BBB EC50 of 95 nM, so partial saturation of P-gp is unlikely. We attribute the greater Kp,uu,brain values obtained after i.v. dosing to the much greater unbound plasma concentrations achieved immediately after the bolus dose. In effect, the EC50 measured at 5 minutes is most likely well underestimated. We tried generating a Ki/Km value for abemaciclib against the human P-gp expressed in MDCK cells, but this failed due to the high buffer-to-cell partitioning of this compound. Therefore, P-gp/BCRP substrate saturation as a strategy for improving CNS indications is not tenable for an orally dosed compound.
Phase 1 mean plasma Cmax exposures were reported for palbociclib of 97 ng/ml or 217 nM after dosing 21 days at 125 mg once daily (Flaherty et al., 2012). If we assume that binding in human plasma is similar to that in mice and rats (e.g., fu,plasma of 0.22), then using the Kp,uu,brain value measured in rats predicts a human brain unbound exposure of approximately 0.7 nM, which is lower than the Ki values of 1.4–2.9 nM for CDK4 and CDK6. This estimated unbound brain exposure is similar when the observed Kp,brain of 0.1 in rats and mice and the measured rat fu,brain of 0.027 are used for the calculation. In a phase 1 study in patients with advanced cancer (n = 22), a mean plasma Cmax,ss exposure for abemaciclib was 562 nM (Shapiro et al., 2013). Using similar calculations as with palbociclib, mean unbound brain concentrations in these patients are estimated to be 1.5 nM. Thus, the TER values for abemaciclib are 2.5 (CDK4) and 0.6 (CDK6), which is approximately 10-fold greater than the projected CDK4 TER of 0.2 for palbociclib, and these results support an expectation that abemaciclib should potentially reach concentrations that inhibit the target enzymes in brain tumors. If the unbound brain concentrations are prolonged as observed in rats, then time-on-target might enhance the probability of clinical target engagement in the brain with abemaciclib. Admittedly, such calculations are subject not only to differences across species but also to compounded variabilities inherent to the multiple assays used (e.g., in vitro IC50 or Ki, unbound fractions, and in vivo biosample levels, etc.). The equilibrium dialysis method for measuring the unbound fraction, especially using brain homogenate, is considered reliable for estimating free brain concentration within 3-fold, and rodent fu,brain is considered useful for predicting any species, including humans (Liu et al., 2009; Read and Braggio, 2010).
The preclinical data presented here show that abemaciclib crosses the BBB and confirm that both CDK4 and CDK6 inhibitors can reach unbound brain levels in rodents that would be expected to produce enzyme inhibition. However, abemaciclib brain levels are more efficiently reached at presumably lower doses than palbociclib and are possibly on target longer. Accordingly, abemaciclib alone had antitumor activity in the orthotopic glioblastoma U87MG xenograft rat model and showed apparent additive efficacy when codosed with TMZ.
Acknowledgments
The authors thank Dr. Raquel Torres (Quantitative Biology, Eli Lilly and Company, Alcobendas, Spain) for sharing unpublished data and Melissa Trowbridge, Covance Laboratories (Greenfield, IN) for technical support. The authors also thank Anastasia Perkowski (Eli Lilly and Company, Bridgewater, NJ) for helpful editorial comments and Dr. Richard Higgs (Statistics, Eli Lilly and Company, Indianapolis, IN) for reanalyzing some of the efficacy data.
Authorship Contributions
Participated in research design: Raub, Wishart, Kulanthaivel, Gelbert, Shannon.
Conducted experiments: Staton, Ajamie, Sawada, Shannon.
Performed data analysis: Raub, Wishart, Kulanthaivel, Sawada, Gelbert, Shannon.
Wrote or contributed to the writing of the manuscript: Raub, Gelbert, Sanchez-Martinez, De Dios.
Footnotes
- Received December 16, 2014.
- Accepted July 2, 2015.
↵1 Current affiliation: Advion Bioanalytical Laboratories, A Quintiles Company, Indianapolis, Indiana.
↵2 Current affiliation: Division of Hematology/Oncology, Department of Pediatrics, Herman B. Wells Center for Pediatric Research, Simon Cancer Center, Indiana University School of Medicine, Indianapolis, Indiana.
All Lilly authors are or were Eli Lilly and Company employees and shareholders. This research was supported by Eli Lilly and Company.
↵
 This article has supplemental material available at dmd.aspetjournals.org.

Abbreviations
- ABC
- ATP-binding cassette
- AUC
- area under the concentration-time curve
- BBB
- blood–brain barrier
- BCRP
- breast cancer resistance protein
- BTB
- blood–tumor barrier
- %cell
- percent of total mass that was added and recovered with methanol rinse of the cells
- DMSO
- dimethylsulfoxide
- ER
- efflux ratio
- GDC-0941
- 2-(1H-indazol-4-yl)-6-(4-methanesulfonyl-piperazin-1-ylmethyl)-4-morpholin-4-yl-thieno[3,2-d]pyrimidine
- KO
- knockout
- LC-MS/MS
- liquid chromatography–tandem mass spectrometry
- LSN335984
- (R)-4-[(1a,6,10b)-1,1-dichloro-1,1a,6,10b-tetrahydrodibenzo[a,e]cyclopropa[c]cyclohepten-6-yl]-[(5-quinolinyloxy)methyl]-1-piperazineethanol
- LY335979
- (R)-4-[(1a,6,10b)-1,1-difluoro-1,1a,6,10b-tetrahydrodibenzo[a,e]cyclopropa[c]cyclohepten-6-yl]-[(5-quinolinyloxy)methyl]-1-piperazineethanol
- MBUA
- mouse brain uptake assay
- MDCK
- Madin-Darby canine kidney
- m/z
- mass-to-charge ratio
- NER
- net efflux ratio
- PBSH
- phosphate-buffered saline containing 4-(2-hydroxyethyl)-1-piperazineethanesulfonic acid (HEPES) at pH 7.4
- P-gp
- P-glycoprotein
- RFU
- relative fluorescence unit
- SRM
- selected reaction monitoring
- TER
- target engagement ratio
- TMZ
- temozolomide
- Copyright © 2015 by The American Society for Pharmacology and Experimental Therapeutics


