


Abstract
Therapeutic benefits from nociceptin opioid peptide receptor (NOP) antagonism were proposed for obesity, eating disorders, and depression. LY2940094 ([2-[4-[(2-chloro-4,4-difluoro-spiro[5H-thieno[2,3-c]pyran-7,4ʹ-piperidine]-1ʹ-yl)methyl]-3-methyl-pyrazol-1-yl]-3-pyridyl]methanol) is a novel, orally bioavailable, potent, and selective NOP antagonist. We studied NOP receptor occupancy (RO) after single oral LY2940094 doses in rat hypothalamus and human brain by use of liquid chromatography with tandem mass spectrometry (LC-MS/MS) (LSN2810397) and positron emission tomography (PET) ([11C]NOP-1A) tracers, respectively. A bolus plus constant infusion tracer protocol with PET was employed in humans at 2.5 and 26.5 hours after administration of the LY2940094 dose. The RO was calculated from the change in regional distributional volume (VT) corrected for nondisplaceable volume using Lasson plots. The RO followed a simple Emax relationship to plasma LY2940094 concentration, reaching near complete occupancy in both species. For rat hypothalamus, the plasma concentration at half-maximum RO (EC50) was 5.8 ng/ml. In humans, LY2940094 was well tolerated and safe over the 4–40 mg dose range, and it peaked in plasma at 2 to 6 hours after a 1- to 2-hour lag, with approximate dose-proportional exposure. After 4–40 mg doses, NOP RO was similar across the prefrontal cortex, occipital cortex, putamen, and thalamus, with EC50 of 2.94 to 3.46 ng/ml, less than 2-fold lower than in rats. Over 4–40 mg doses, LY2940094 mean plasma levels at peak and 24 hours were 7.93–102 and 1.17–14.1 ng/ml, corresponding to the cross-region average NOP RO of 73%–97% and 28%–82%, respectively. The rat EC50 translates well to humans. LY2940094 readily penetrates the human brain, and a once-daily oral dose of 40 mg achieves sustainably high (>80%) NOP RO levels suitable for testing clinical efficacy.
Introduction
Nociceptin/orphanin FQ (nociceptin) is a 17-amino acid neuropeptide that acts as an endogenous ligand for the opioid-like one receptor (ORL1), also known as NOP (nociceptin opioid peptide receptor). NOP is a class A G-protein–coupled receptor (Meunier et al., 1995; Reinscheid et al., 1995), is encoded by the gene opiate receptor-like 1 (OPRL1), and is widely expressed in the central nervous system and specifically in regions associated with mood disorders and obesity. Symptoms of many neuropsychiatric disorders, such as pain, anxiety, depression, anorexia, obesity, and drug abuse, are believed to be potentially linked to the NOP receptor (Lambert, 2008; Murphy, 2010), which suggests NOP antagonism as a potential therapeutic strategy (Gavioli and Calo, 2006; Witkin et al., 2014).
Interest in the target has spurred the discovery of multiple tracers. Hostetler et al. (2013) reported the discovery of [18F]MK-0911, a potent, selective, and brain-penetrant positron emission tomography (PET) tracer, which was shown to have NOP binding in monkeys and humans, and was displaceable by the potent NOP antagonist MK-5757. We have recently discovered both labeled and unlabeled NOP receptor tracers with subnanomolar binding affinities with no intrinsic activity (i.e., antagonists), high selectivity, central nervous system penetration, and low nonspecific binding (Pedregal et al., 2012). LSN2810397 [Compound (S)-27 in Pedregal et al., 2012; NOP Ki = 0.114 nM] is an unlabeled tracer based on liquid chromatography with tandem mass spectrometry (LC-MS/MS), and [11C]NOP-1A (Kimura et al., 2011; Lohith et al., 2012, 2014; Pike et al., 2011) is a labeled tracer (NOP Ki = 0.15 nM) that lacks brain-penetrant radiometabolites and is suitable for PET studies. The two tracers are similar structurally, differing only in the presence or absence of one N-substituted methyl. In humans, [11C]NOP-1A is safe, with favorable kinetics and reproducibility (Lohith et al., 2012, 2014), and exhibits a distribution volume (VT) consistent with known NOP density distribution (Berthele et al., 2003).
Potent and selective NOP antagonists based on the dihydrospiro (piperidine-4,7ʹ-thieno[2,3-c]pyran) chemical scaffold have been recently discovered (Toledo et al., 2014). Among these, ([2-[4-[(2-chloro-4,4-difluoro-spiro[5H-thieno[2,3-c]pyran-7,4ʹ-piperidine]-1ʹ-yl)methyl]-3-methyl-pyrazol-1-yl]-3-pyridyl]methanol), referred to as LY2940094 (Statnick et al., 2016) (Compound 36 in Toledo et al., 2014; NOP Ki = 0.105 nM), was advanced to clinical development for the treatment of depression and alcohol dependence.
We assessed the brain NOP receptor occupancy (RO) after single oral administration of a range of doses of LY2940094 to healthy volunteers using [11C]NOP-1A as a PET ligand, and examined the relationship between the NOP RO levels of LY2940094 and its plasma concentrations to support dose selection for future efficacy trials. Furthermore, we assessed the translatability of the concentration-RO relationship of LY2940094 between that in rats (using LSN2810397 as the LC-MS/MS–based tracer) and humans (using [11C]NOP-1A and PET imaging).
Materials and Methods
Preclinical Studies of LY2940094 NOP RO in Rats.
The NOP RO of LY2940094 (Eli Lilly and Company, Indianapolis, IN) was evaluated in the hypothalamus in both dose–response and time-course experiments. Male Sprague-Dawley rats (230–300 g; three to four per dose group or time point) were housed on a 12-hour light/dark cycle (testing during light phase) and received free access to normal rat chow and water. Animals received either vehicle, the reference NOP antagonist (5S,7S)-7-[[4-(2,6-dichlorophenyl)piperidin-1-yl]methyl]-1-methyl-6,7,8,9-tetrahydro-5H-benzo[7]annulen-5-ol (SB-612111, 30 mg/kg, oral by gavage; Eli Lilly and Company) as a positive control (Spagnolo et al., 2007), or LY2940094 (0.01–10 mg/kg for the dose–response experiment; 1 mg/kg for the time-course experiment). For the dose–response experiment, NOP RO was assessed at 6 hours after dose administration; for the time-course experiment, NOP RO was assessed at 0.083, 0.25, 1, 2, 4, 8, and 24 hours after dose administration. All experiments were conducted in compliance with the Guide for the Care and Use of Laboratory Animals under protocols approved by a local animal care and use committee.
For every RO assessment, 3 µg/kg of the tracer LSN2810397 (Eli Lilly and Company) was administered intravenously 40 minutes before sacrificing the animals. Tracer concentrations in the harvested hypothalamus, a region with high NOP expression (Neal et al., 1999; Florin et al., 2000), were assessed as previously described elsewhere (Pedregal et al., 2012; Toledo et al., 2014). The brain tissue (time-course study) and plasma (both studies) LY2940094 concentration were determined by use of a specific and validated LC-MS/MS method that uses a 1200 HPLC apparatus (high-performance liquid chromatography; Agilent Technologies, Palo Alto, CA) linked to an API 4000 mass spectrometer (Applied Biosystems, Foster City, CA). A C18 column (2.1 mm × 50 mm; part no. 971700-907; Agilent Technologies) was used for the HPLC.
Because no true null region devoid of the NOP receptor was discerned in rat brain, the ratio method for target occupancy calculations could not be employed. To define 100% occupancy, or full blockade of specific binding, the hypothalamic tracer levels (ng/g) of a positive control group were used. Previous experiments determined that an oral dose of 30 mg/kg of SB-612111 fully blocked the tracer LSN2810397 (Pedregal et al., 2012). The vehicle group ng/g tracer levels in the hypothalamus represented 0% occupancy. The hypothalamic tracer levels of cohorts of animals receiving LY2940094 were linearly interpolated based on the slope of the line between the tracer levels of the vehicle (0%) and positive control (100%) groups to obtain occupancy values based on the ng/g of tracer measured.
Clinical Study Design.
The single-dose PET study used an open-label, nonrandomized, and adaptive study design and was conducted on sequential cohorts of healthy participants, enrolling a total of 14 healthy men, of whom 12 completed all the study procedures (3 per dose level). The participants were men between 18 and 45 years of age (inclusive) in good health. Five of the participants (41.7%) were white, 6 (50.0%) were black or African American, and 1 (8.3%) was Asian. A more complete list of entry criteria can be found at clinicaltrials.gov, identifier: NCT01404091.
Participant recruitment and monitoring was conducted at Kendle Early Stage (Toronto, Canada), and human neuroimaging was conducted at the Centre for Addiction and Mental Health (CAMH) Research Imaging Centre, Toronto, Canada. The PET scans were performed at baseline and approximately 2.5 and 26.5 hours after dose administration over two visits. The participants consented to the protocol before their inclusion, the study was approved by the institutional review boards of Kendle Early Stage and CAMH, and it was performed in accordance with the ethical standards laid down in the 1964 Declaration of Helsinki.
There were four cohorts of subjects. The first cohort of three subjects received 40 mg of LY2940094, and the subsequent cohorts received dose levels that were selected based on accumulated RO data in the study, with the objective of exploring a wide dynamic range of RO. Cohort 2 and 3 subjects (n = 3 each) received 10 and 4 mg, respectively, and cohort 4 subjects received 20 mg (n = 2) and 40 mg (n = 1).
Safety was monitored regularly, including adverse events (AEs), vital signs, electrocardiograms, physical examinations, clinical laboratory tests, the Columbia Suicide Severity Rating Scale, and other routine laboratory tests.
Radiotracer [11C]NOP-1A.
[11C]NOP-1A was synthesized and formulated in the radiochemistry laboratory of the CAMH PET Centre (Toronto, Canada) by 11C-methylation of an N-desmethyl precursor (Eli Lilly and Company), as previously described in detail (Pike et al., 2011), and it was administered within 60 minutes after the completion of radiosynthesis through an indwelling catheter in the antecubital vein, during which the radiotracer is known to be stable.
[11C]NOP-1A was administered as an intravenous bolus plus constant infusion over the 2-hour scan. We followed published methods to determine the magnitude of bolus fraction (i.e., Kbol) to be equivalent to 70 minutes of constant infusion (Carson et al., 1993). Previous assessments have demonstrated that approximate steady-state conditions could be consistently achieved (R. Innis, personal communication, 2011) using this regimen. The average total injected dose of radioactivity for the PET radiotracer was less than 20 mCi (740 MBq) of [11C]NOP-1A, which along with the transmission scan corresponded to less than 3.382 mSv per scan and less than 10.15 mSv for the study.
Magnetic Resonance Imaging and PET Image Acquisition Procedures.
The emission PET images were acquired on a whole body PET camera system, Siemens-Biograph HiRez XVI (Siemens Molecular Imaging, Knoxville, TN). Magnetic resonance imaging (MRI) scans were obtained before the PET scanning procedures to coregister the PET and MRI images for analysis of the PET data to identify the volumes of interest using an automated method verified by visual inspection (Rusjan et al., 2006). Additional details regarding the MRI and PET image acquisition can be found in Supplemental Fig. 3.
One arterial blood sample was collected during the PET scanning after a steady state had been reached (mean ± S.D. = 59 ± 11 minutes) after the radiotracer injection. The parent fraction was measured by HPLC to determine the metabolite corrected plasma input function, as previously described elsewhere (Lohith et al., 2012). Sample chromatogram can be found in Supplemental Fig. 4.
Distribution Volume and RO Determination.
PET tracer distribution volume (VT) was estimated in multiple brain regions: putamen, caudate, occipital cortex, prefrontal cortex, thalamus, and cerebellum. VT, representing the sum of specific and nonspecific binding (Ichise et al., 2001; Innis et al., 2007), was determined as the ratio of the average tracer concentration in the brain (Ct) during steady state divided by the tracer concentration in plasma (Cp). For the four regions of interest (ROI), namely, the prefrontal and occipital cortices, putamen, and thalamus, the NOP RO by LY2940094 (OROIdrug) was calculated based on the following equation: where VT,ROIbase, VT,ROIdrug, and VND are the total distribution volume before (baseline) and after LY290094 administration and nondisplaceable volume, respectively.
The nondisplaceable volume (VND) was estimated as the intercept of the Lassen plots (Lassen et al., 1995; Cunningham et al., 2010), where the difference between the baseline and blocked VT values is plotted against baseline VT for different regions of the brain.
Plasma Concentrations and Pharmacokinetics of LY2940094.
Venous blood samples were collected in containers with an appropriate anticoagulant before and after each scan as well as serially over a 24-hour period. LY2940094 plasma concentrations were measured by a specific and validated LC-MS/MS method. The prevailing LY2940094 concentration during the scan was calculated as the average of the concentration before and after each scan. LY2940094 pharmacokinetic parameters were estimated using standard noncompartmental analysis methods.
LY2940094 Plasma Concentration–NOP RO Relationship.
The relationship between the prevailing LY2940094 concentrations in plasma during the PET scan and the OROIdrug values was characterized using a mixed-effect Emax model, where Emax was fixed to the theoretical value of 100%. The model estimated EC50 values and additive intersubject and within-subject variances using SAS version 9.2 (SAS Institute, Cary, NC).
Results
LY2940094 NOP RO in Rat Brain.
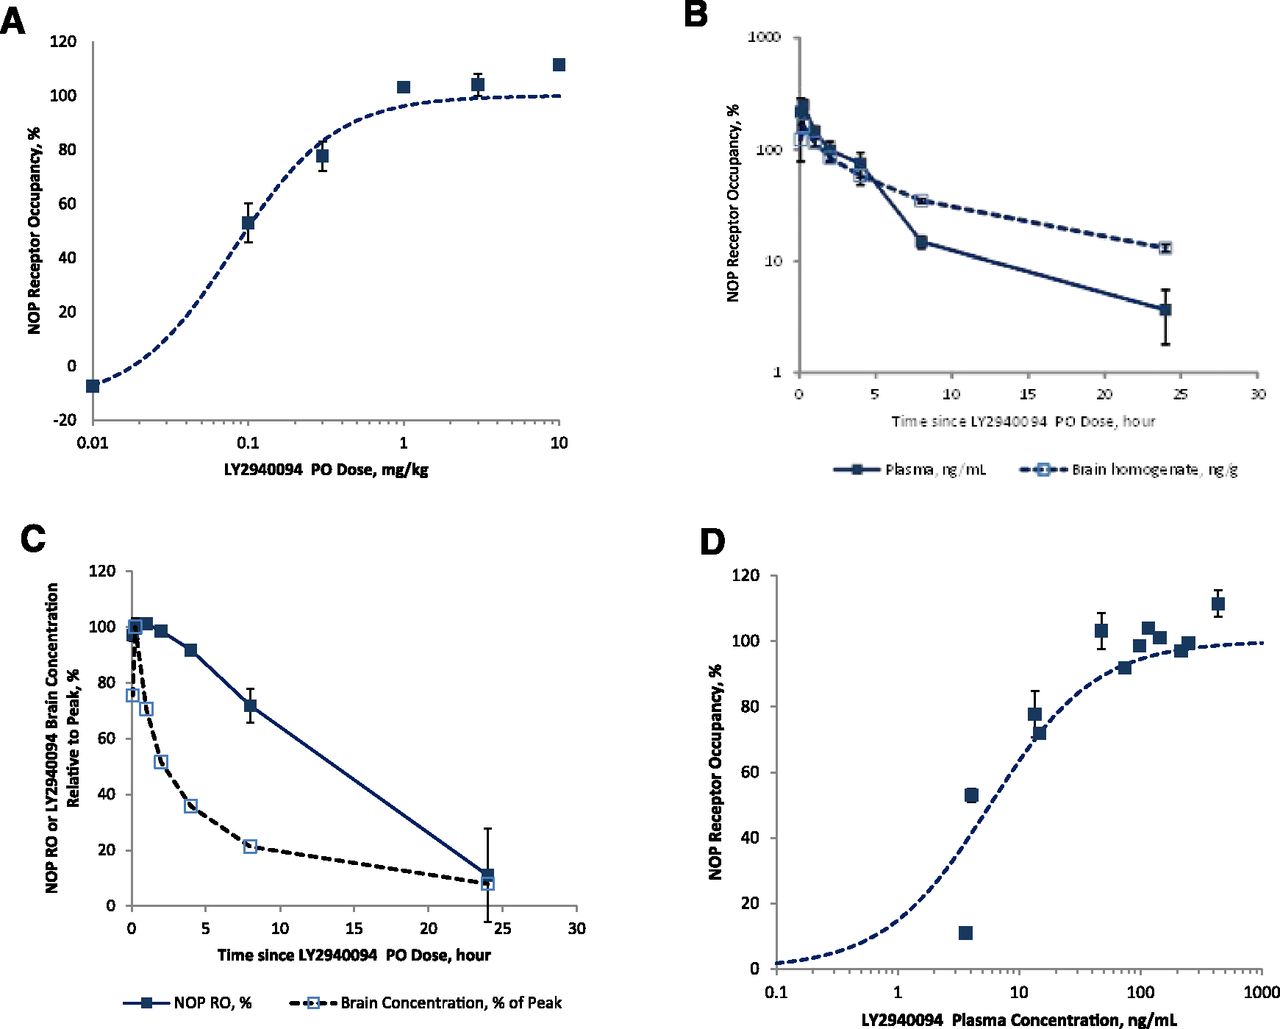
LY2940094 potently, dose-dependently, and fully occupy the NOP receptor (Fig. 1A). In the time-course study, LY2940094 plasma and brain concentrations were generally parallel (Fig. 1B). Following its peak, RO followed an approximate linear decline (Fig. 1C), maintaining >50% RO for at least 12 hours (by interpolation). A linear decline in RO is typical when drug levels decline exponentially, while the relationship between concentration and RO follows an Emax model. The Emax fit to the NOP RO vs. plasma LY2940094 levels (Fig. 1D) resulted in an EC50 ± SE estimate of 5.75 ± 1.25 ng/mL. RO was practically 100% between 5 minutes and 2 hours post dose, when LY2940094 was at its highest levels in plasma and brain tissue, approximately 99–206 ng/mL and 84–123 ng/g, respectively.

NOP RO in rat hypothalamus after single oral dosing of LY2940094. (A) NOP RO 6 hours after dose administration as a function of dose, with Emax model fit (dotted line). (B) Plasma and brain LY2940094 concentrations over time after 1 mg/kg dose. (C) Time course of NOP RO and brain concentration after 1 mg/kg dose. (D) NOP RO as a function of time-matched LY2940094 plasma concentration, with Emax model fit (dotted line).
LY2940094 Human Plasma Pharmacokinetics.
LY2940094 plasma levels started to rise after a 1- to 2-hour lag time that was quite variable across subjects (Fig. 2). Peak levels were achieved between 2 and 6 hours, followed by a biphasic decline: A rapid phase up to approximately 12 hours, followed by a slow terminal phase.

Individual LY2940094 plasma concentrations over time by dose in human subjects after single oral administration. Vertical lines are drawn to represent the timing of the two post-dose scans.
The first postdose PET scan, which was a priori set at 2.5 hours to coincide with the peak drug levels, appears to have occurred too early in many subjects. The mismatch was most significant for the subjects taking the 4- and 40-mg doses.
The pharmacokinetic parameter estimates for LY2940094 are summarized in Table 1. Cmax and area under the plasma concentration–time curve from 0 to 28.5 hours after dose administration (AUC0–28.5) values appeared to increase approximately linearly as the LY2940094 dose increased, although the sample size was too small to test this hypothesis formally.
Mean (%CV) plasma noncompartmental LY2940094 pharmacokinetic parameters by dose after single oral administration to human subjects
Radiosynthesis and Measurement in Plasma of [11C]NOP-1A.
Mean tracer specific activity of [11C]NOP-1A at the end of the synthesis was 5720 mCi/µmol (S.D. = 1600 mCi/µmol), and the mean mass injected was 1.57 µg (S.D. = 0.66 µg) with a radiochemical purity of 98.2% (S.D. = 1.0%). Parent [11C]NOP-1A typically formed 64% of the total radioactivity in arterial blood samples.
[11C]NOP-1A Time-Activity Curves and LY2940094 NOP RO.
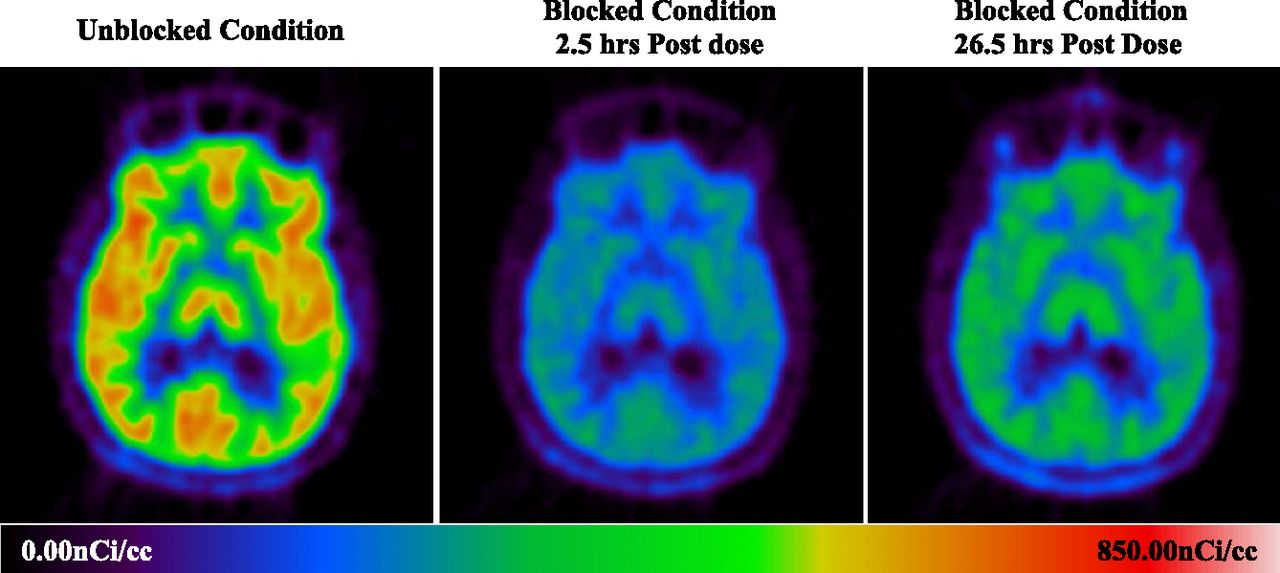
Sample PET images (Fig. 3) obtained from the same subject demonstrated the overall brain uptake of [11C]NOP-1A and its blockade by LY2940094.

Sample image of [11C]NOP-1A uptake in the same human subject at baseline and at 2.5 hours and 26.5 hours after oral dosing of LY2940094 (40 mg), respectively.
Time-activity curves, presented as the ratio of radioactivity to the parent-related radioactivity in plasma, are shown in Supplemental Fig. 1. At baseline, the brain tracer uptake ratio levels in various regions of interest rapidly increased upon the regimen initiation to a peak level typically after 10 to 20 minutes (due to the bolus) and subsequently slightly decreased to steady-state levels. The steady-state level was highest in receptor-richer regions like the thalamus, occipital cortex, prefrontal cortex, and putamen, followed by the caudate and hippocampus; that in the cerebellar cortex was the lowest. Postdose scans revealed a reduction in radiotracer uptake (lower steady-state levels) that was more profound after higher LY2940094 doses and in peak time scans, which was consistent with the higher NOP blockade at higher plasma concentrations.
Supplemental Figure 2 shows several typical Lassen plots obtained. Linear regression fits were good, with R2 ranging between 0.83 and 0.99, except for one scan after the 4-mg dose where the relationship was quite flat, indicating very low NOP occupancy.
Table 2 summarizes the mean NOP RO values by ROI, dose, and time point. LY2940094 exhibited dose-dependent target engagement of the NOP receptors after single oral doses (4–40 mg), exceeding 80% on average in the top dose levels. The NOP RO seemed to decrease moderately from the first to the second scan. The RO was similar across the different brain ROIs.
Regional NOP receptor occupancy values (%) by time point and LY2940094 dose after single oral administration to human subjects
Model: Occupancy (%) = Emax * Concentration/(EC50 + Concentration); additive random subject.
The Emax model fitted the NOP RO-plasma concentration data well (Fig. 4). Table 3 summarizes the derived parameters from model fits.
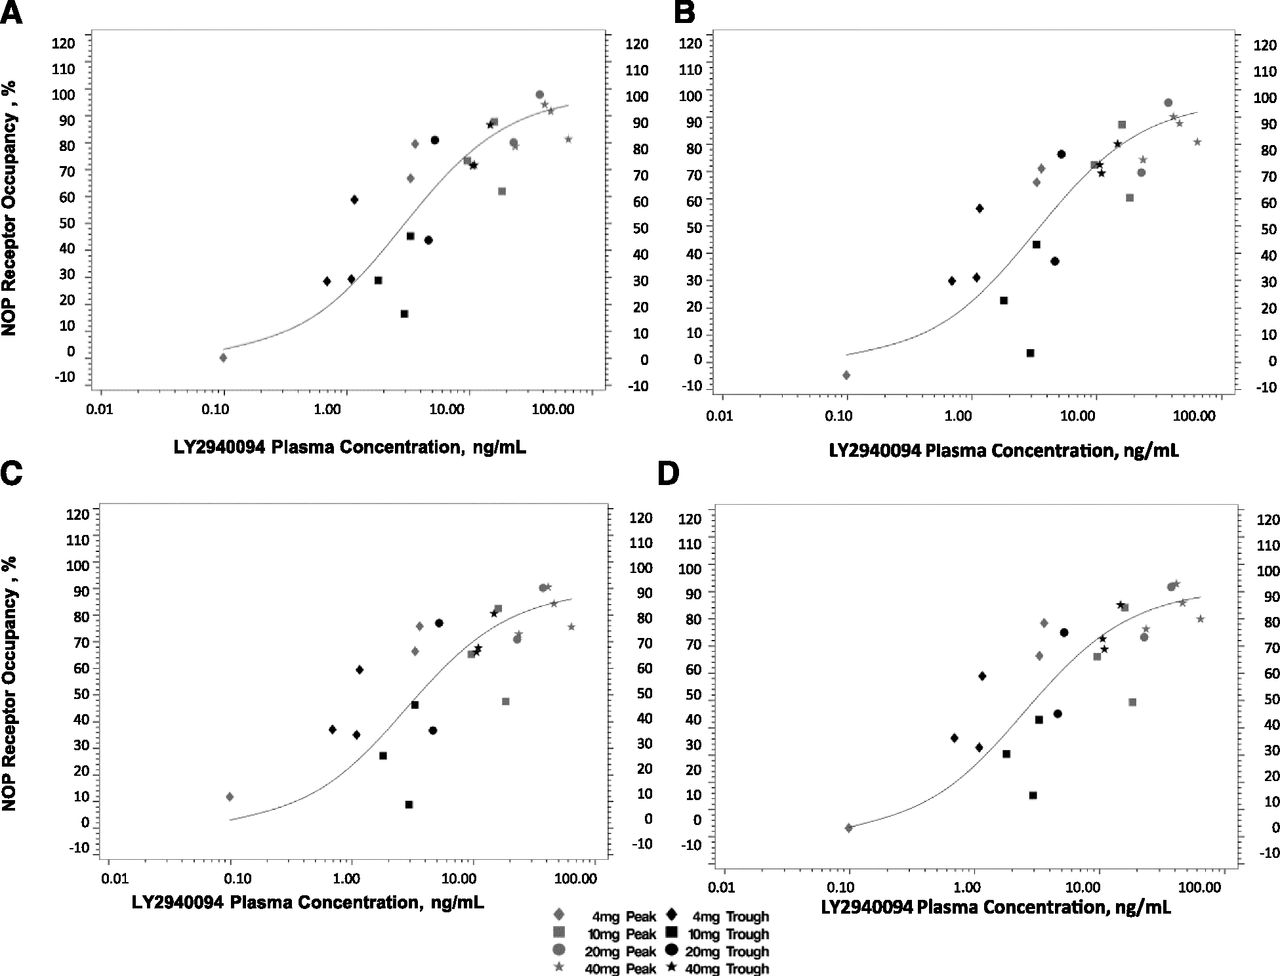
Relationship between NOP RO and LY2940094 plasma concentration after single oral administration to human subjects in (A) prefrontal cortex, (B) occipital cortex, (C) putamen, and (D) thalamus (data from 12 subjects).
Parameter estimates by Emax model for LY2940094 plasma concentration-receptor occupancy (%) after single oral administration to human subjects
Safety.
LY2940094 was safe and well tolerated after single administrations of doses ranging from 4–40 mg. There were no deaths, serious AEs, or severe treatment-emergent adverse events (TEAEs). The overall incidence of TEAEs was 25%. TEAEs were mild in severity, with no relationship to dose, and were considered either unrelated or unlikely to be related to LY2940094. The most frequent TEAE was vessel puncture site pain, reported by two participants.
Discussion
We report here the results of our preclinical and clinical studies designed to demonstrate the NOP RO by the novel potent and selective NOP receptor antagonist LY2940094, which is currently under clinical development for the treatment of depression. Our studies relied on a pair of structurally similar NOP receptor tracers, LSN2810397 and [11C]NOP-1A, both containing spiropiperidine, a common structural motif for NOP antagonists (Toledo et al., 2014) that is also shared by LY2940094. The studies examine the ability of rat NOP RO potency to predict human NOP RO potency. Additionally, these studies shed light on key attributes of LY2940094, including its systemic availability and pharmacokinetics, brain penetration, and the level of NOP RO in various regions of interest in the brain, providing a basis for dose selection for future development in target indications.
Preclinical to Clinical Translation of NOP RO.
In translational drug development, it is desirable to use the RO results of a candidate drug in preclinical species for predicting its human behavior (Melhem, 2013). Cross-species potency differences could arise from differences in plasma protein binding, transport into the brain, and the degree of receptor homology. Good cross-species concordance has been found in multiple applications (Burns et al., 2007; Hostetler et al., 2013; Melhem, 2013). In others, significant differences existed but were explained by differences in protein binding. For example, the serotonin 1A (5-HT1A) receptor antagonist (3R)-3-[di(cyclobutyl)amino]-8-fluoro-3,4-dihydro-2H-chromene-5-carboxamide (NAD-299) was shown to possess about 10-fold higher in vivo potency in monkeys than in humans, which could be accounted for by a 10-fold higher plasma free fraction (Andrée et al., 2003). In contrast, it was found that three structurally related inverse agonists for the GABAA receptors had EC50 values in human that are a third to a fifth of those in rats and rhesus monkeys, which could not be accounted for by differences in protein binding or binding affinity (Atack et al., 2010; Eng et al., 2010).
In our studies, the LY2940094 NOP RO EC50 values in rats and humans were approximately 2-fold apart; 5.75 and 2.64–3.46 ng/ml, respectively. We assessed the binding affinity of LY2940094 in the membrane of Chinese hamster ovary cells expressing recombinant human NOP receptor and membranes isolated from whole rat brain with Ki values of 0.11 and 0.71 nM, respectively (Statnick et al., 2016). The free fraction in plasma was also assessed in both species: 0.89% and 0.56%, respectively. Correcting the rat NOP RO EC50 value by both factors gives a human-equivalent EC50 of 0.56 ng/ml, overpredicting the human RO potency by 5-fold.
A larger dataset for different receptor types and ligands would be needed before generalized translatability conclusions can be made. However, it is clear that a few-fold error in either direction should be expected. In this light, rats were reasonably predictive of human potency of NOP RO and can thus support using preclinical RO data to help design early clinical studies. Contributing factors to translation error include relatively imprecise in vitro methods as well as differences in the methods used to assess RO.
Brain Penetration and RO Kinetics.
Multiple pieces of evidence suggest that LY2940094 equilibrates across the blood-brain barrier quickly, likely through passive diffusion. Data generated in our laboratories demonstrated that LY2940094 exhibited fast, passive permeability with high partitioning in Madin-Darby canine kidney cells, and was not a P-glycoprotein substrate (unpublished). Consistent with these results, plasma and brain concentrations were generally parallel in rats (Fig. 1B). Furthermore, during the model building of human data, we confirmed that the EC50 values separately estimated after the first and second postdose scans were quite similar, suggesting a direct relationship between NOP RO and plasma concentrations with no hysteresis or lag, a phenomenon consistent with rapid equilibration between brain and plasma.
LY2940094 Pharmacokinetics, NOP RO, and Dose Selection.
Overall, our PET study in healthy volunteers demonstrated brain penetrance and specific target engagement of NOP receptors after single oral doses (4–40 mg) of LY2940094. The NOP RO increased with dose and concentration, and was generally higher at the first postdose PET scan (2.5 hours) compared with the second (26.5 hours). The NOP RO levels appeared similar at the 20- and 40-mg doses at approximately 80%. The RO remained high 26.5 hours after the 40-mg dose (above 70%).
On a plasma LY2940094 concentration basis, LY2940094 potently occupied the NOP receptors, with EC50 values consistent across ROIs, ranging between 2.64 and 3.46 ng/ml. Unlike the relationship with dose, the LY2940094 concentration–RO relationship clearly suggests that higher drug levels would produce an NOP RO approaching 100%, consistent with rat data. The discrepancy can be explained by LY2940094 plasma levels during the PET scans. LY2940094 absorption lagged by 1 to 2 hours and peaked 2 to 6 hours after oral dosing. Although the intent was for the first postdose scan to concur with the peak drug levels, the PET scan largely preceded the peak in most subjects, oftentimes starting at the beginning of the rising phase of the LY2940094–concentration relationship due to the significant absorption lag time (Fig. 2). Thus, the dose–RO relationship significantly underestimates the potency of LY2940094 at peak levels. By chance, the drug levels during the first postdose scan in the 20- and 40-mg dose groups were similar and hence the RO was similar (Table 2).
Given the apparent quick equilibration of LY2940094 and constant RO potency over time, NOP RO can be predicted from LY2940094 plasma concentration, using the established concentration–RO relationship. Given this relationship, we predict that the RO at mean observed peak concentration for the doses of 4, 10, 20, and 40 mg averaged over the four tested regions to be 73%, 88%, 93%, and 97%, respectively. Similarly, the plasma LY2940094 concentration 24 hours after dose administration is consistent with 28%, 49%, 65%, and 82%, respectively.
We measured RO after a single dose of LY2940094. However, the RO after multiple-dose administration is of greater interest for a drug intended for chronic administration. The data in this study alone are inadequate to make such prediction, as a multiple-dose pharmacokinetic examination would be necessary. However, it is clear from the concentration data up to 28.5 hours after dose administration that the terminal half-life of LY2940094 is significantly in excess of 24 hours; thus, a significant accumulation of 2-fold or higher is to be expected upon once-daily dosing of LY2940094. Accounting for 2-fold concentration accumulation, RO at trough levels would likely be in the vicinity of 90%. If NOP is similar to other G protein-coupled receptors such as dopamine D2 receptor antagonists as antipsychotic agents, a level of occupancy between 50% and 90% is associated with clinically efficacious doses (Grimwood and Hartig, 2009).
In rats, LY2940094 reversed the well-documented hypothermic effect of the NOP agonist 8-[(1S,3aS)-2,3,3a,4,5,6-hexahydro-1H-phenalen-1-yl]-1-phenyl-1,3,8-triazaspiro[4.5]decan-4-one (Ro-64-6198) 2 hours after dose administration at 0.1 and 0.3 mg/kg, doses that are consistent with 50% to 80% NOP RO in our study (Toledo et al., 2014). Therefore, a 40-mg once-daily dose of LY2940094, producing NOP RO in excess of 80% throughout the dosing interval, is likely sufficient to test the therapeutic hypotheses of LY2940094, but a lower dose may also produce such a level of RO. Based on this information, a 40-mg daily dose of LY2940094 was recently used in a proof-of-concept study of major depressive disorder (Post et al., 2015), which was conducted after the studies mentioned in this report. In that study, an 8-week treatment with a once-daily 40-mg dose of LY2940094 provided some evidence of antidepressant effect (Post et al., 2015), further supporting the current hypothesis.
Conclusion
The [11C]NOP-1A tracer has proven useful for the assessment of the relationship between NOP RO, dose, and plasma concentration for the newly discovered NOP antagonist LY2940094. LY2940094 penetrates the brain with apparent quick equilibration. Rat NOP RO potency was reasonably predictive of human potency. At oral doses that appeared safe in human volunteers (4–40 mg), LY2940094 occupied up to a mean of 87% at 2.5 hours after dose administration, with an expectation of achieving approximately 97% at peak levels in various regions of the brain. The plasma concentration potency (EC50) ranged between 2.64 and 3.46 ng/ml. At this potency and pharmacokinetics, a 40-mg LY2940094 dose would be expected to maintain NOP RO above 80% throughout the dosing interval upon once-daily oral dosing, a dose that is appropriate to test the therapeutic hypotheses in future studies.
Acknowledgments
The authors thank Dr. Robert Innis (National Institute of Mental Health, Bethesda, MD) for assisting with the transfer of the [11C]NOP-1A tracer to CAMH and his general guidance on the methods, Dr. Francois Vandenhende (ClinBAY, Belgium) for conducting some of the calculations, and Dr. Wai-si Eng (YourEncore, Inc., Indianapolis, IN) for his editorial support of this manuscript. All experiments referred to in this manuscript fully comply with current laws of the countries in which they were performed.
Authorship Contributions
Participated in research design: Chappell, Ruegg, Meyer, Wilson, Tauscher, Statnick, Barth, Verfaille, Raddad.
Conducted experiments: Meyer, Wilson, Statnick, Barth.
Contributed new reagents or analytic tools: Meyer, Wilson.
Performed data analysis: Raddad, Meyer, Wilson, Barth, Zhang.
Wrote or contributed to the writing of the manuscript: Raddad, Chappell, Meyer, Wilson, Statnick, Barth, Verfaille.
Footnotes
- Received March 7, 2016.
- Accepted June 6, 2016.
↵1 Current affiliation: Takeda, Deerfield, Illinois.
This work was supported by Eli Lilly and Company. E.R., S.J.V., C.E.R., M.A.S., V.B., and X.Z. are current employees of, and have financial holdings in, Eli Lilly and Company. A.C. and J.T. were employees and had financial holdings in Eli Lilly and Company during the conduct of the studies. J.M. and A.W. received operating grant funds for this study from Eli Lilly and for other studies from GlaxoSmithKline, Bristol Myers Squibb, Lundbeck, Janssen, and SK Life Sciences in the past 5 years. J.M. has consulted to these companies, with the exception of Janssen, as well as Takeda, Sepracor, Trius, Mylan, and Teva. LY2940094 and LSN2810397 were sourced from Eli Lilly and Company.
↵
 This article has supplemental material available at dmd.aspetjournals.org.

Abbreviations
- AE
- adverse event
- CAMH
- Centre for Addiction and Mental Health
- Cp
- tracer concentration in plasma; Ct, average tracer concentration in the brain
- EC50
- plasma concentration at half-maximum receptor occupancy
- Emax
- maximum occupancy
- HPLC
- high-performance liquid chromatography
- LC-MS/MS
- liquid chromatography with tandem mass spectrometry
- LY2940094
- [2-[4-[(2-chloro-4,4-difluoro-spiro[5H-thieno[2,3-c]pyran-7,4ʹ-piperidine]-1ʹ-yl)methyl]-3-methyl-pyrazol-1-yl]-3-pyridyl]methanol
- MRI
- magnetic resonance imaging
- NAD-299
- (3R)-3-[di(cyclobutyl)amino]-8-fluoro-3,4-dihydro-2H-chromene-5-carboxamide
- NOP
- nociceptin opioid peptide receptor
- PET
- positron emission tomography
- RO
- receptor occupancy
- Ro-64-6198
- [(1S,3aS)-2,3,3a,4,5,6-hexahydro-1H-phenalen-1-yl]-1-phenyl-1,3,8-triazaspiro[4.5]decan-4-one
- ROI
- regions of interest
- SB-612111
- (5S,7S)-7-[[4-(2,6-dichlorophenyl)piperidin-1-yl]methyl]-1-methyl-6,7,8,9-tetrahydro-5H-benzo[7]annulen-5-ol
- TEAE
- treatment-emergent adverse event
- VT
- PET tracer distribution volume
- Copyright © 2016 by The American Society for Pharmacology and Experimental Therapeutics


