


Abstract
Organic cation transporters (OCTs) are responsible for excretion of cationic substances into urine. Tissue OCT expression may be important for the disposition and excretion of xenobiotics. Therefore, OCT1, OCT2, OCT3, OCTN1, and OCTN2 mRNA levels were measured in adult rat tissues and rat kidney tissue at various stages of development from day 0 to 45. OCT1 mRNA expression was highest in kidney and spleen, moderate in skin, and low in the gastrointestinal tract, brain, lung, thymus, muscle, and prostate. OCT2 mRNA levels were highest in kidney, with low expression in other tissues, and with renal OCT2 levels being approximately 4 times higher in males than that in females. In gonadectomized males, OCT2 mRNA levels were attenuated to female levels, suggesting a role for testosterone in OCT2 expression. OCT3 was moderately expressed in kidney and was highest in blood vessel, skin, and thymus. OCTN1 was expressed in most of the tissues examined, with relatively higher expression in kidney and ileum and lower levels in thymus. Lastly, OCTN2 was expressed abundantly in kidney and ileum, moderately in large intestine, dorsal prostate, bladder, duodenum, and cerebellum, and minimally in thymus, spleen, and cerebral cortex. Renal OCT1, OCTN1, and OCTN2 mRNA levels increased gradually from postnatal day 0 through day 45 in both genders. Renal OCT2 levels remained the same in males and females through day 25 and then dramatically increased only in male kidney after day 30. In summary, OCT mRNA was detected primarily in kidney, and the high level of renal OCT expression may explain why the kidney is a target organ for xenobiotics with cationic properties.
The target-organ toxicity for any given xenobiotic is dependent on its absorption, distribution, metabolism, and excretion. In addition to the capacity for phase I and II metabolism, the body's ability to absorb and excrete foreign chemicals is an important determinant for the toxicity of different types of compounds. Specifically, the organic cation transporters are responsible for the uptake of prototypical organic cations, such as tetraethylammonium (TEA2), secretion of endogenous amines, such as dopamine, and cationic xenobiotics, such as antihistamines and antiarrhythmics (Zhang et al., 1998; Burckhardt and Wolff, 2000). To date, five different rat OCTs have been identified: OCT1, OCT2, OCT3, OCTN1, and OCTN2.
OCT1, OCT2, and OCT3 are membrane-potential-driven transporters and are localized to the basolateral membrane of renal tubules (Urakami et al., 1998; Karbach et al., 2000; Sugawara-Yokoo et al., 2000). In rats, the highest OCT1 mRNA expression is in kidney, with detectable expression in liver and intestine (Grundemann et al., 1994), whereas detectable OCT1 mRNA expression in humans is localized to liver (Gorboulev et al., 1997; Zhang et al., 1997). Similarly, OCT2 is highly expressed in kidney, with no detectable transcripts in other organs in both rats and humans (Okuda et al., 1996; Gorboulev et al., 1997). Within the kidney, OCT2 is detected on the basolateral membrane of the S2 and S3 segments of proximal tubules located in the medullary rays (Karbach et al., 2000; Sugawara-Yokoo et al., 2000). In rats, OCT3 mRNA levels seem to be highest in placenta and are detectable in kidney, intestine, heart, brain, and lung (Kekuda et al., 1998). Within the kidney, OCT3 is localized to the cortical region and is detected in the proximal and distal convoluted tubules and within Bowman's capsule (Wu et al., 2000b).
Unlike OCT1 to 3, OCTN1 and OCTN2 (CT2) have functional characteristics that suggest they are proton antiporters localized to the apical membrane (Tamai et al., 1997; Yabuuchi et al., 1999). OCTN1 can transport TEA, and this transport can be inhibited by a variety of compounds, such as cimetidine, procainamide, and verapamil (Yabuuchi et al., 1999; Wu et al., 2000a). In rats, the tissue distribution of OCTN1 is somewhat similar to that in humans. Rat OCTN1 mRNA levels are highest in liver and kidney, moderate in intestine, skin, and lung, and low (but detectable) in brain, testis, and thymus (Wu et al., 2000a). Both rat and human OCTN2 transport the zwitterion, carnitine, and TEA (Sekine et al., 1998; Wu et al., 1998b, 1999). Its transport of carnitine can be inhibited by organic cations, such as TEA, choline, and cimetidine, as well as carnitine derivatives, such as acetyl-l-carnitine, propionyl-l-carnitine, and palmitoyl-dl-carnitine (Wu et al., 1999). Interestingly, human OCTN2 can transport β-lactam antibiotics because they contain quaternary nitrogens, and this transport phenomenon is of pharmacological relevance (Ganapathy et al., 2000). In rats, OCTN2 mRNA content is highest in testis, kidney, and colon, with moderate expression in small intestine, liver, brain, and placenta, and is low or nondetectable in skeletal muscle, brain, lung, and heart (Sekine et al., 1998).
The branched DNA (bDNA) signal amplification assay is a quantitative assay that can be used to measure mRNA content for a specific gene in a similar format to an enzyme-linked immunosorbent assay with linear amplification resulting in luminescence. This assay has been described in detail for the detection of several cytochromes P450 (Hartley and Klaassen, 2000). At this time, the tissue distribution of rat OCT mRNA expression and the consequences of gender and/or age on OCT expression have not been resolved. Thus, the objectives of the described studies were to determine 1) the tissue distribution of OCT expression in approximately 20 tissues from male and female rats and 2) whether OCT mRNA expression is changed with age.
Materials and Methods
Animals.
Male and female Sprague-Dawley rats (0–60 days old and gonadectomized adults) were purchased from Sasco Laboratories, Inc. (Kingston, NY). Animals were housed in a temperature-, light-, and humidity-controlled environment in hanging cages with hardwood chips. The rats were fed Laboratories Rodent Chow W (Harlan Laboratories, Madison, WI) ad libitum.
RNA Extraction.
Total tissue RNA was extracted using RNAzolB reagent (Tel-Test, Inc., Friendswood, TX) according to the manufacturer's protocol. RNA integrity was confirmed by formaldehyde agarose gel electrophoresis before analysis by the bDNA signal amplification assay (Quantigene bDNA signal amplification kit; Bayer Diagnostics, East Walpole, MA).
bDNA Signal Amplification Assay.
OCT mRNA was measured using the bDNA assay (Quantigene bDNA signal amplification kit) with modifications (Hartley and Klaassen, 2000). Rat OCT gene sequences of interest were accessed from GenBank (Table1). Multiple oligonucleotide probe sets (containing capture, label, and blocker probes) specific to a single mRNA transcript (i.e., OCT1, 2, 3, N1, and N2) were designed using Probe Designer software v1.0, and probes were designed with a Tm of approximately 63°C, enabling hybridization conditions to be held constant (i.e., 53°C) during each hybridization step and for each probe set. Every probe developed in Probe Designer was submitted to the National Center for Biotechnological Information (NCBI, Bethesda, MD) for nucleotide comparison by the basic logarithmic alignment search tool (BLASTn) to ensure minimal cross-reactivity with other known rat sequences and expressed sequence tags. Oligonucleotides with a high degree of similarity (≥80%) to other rat gene transcripts were eliminated from the probe set design. The nucleotide sequence and function for all of these probes are given in Table 1.
Oligonucleotide probes generated for analysis of OCT expression by bDNA signal amplification
Total RNA (1 μg/μl; 10 μl/well) was added to each well of a 96-well plate containing capture hybridization buffer and 100 μl of each diluted probe set. For each gene, total RNA was allowed to hybridize to the probe set overnight at 53°C. Subsequent hybridization steps were carried out according to the manufacturer's protocol, and luminescence was measured with a Quantiplex 320 bDNA luminometer interfaced with Quantiplex Data Management software version 5.02 for analysis of luminescence from the 96-well plates. The luminescence for each well is reported as relative light units (RLU) per 10 μg of total RNA.
Statistics.
Data from ontogeny studies was analyzed using a two-way analysis of variance followed by a Duncan's multiple range posthoc test. Asterisks represent a statistical difference (p ≤ 0.05) between genders.
Results
Tissue Distribution of Rat OCT1, OCT2, OCT3, OCTN1, and OCTN2 mRNA Content.
Initially, the mRNA content of OCT1 to 3, OCTN1, and OCTN2 was determined in 20 tissues using tissue RNA pooled from five animals (day 60) of each gender (data not shown). Data from these studies indicated that only OCT2 mRNA levels in kidney significantly differed with gender, and because OCT1, OCT3, OCTN1, and OCTN2 mRNA expression did not differ greatly between genders, only RNA from individual male tissues was analyzed for mRNA content for these genes.
OCT1 mRNA levels were highest in kidney, skin, spleen, and liver and were lowest in stomach (Fig. 1). Skin OCT1 mRNA expression was approximately 42%, liver OCT1 expression was 16%, and stomach expression was 1% of that present in kidney. Relative to kidney, OCT1 mRNA expression was low in the small and large intestine (intestinal OCT1 expression was approximately 7 to 12% of renal OCT1 expression) and brain (cerebellum and cerebral cortex OCT1 expression was approximately 6% of that detected in kidney). Similarly, relatively low OCT1 mRNA levels were detected in lung, thymus, spleen, heart, blood vessel, muscle, bladder, and prostate.

Tissue distribution of rat OCT1 mRNA.
Tissue total RNA was isolated from 60-day-old male rats and analyzed by the bDNA signal amplification assay for OCT1 mRNA content. The data are presented as mean RLU ± S.E.M. (n = 4–5 animals).
Initial studies indicated that OCT2 mRNA levels in kidney were significantly higher in males than in females. Therefore, OCT2 mRNA content was examined in male and female tissues. When compared with other tissues, OCT2 transcript levels were highest in both male and female kidney (Fig. 2). However, OCT2 mRNA content in female kidney was only one-fourth of that present in male kidney. The apparent gender difference for OCT2 expression was only observed in kidney and was not detected for other tissues examined. OCT2 mRNA expression was significantly lower in other tissues—hepatic, thymic, and bladder tissue had approximately 2% of the OCT2 mRNA present in male kidney and 9% of that detected in female kidney. For all other tissues examined, OCT2 mRNA expression was, at most, approximately 2% of renal OCT2 in males and 8% of renal OCT2 in females.

Tissue distribution of rat OCT2 mRNA.
Tissue total RNA was isolated from 60-day-old male and female rats and analyzed by the bDNA signal amplification assay for OCT2 mRNA content. The data are presented as mean RLU ± S.E.M. (n = 4–5 animals). ★, represents a statistically significant differences (p ≤ 0.05) between males and females.
Interestingly, in rat, the tissue distribution for OCT3 mRNA distribution was strikingly different from that of OCT1 and OCT2. Experiments in which total RNA was pooled from five animals to assess OCT3 expression revealed that OCT3 expression did not seem to differ between the males and female tissue examined. Unlike OCT1 and OCT2, OCT3 mRNA levels were highest in blood vessel, followed by skin and thymus, and lowest in liver, bladder, and prostate (liver, bladder, and prostate OCT3 mRNA content was 7–9% of that detected in blood vessel) (Fig. 3). Intermediate OCT3 mRNA levels were detected in the intestinal tract, lung, heart, muscle, spleen, kidney, and brain.
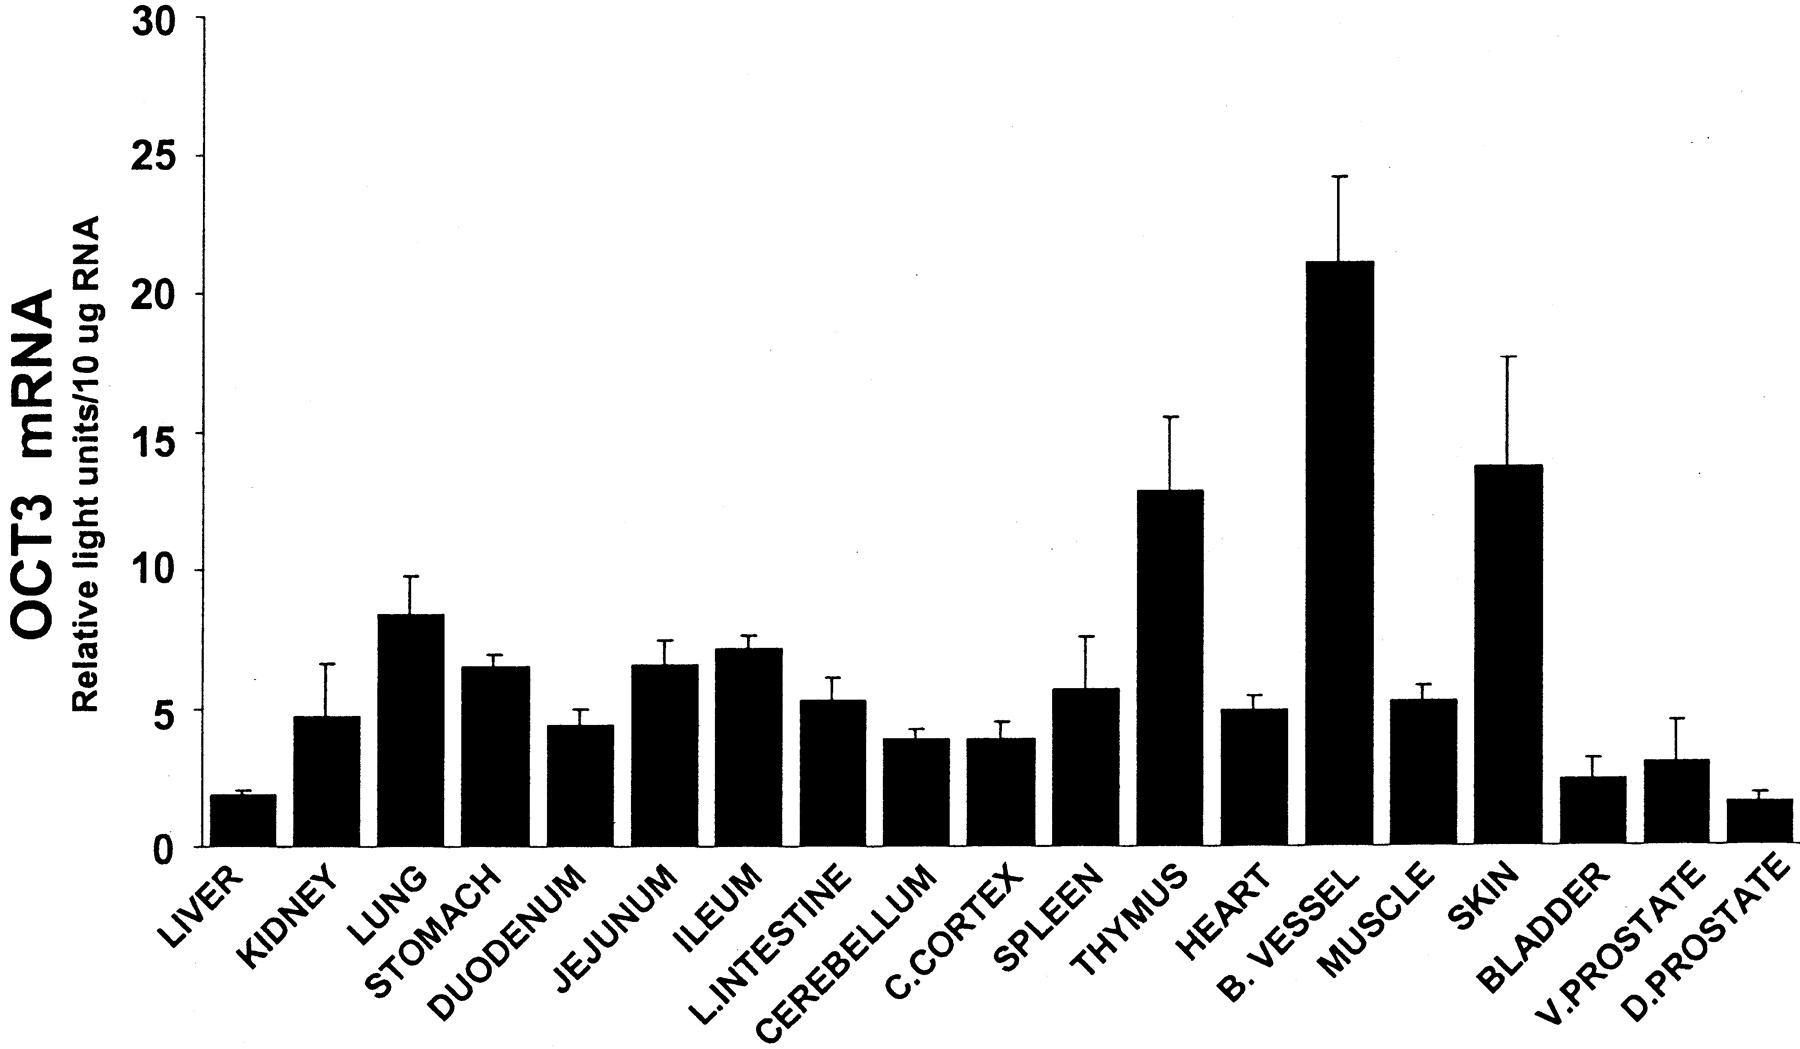
Tissue distribution of rat OCT3 mRNA.
Tissue total RNA was isolated from 60-day-old male rats and analyzed by the bDNA signal amplification assay for OCT3 mRNA content. The data are presented as mean RLU ± S.E.M. (n = 4–5 animals).
Preliminary studies indicated that OCTN1 mRNA levels in various tissues did not differ significantly between males and females for the tissue examined. In general, OCTN1 mRNA was broadly expressed among the 20 tissues examined and was highest in kidney and lowest in thymus (Fig.4). Thymic OCTN1 mRNA content was approximately 8% of that present in kidney. Hepatic, large intestine, and muscle OCTN1 mRNA content was approximately one-fourth of renal OCTN1 content. Relative to the other tissues examined, OCTN1 mRNA expression in the small intestine was moderate. Interestingly, OCTN1 was slightly higher in cerebellum than in cerebral cortex. Moderate OCTN1 expression was also detected in skin, heart, and spleen.

Tissue distribution of rat OCTN1 mRNA.
Tissue total RNA was isolated from 60-day-old male rats and analyzed by the bDNA signal amplification assay for OCTN1 mRNA content. The data are presented as mean RLU ± S.E.M. (n = 4–5 animals).
Like OCT1, OCT2, and OCTN1, OCTN2 mRNA was also highly expressed in kidney relative to other tissues (Fig.5). In addition, it was also expressed similarly in ileum. OCTN2 mRNA expression was lowest in thymus, which was approximately 2% of that observed in kidney and ileum. In general, when compared with other tissues, OCTN2 mRNA expression was moderate to high in the small intestine, with levels increasing from duodenum to the ileum. Large intestine also had relatively moderate OCTN2 levels (half of that present in kidney or ileum). Similar to OCTN1, cerebellum also had higher OCTN2 mRNA levels than that of cerebral cortex (approximately 3 times higher). Of note, dorsal prostate OCTN2 mRNA expression was almost 4 times higher than that of ventral prostate and was moderately expressed in comparison to the expression in other tissues analyzed.

Tissue distribution of rat OCTN2 mRNA.
Tissue total RNA was isolated from 60-day-old male rats and analyzed by the bDNA signal amplification assay for OCTN2 mRNA content. The data are presented as mean RLU ± S.E.M. (n = 4–5 animals).
Developmental Changes in Kidney OCT mRNA Content.
The kidney was selected to determine changes in OCT expression with development because OCT mRNA levels were generally highest in kidney (except for OCT3). Total RNA from four to five male and female rats was analyzed by the bDNA signal amplification assay to determine whether OCT expression changes over time from the newborn stage (day 0) through adulthood (day 45).
Indeed, the relative levels of OCT1 mRNA in kidney significantly increased with age by approximately 4.5-fold from day 0 to 45 (Fig.6, upper panel). At day 45, OCT1 mRNA levels in female kidney were 30% higher than that present in male and comparable to that present in adult male kidney.
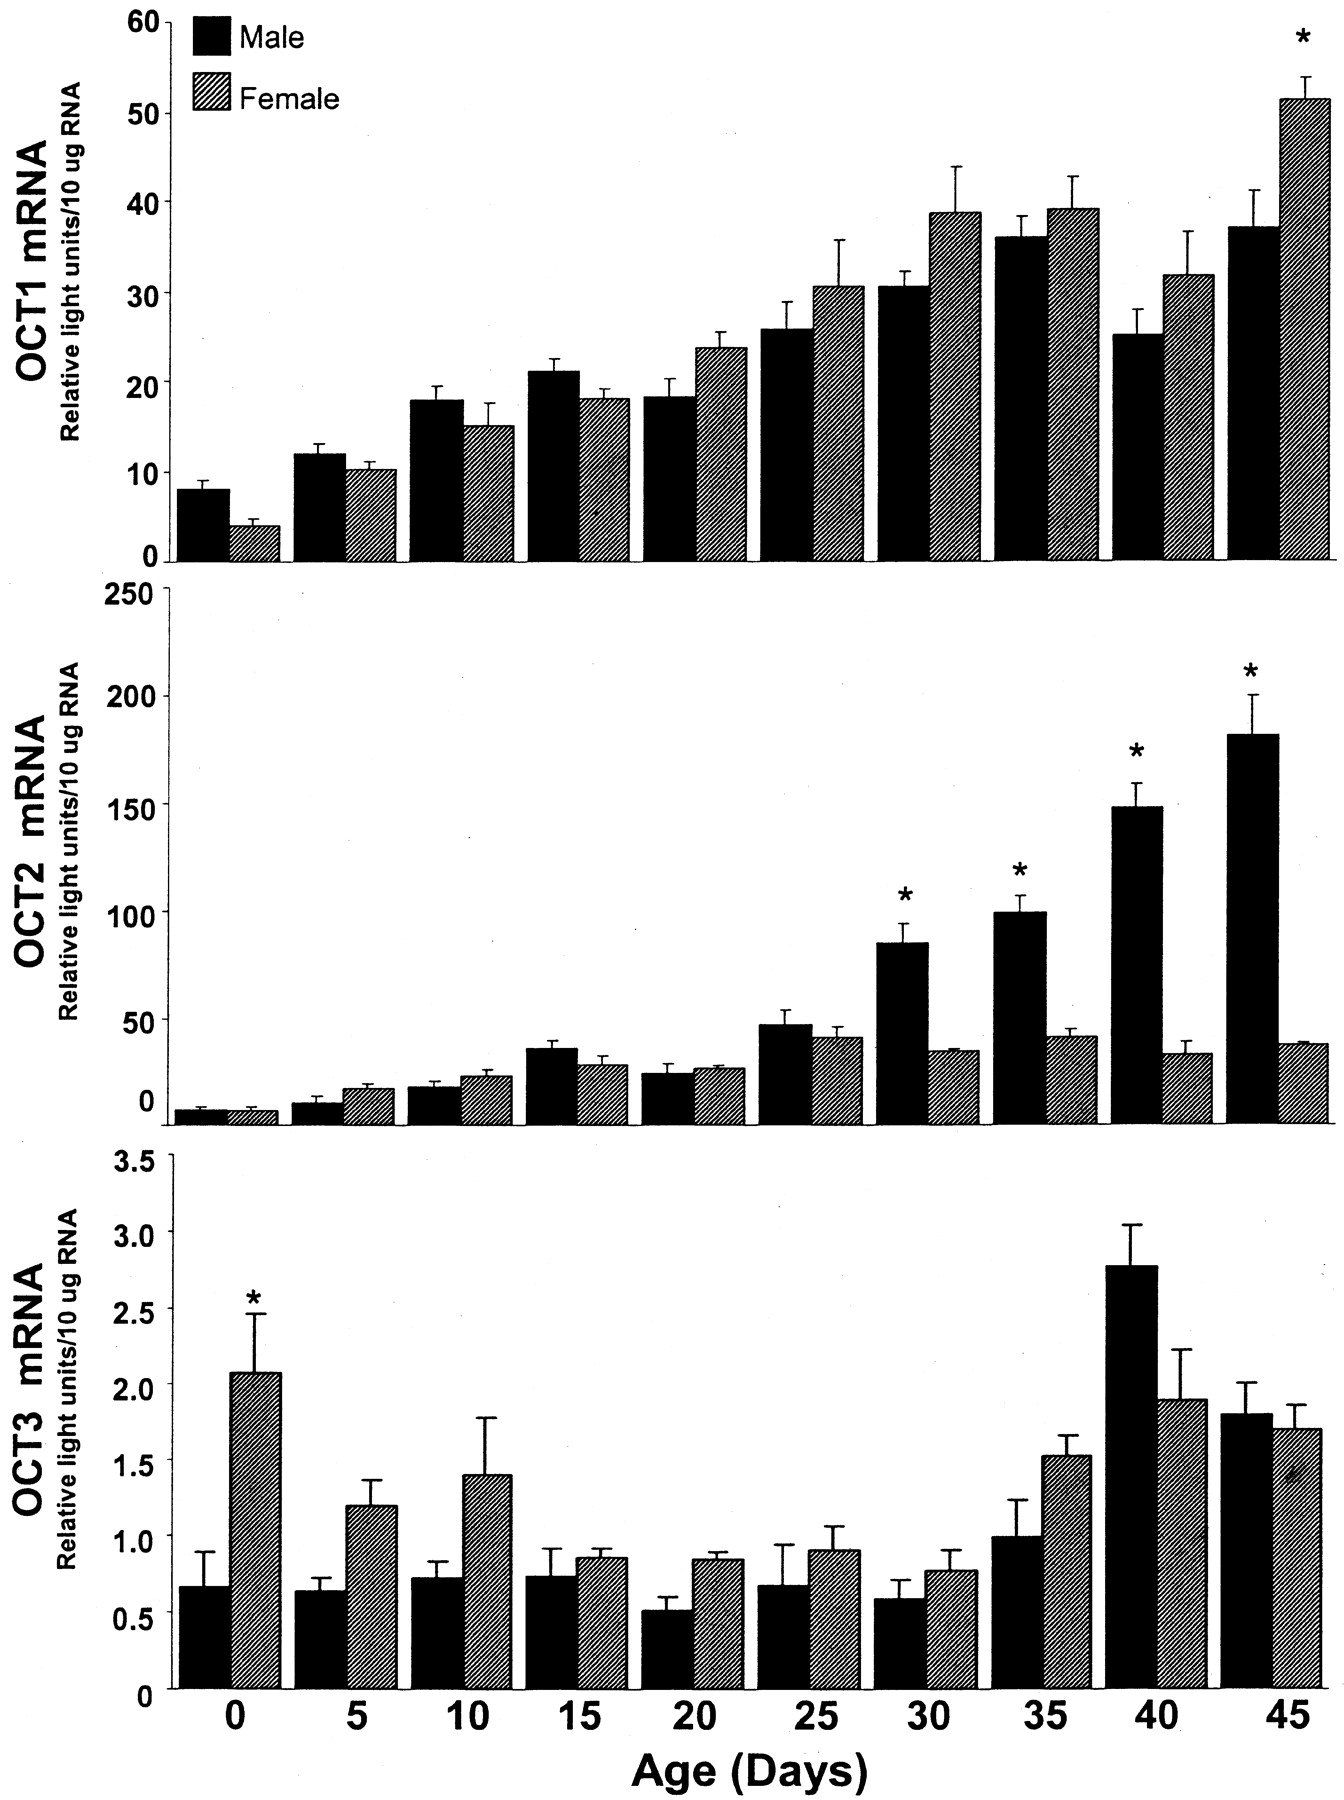
OCT1, OCT2, and OCT3 mRNA expression in kidney tissue from male and female rats of various ages.
Total RNA was isolated from day-0, -5, -10, -15, -20, -25, -30, -35, -40, and -45 rat kidneys and analyzed by the bDNA signal amplification assay for specific OCT mRNA content. The data are presented as mean RLU ± S.E.M. (n = 4–5 animals). ★, represents a statistically significant differences (p ≤ 0.05) between males and females.
Interestingly, renal OCT2 mRNA levels dramatically increased with age and were significantly higher in day-45 males compared with day-0 males (by 25-fold) (Fig. 6, middle panel). Initially, kidney OCT2 mRNA content was not different between males and females between days 0 and 25. However, at day 30 and thereafter, OCT2 mRNA levels in male kidney were significantly higher than that in female kidney (approximately 2.5 to 5 times higher than female). At day 30, male OCT2 expression in kidney increased almost 12-fold compared with day 0, and by day 45, it increased 25-fold compared with day 0. In males, OCT2 mRNA levels in kidney doubled between days 30 and 45. By contrast, OCT2 mRNA expression in female kidney increased slightly from day 0 to 45, and unlike that in male kidney, its expression did not dramatically increase after day 25 (Fig. 6, middle panel).
Data from an earlier article (Kekuda et al., 1998) indicated that OCT3 mRNA content was relatively low in kidney when compared with other tissues. OCT3 transcript levels were relatively similar in male and female kidney throughout development (Fig. 6, lower panel). However, at day 0, OCT3 mRNA levels were significantly higher in female kidney than that detected in male kidney. In general, it seemed that female OCT3 mRNA content in kidney did increase slightly with age, whereas male OCT3 expression in kidney was high at day 0, dropped through day 30, and then climbed to day-0 levels again by day 35.
OCTN1 mRNA content seemed to increase gradually with age in both male and female kidney, increasing approximately 3-fold from day 0 to 45 (Fig. 7, upper panel). No significant differences in renal OCTN1 expression were observed between males and females at any time point.
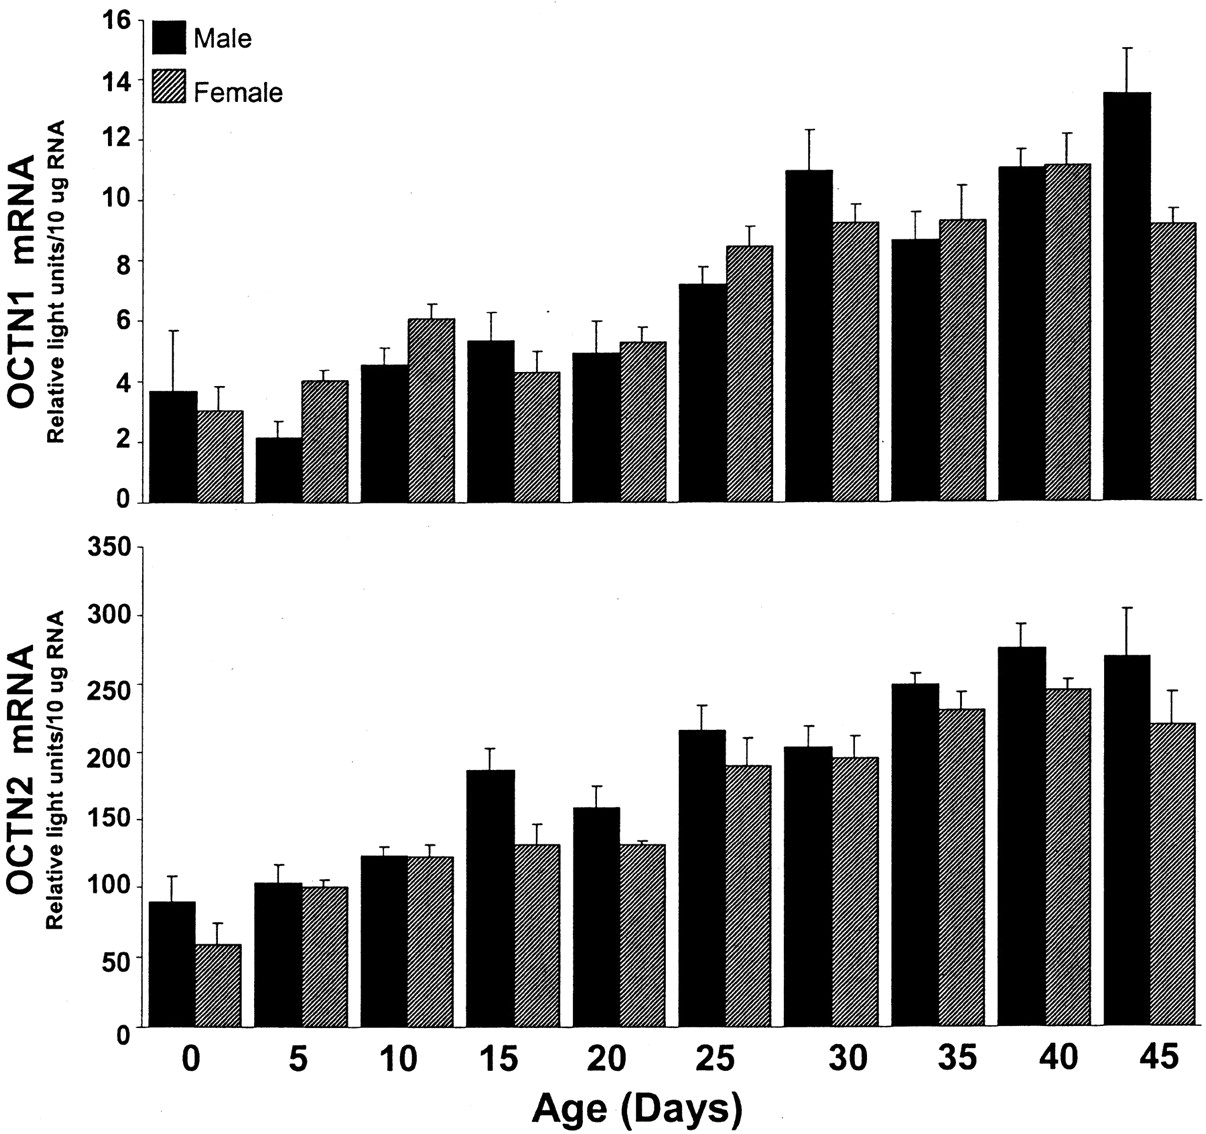
OCTN1 and OCTN2 mRNA expression in kidney tissue from male and female rats of various ages.
Total RNA was isolated from day-0, -5, -10, -15, -20, -25, -30, -35, -40, and -45 rat kidneys and analyzed by the bDNA signal amplification assay for specific OCT mRNA content. The data are presented as mean RLU ± S.E.M. (n = 4–5 animals).
Similar to the other OCTs, OCTN2 mRNA content in kidney increased gradually from day 0 to 45 in both females and males (Fig. 7, lower panel). From day 0 to 45, the relative OCTN2 mRNA level in kidney increased by approximately 3- to 4-fold in both genders. No significant differences in renal OCTN2 content were observed between males and females at any time point.
Renal OCT2 Expression in Gonadectomized Rats.
In Fig. 2, OCT2 mRNA levels were significantly higher in male rat kidney than that in female kidney, and to evaluate this difference further, studies were conducted to determine the effect of gonadectomy on OCT2 expression. Consistent with the tissue distribution studies, OCT2 mRNA expression was significantly higher in kidneys from intact adult male than that present in kidneys from intact female rats (Fig.8). However, in gonadectomized males OCT2 transcript levels decreased by approximately 50% of that present in intact male kidney, which was similar to levels detected in female kidney. Ovariectomy had no effect on OCT2 mRNA levels in female kidney.

OCT2 expression in kidney tissue from intact and gonadectomized adult male and female rats.
Total kidney RNA was isolated and analyzed by the bDNA signal amplification assay for specific OCT mRNA content. The data are presented as mean RLU ± S.E.M. (n = 4–5 animals). ★, represents a statistically significant differences (p ≤ 0.05) between intact and gonadectomized rats.
Discussion
To date, five OCTs have been cloned from rat (Burckhardt and Wolff, 2000). Although most studies have documented the OCT mRNA content in some rat tissues, their tissue expression pattern has not been thoroughly characterized in a quantitative manner, and postnatal developmental changes in OCT mRNA expression in kidney have not been evaluated. The bDNA assay is a highly sensitive method that detects gene-specific transcripts in a quantitative manner. It has been used to detect human immunodeficiency virus (Rouet et al., 2001), hepatitis B (Enomoto et al., 2001), and cytochrome P450 isoforms (Hartley and Klaassen, 2000). Hence, this methodology was used to assess the expression of OCTs in approximately 20 different tissues from adult rats and in kidneys from postnatal day-0 through day-45 rats.
The present study demonstrated that rat OCT1 mRNA is predominantly expressed in kidney, with moderate expression in liver, skin, and spleen, and low expression in the other tissues examined. This work agrees with previous reports that document high OCT1 mRNA expression in rat kidney, with relatively lower expression in liver, even lower expression in intestine, and nondetectable expression in skeletal muscle, heart, and lung (Grundemann et al., 1994; Wu et al., 1998b). OCT1 transcripts have been detected in intestine and colon but not in spleen (Grundemann et al., 1994). In our study, it was detected in spleen with somewhat lower expression in small and large intestine. Possible explanations for this inconsistency are that the Northern cDNA or oligo probe used to originally document OCT1 expression may likely detect other rat OCT isoforms and the bDNA assay can be a more sensitive detection method than Northern analysis. Moreover, the predominant OCT1 expression in rat kidney differs from human OCT1 expression, which is highest in liver (Zhang et al., 1997). This species difference may indicate that the rat is not a good model for examining the disposition of OCT1 substrates. Because OCT1 was highest in kidney, the ontogeny of OCT1 expression was performed using kidney RNA from postnatal day-0 through day-45 rats. OCT1 mRNA expression increased gradually from neonatal stages to adulthood in both males and female kidney. Because OCT1 is localized to the basolateral membrane (Urakami et al., 1998; Karbach et al., 2000) and it mediates the removal of organic cations from blood into kidney and liver, both organs may be susceptible to toxic organic cations that are substrates for OCT1. Furthermore, because OCT1 levels are lower in neonates than that present in adults, xenobiotics that are OCT1 substrates may be excreted more slowly in neonates, and this decreased capacity of neonates for OC secretion may result in increased half-lives and blood levels of cationic xenobiotics with narrow therapeutic to toxicity margins.
Our tissue distribution studies indicated that OCT2 mRNA is present in high levels in kidney, with very low expression in the other tissues. These findings agree with a study that detected an OCT2 message in kidney and not in other tissues (Okuda et al., 1996). Furthermore, the predominant expression of OCT2 in rat kidney is analogous to human expression of OCT2 mRNA, which is also primarily expressed in kidney (Gorboulev et al., 1997). Renal OCT2 levels dramatically increased after day 25 in males, but a similar increase in female kidney was not observed, and renal OCT2 levels in gonadectomized adult male rats were substantially lower than that present in kidneys from intact males. Together, these data suggest that OCT2 mRNA expression in kidney may be regulated by male steroid sex hormones. Our studies agree with articles that document increased renal OCT2 mRNA, protein expression, and OC uptake in male and female kidneys from rats treated with testosterone (Urakami et al., 1999, 2000). This gender difference in OCT2 expression supports an early finding that identified greater uptake of the organic cation TEA in renal cortical slices from male rats compared with female rats (Bowman and Hook, 1972). The marked increase in kidney OCT2 mRNA levels in males after day 25 suggests that there is an increase in testosterone levels before day 25. In fact, there is evidence to support this theory because it has been reported that serum testosterone levels in male rats increase steadily from day 23 through day 64 (Monosson et al., 1999). Thus, it is imperative to identify whether gender differences in OCT2 expression can cause differences in OC distribution or toxicity to the kidney. There is evidence that this may be true for the putative OCT2 substrate and nephrotoxicant cisplatin (Pan et al., 1999). Younger rats (age, 10–15 days) are less susceptible to cisplatin-induced nephrotoxicity and have lower renal platinum concentrations than that found in adult kidney following cisplatin exposure (Appenroth and Braunlich, 1984; Jongejan et al., 1986). Furthermore, renal platinum concentrations and cisplatin-DNA adducts are higher in males than that in females following cisplatin exposure (Reed et al., 1987). The difference in OCT2 expression between young and adult rats and between genders may explain these earlier findings. It is unknown at this time if there is a gender difference in OCT2 content in human kidney. Thus, if OCT2 is also differentially expressed in human kidney as it is in rat kidney, drugs that are OCT2 substrates may have very different excretion kinetics in females and males, as well as for children versus adults.
In our studies, OCT3 mRNA levels were highest in blood vessel, skin, and thymus —all tissues not known to express OCT3. Similar to previously published data from Northern blots (Kekuda et al., 1998; Wu et al., 1998a), OCT3 mRNA was low in liver, with detectable transcripts in kidney and intestine. Relative to blood vessel, skin, and thymus, renal OCT3 mRNA levels were low. Thus, changes in OCT3 expression between different ages or genders may not result in significant changes in OC distribution to kidney. Furthermore, the relative renal expression of OCT3 compared with OCT1 or OCT2 would suggest that OCT3 might be less involved in OC uptake across the basolateral membrane if functional OCT1 and OCT2 transporters are present.
OCTN1 has been identified as a bidirectional pH-dependent transporter with affinity for organic cations, such as pyrilamine, verapamil, quinidine, and quinine (Yabuuchi et al., 1999). OCTN1 mRNA levels were highest in kidney; however, this expression was not predominant, and moderate OCTN1 mRNA levels were detected in liver, intestine, brain, heart, spleen, and skin. These data agree with a previous article that documents high OCTN1 mRNA expression in rat kidney, liver, and small intestine and low expression in thymus and stomach (Wu et al., 2000a). Renal OCTN1 levels increased steadily with age, with significantly higher OCTN1 mRNA levels in adult kidney. Humans also express high levels of OCTN1 in kidney like that observed for rat; however, human OCTN1 is minimally expressed in mature liver tissue, whereas OCTN1 mRNA is moderately expressed in adult rat liver (Tamai et al., 1997). Because it is thought that OCTN1 is localized to the apical membrane (Yabuuchi et al., 1999), it is hypothesized to aid in the secretion of organic cations from the tubule epithelia into the lumen. Thus, in humans, if OCTN1 expression in kidney increases with age, the secretion of drug substrates for OCTN1 may also differ between children and adults. This could be of important clinical significance because several OCTN1 substrates are antiarrhythmic drugs (Yabuuchi et al., 1999; Wu et al., 2000a).
Furthermore, transcript levels of the carnitine transporter OCTN2 were highest in kidney, ileum, and large intestine, with low expression in thymus, spleen, and cerebral cortex, and this finding agrees with a previous study that detected strong mRNA expression of OCTN2 in rat kidney followed by mRNA expression in intestine and low expression in spleen, muscle, and brain (Sekine et al., 1998). However, our studies found that OCTN2 mRNA was expressed moderately in testes, whereasSekine et al. (1998) detected high OCTN2 mRNA expression in testes. Like OCTN1, renal OCTN2 mRNA levels also increased gradually with age. These data support clinical findings that document an age-related decrease in total urine carnitine content (millimoles of carnitine/mole of creatinine) from 0 to 5 years to 5 to 12 years or adulthood (de Sousa et al., 1990). Renal OCTN2 is thought to be responsible for carnitine reabsorption and the reabsorption of other compounds structurally similar to carnitine, such as β-lactam antibiotics (Ganapathy et al., 2000). A high capacity for reabsorption of certain types of OCs may predispose the kidney to the accumulation of toxicants that are OCTN2 substrates. For example, the high expression of OCTN2 in day-45 adult kidney compared with day-0 neonatal kidney may explain previous findings that older rats and rabbits are more susceptible to cephaloridine-induced nephrotoxicity and accumulation of renal cephaloridine (Wold et al., 1977; Goldstein et al., 1986).
In summary, the most OCTs are predominantly expressed in kidney (except OCT3), and renal expression of OCTs seems to increase with age. The high expression of OCTs in kidney may explain previous findings with regard to differences in accumulation or toxicity of some compounds that are OCT substrates. However, additional studies must be performed to determine the tissue expression of OCT proteins and OCT protein levels correspondingly increasing with age in kidney. Further studies designed to identify the relationship between OCT expression and activity for age- or gender-related differences in the nephrotoxicity or bioavailability of various compounds may aid in the development of more effective therapeutic strategies.
Acknowledgments
The authors would like to thank Ning Li and Susan Buist for their technical assistance.
Footnotes
-
↵1 Present address: Department of Drug Metabolism, Merck Research Laboratories, Rahway, NJ 07065.
-
A.L.S., N.J.C., D.P.H, and T.M.L. were supported by National Institutes of Health Grant ES-09649.
- Abbreviations used are::
- TEA
- tetraethylammonium
- OCT
- organic cation transporter
- bDNA
- branched DNA
- RLU
- relative light units
- OC
- organic cation
- Received August 13, 2001.
- Accepted November 9, 2001.
- The American Society for Pharmacology and Experimental Therapeutics


