


Cryopreserved human hepatocytes suspended in human plasma (HHSHP) represent an integrated metabolic environment for predicting drug-drug interactions (DDIs). In this study, 13 CYP3A reversible and/or time-dependent inhibitors (TDIs) were incubated with HHSHP for 20 min over a range of concentrations after which midazolam 1′-hydroxylation was used to measure CYP3A activity. This single incubation time method yielded IC50 values for the 13 inhibitors. For each CYP3A inhibitor-victim drug pair, the IC50 value was combined with total average plasma concentration of the inhibitor in humans, fraction of the victim drug cleared by CYP3A, and intestinal availability of the victim drug to predict the ratio of plasma area under the curve of the victim drug in the presence and absence of inhibitor. Of 52 clinical DDI studies using these 13 inhibitors identified in the literature, 85% were predicted by this method within 2-fold of the observed change, and all were predicted within 3-fold. Subsequent studies to determine mechanism (reversible and time-dependent inhibitors) were performed by using a range of incubation periods and inhibitor concentrations. This system differentiated among reversible inhibitors, TDIs, and the combination of both. When the reversible and inactivation parameters were incorporated into predictive models, 65% of 52 clinical DDIs were predicted within 2-fold of the observed changes and 88% were within 3-fold. Thus, HHSHP produced accurate DDI predictions with a simple IC50 determined at a single incubation time regardless of the inhibition mechanism; further if needed, the mechanism(s) of inhibition can be identified.
Introduction
The inhibition of cytochrome P450 3A enzymes in the intestine and liver is responsible for many clinically important drug-drug interactions (DDIs) (Gomez et al., 1995; Gorski et al., 1998; Galetin et al., 2008). It is now a standard practice during drug development to predict the ability of candidate drugs to inhibit the cytochromes P450, including CYP3As, using in vitro enzyme kinetic data generated from human liver microsomes (HLM) (Bjornsson et al., 2003a,b). These in vitro P450 inhibition parameters have facilitated the assessment of risk and predicted the potential magnitude of DDIs when combined with measures or predictions of human drug exposure, but the approach is time-consuming and has significant limitations. The state-of-the art prediction of an in vivo P450-mediated, inhibitory DDI requires estimation of the reversible inhibition constant (Ki), the irreversible inhibition parameters (KI and kinact), the fraction unbound in plasma (fu, p), and the fraction unbound in the microsomal system (fu, mic) (Wang et al., 2004). Sophisticated models using static or dynamic drug concentration have been developed to integrate this dataset and predict an in vivo DDI for a given drug dosing regimen (Obach et al., 2006; Einolf, 2007; Fahmi et al., 2009; Xu et al., 2009; Rowland Yeo et al., 2010). However, the predictions are often false-positive or false-negative and fail to correctly categorize inhibitors as weak, moderate, and strong in vivo inhibitors (Xu et al., 2009). Therefore, a consensus on the most appropriate predictive framework to be used during the development of a new drug candidate has not been reached.
Cryopreserved human hepatocytes suspended in well defined serum-free media have been used to estimate time-dependent inhibition parameters for diltiazem, verapamil, erythromycin, clarithromycin, and troleandomycin and combined with the Simcyp population-based absorption, distribution, metabolism, and excretion simulator to accurately predict CYP3A-mediated DDIs (Xu et al., 2009). The value of this approach for predicting reversible inhibition was not assessed by these authors. Cryopreserved human hepatocytes suspended in human plasma (HHSHP) represent a convenient, integrated metabolic environment for estimating the extent and mechanism of human DDIs. Lu et al. (2007, 2008a,b) have used the HHSHP system to quantitatively determine the inhibition of various P450s by ketoconazole and fluconazole. With use of this information, P450-mediated changes in the area under the curve (AUC) of several victim drugs were predicted accurately for DDIs involving these two prototypical competitive inhibitors, but the applicability to mechanism-based inhibitors was not addressed. Compared with in vitro systems using HLM, human hepatocytes suspended in human plasma inherently account for several parameters: 1) the plasma protein and microsomal binding of drug, 2) compound availability to the enzyme in its native environment within the cell, and 3) metabolism of the compound by both P450 and non-P450 pathways including the potential for the formation of inhibitory metabolites.
The primary objective of the current study using HHSHP was to quantify the ability of a simple, single incubation time method to assess the CYP3A inhibition by a test compound to predict clinical DDIs without knowledge of the inhibition mechanism. A secondary aim was to identify the inhibition mechanism and compare the clinical DDI prediction based on the appropriate mechanistic models with those from the single incubation time method.
Materials and Methods
Materials.
Cryopreserved human hepatocytes and InVitro GRO HT Medium were obtained from Celsis In Vitro Technologies, Inc. (Baltimore, MD). Midazolam, 1′-hydroxymidazolam, and [13C5]1′-hydroxymidazolam were obtained from BD Gentest (Woburn, MA). Conivaptan was obtained internally. Clarithromycin, diltiazem, erythromycin, fluconazole, itraconazole, ketoconazole, nefazodone, and troleandomycin were obtained from Sigma-Aldrich (St. Louis, MO). Aprepitant, ritonavir, saquinavir, and voriconazole were obtained from Toronto Research Chemicals (North York, ON, Canada). Human plasma (Na-heparin) was obtained from Lampire Biological Laboratories, Inc. (Pipersville, PA). Hepatocyte Maintenance Medium was obtained from Lonza Walkersville, Inc. (Walkersville, MD).
Hepatocyte Studies.
Hepatocytes (pool of five individuals) were thawed in InVitro GRO HT Medium (25 ml/5 million hepatocytes) and centrifuged at 50g at room temperature for 5 min. The cell pellet was reconstituted in Hepatocyte Maintenance Medium, and cell viability was found to be at least 80% using a Vi-Cell XR cell viability analyzer (Beckman Coulter Inc., Fullerton, CA). After the cell viability was determined, hepatocytes were centrifuged at 50g at room temperature for 5 min and resuspended in human plasma (2 × 10⁶ cells/ml). The cell suspension was incubated at 37°C with 5% CO2 until the addition of putative enzyme inhibitors.
Inhibition studies.
The final inhibitor concentrations in human plasma were 0.13 to 100 μM for aprepitant, fluconazole, voriconazole, clarithromycin, conivaptan, diltiazem, erythromycin, itraconazole, nefazodone, and troleandomycin, 0.03 to 20 μM for ketoconazole and ritonavir, and 0.07 to 50 μM for saquinavir. The final organic vehicle concentration was 0.5% methanol. The incubations were performed in triplicate. A stock hepatocyte suspension (25 μl) was added to 50 μl of inhibitor-containing plasma such that the final concentration of hepatocytes was 0.5 × 10⁶ cells/ml in human plasma and incubated for 20 min (37°C, 5% CO2) before the addition of midazolam. To assess the effect of incubation time, cells were incubated with inhibitors for 0, 10, and 20 min before the addition of midazolam. Midazolam (25 μl in human plasma; final concentration 30 μM) was added to the cell suspension, and a further 35 min of incubation was used to quantify the remaining CYP3A activity. The reactions were terminated by adding 200 μl of acetonitrile-methanol (3:1, v/v) containing 150 nM [13C5]1′-OH-midazolam as an internal standard. Samples were centrifuged at 4000 rpm for 20 min, and an aliquot of the supernatant was analyzed by liquid chromatography-tandem mass spectrometry. Preliminary experiments demonstrated that these incubation conditions resulted in linear formation of 1′-hydroxymidazolam with respect to the incubation time and the hepatocyte concentration. The formation of 1′-hydroxymidazolam was linear for 80 min.
Liquid chromatography/tandem mass spectrometry methods.
Quantification of 1′-OH-midazolam was achieved using a high-performance liquid chromatograph (Shimadzu LC10) interfaced to a triple quadrupole mass spectrometer (Sciex API 4000; Applied Biosystems, Foster City, CA). Chromatographic separation was achieved using a reverse-phase column (Synergi Hydro-RP 4 μm column, 100 × 2 mm; Phenomenex, Torrance, CA) with a gradient consisting of 5% methanol in 5 mM ammonium acetate (mobile phase A) and 95% methanol in 5 mM ammonium acetate (mobile phase B) at a flow rate of 0.4 ml/min with a 25-μl injection volume. In particular, 70% of mobile phase B was increased linearly to 80% from 0 to 2 min and increased to 100% in the next 0.05 min. Mobile phase B was held at 100% from 2.05 to 2.30 min, and the column was reequilibrated to 70% B. The electrospray ionization probe was run in the positive ion mode with probe temperature of 600°C. The m/z transitions of 1′-OH-midazolam and [13C5]1′-OH-midazolam were 342 → 324 and 347 → 329, respectively. The lower and upper limits of quantification were 0.5 and 234 pmol of 1′-OH-midazolam, respectively, per 100-μl well incubation. The interday accuracy ranged from −4.97 to 10.26%, and the intraday accuracy ranged from −6.13 to 11.09%. The interday precision ranged from 2.47 to 8.15%, and the intraday precision ranged from 1.70 to 13.15%.
Analysis of Inhibition Data.
The relationship between CYP3A activity at a given time and inhibitor concentration relative to baseline CYP3A activity was used to determine an IC50. All data were analyzed using the average of triplicate determinations. IC50 values were calculated with the model (eq. 1) by weighted nonlinear regression (WinNonlin 5.0; Pharsight, Mountain View, CA):
 where X is the nominal concentration of an inhibitor, Y represents the percentage of baseline CYP3A activity remaining, a is the estimated response at zero concentration of inhibitor, and γ is the slope factor that describes the steepness of the curve.
Three inhibition models (eqs. 2–4) incorporating irreversible inhibition (model B), reversible inhibition (model C), or both (model A), were used to estimate the inactivation parameters (KI and kinact) and/or reversible inhibition constant (Ki) for each inhibitor when three IC50 curves obtained from different incubation times were simultaneously fitted using weighted nonlinear regression. The most appropriate model was chosen using the following goodness-of-fit criteria: visual inspection, randomness of the residuals, and the S.E. of the parameter estimates.
Model A:

Model B

Model C

In eqs. 2 to 4, t is the time during which the inhibitors are in contact with human hepatocytes before the addition of midazolam (0, 10, or 20 min). V35+t, [I] represents the formation rate of 1′-OH-midazolam at a given concentration of the inhibitor and total time (total time = 35 min with midazolam plus t minutes without midazolam), and V35+t, [0] is the formation rate of 1′-OH-midazolam for the corresponding vehicle control (no inhibitor) at the same incubation time. The ratio of V35+t, [I] and V35+t, [0] normalizes the baseline for the enzyme activity for the specific incubation time. Km is the Michaelis-Menten constant for 1′-OH-midazolam formation in HHSHP (45 μM, based on total and not unbound midazolam concentration; data not shown), and [S] is midazolam concentration (30 μM). Vmax, 35+t represents the maximum rate of 1′-OH-midazolam formation at some total time. The rate of 1′-OH-midazolam formation varied with incubation time, and consequently the ratio of Vmax, 35+t and V35+t, [0] was estimated by models A to C (eqs. 2–4). [I] is the nominal inhibitor concentration, assuming no inhibitor depletion during the incubation. KI is the inhibitor concentration required for half-maximal inactivation, kinact is the maximum inactivation rate constant, and Ki is the reversible inhibition equilibrium constant.
All raw data were fitted to model A. If the parameters Ki, kinact, and KI had the lowest percent CV when estimated by model A from the simultaneous fitting of three sets of data corresponding to the ratio of 1′-OH-midazolam formation rate versus inhibitor concentrations using weighted nonlinear regression, the compound was suggested to be a reversible and time-dependent inhibitor. For compounds for which model A was able to estimate the inactivation parameters (KI and kinact) but not the reversible inhibition constant Ki, the raw data were fitted to model B, which only estimates the inactivation parameters (KI and kinact). For compounds for which model A was able to estimate the reversible inhibition constant Ki but not the inactivation parameters (KI and kinact), the raw data were fitted to model C, which only estimates the reversible inhibition constant Ki.
Predictions of Drug-Drug Interactions.
The single incubation time method.
A generic model (eq. 5) of enzyme inhibition was used to predict a potential increase in exposure to a drug as a result of the inhibition of hepatic and intestinal CYP3A (Ito et al., 1998; Wang et al., 2004; Obach et al., 2006). All assays were performed at a substrate concentration close to the Km of midazolam (data not shown). The inhibition mechanism may be unknown for some inhibitors; nevertheless the assumption that Ki, app = IC50/2 was applied (Obach et al., 2007). For competitive inhibitors, the Ki, app would be equivalent to the inhibition constant Ki. In the case of TDIs that display mechanism-based inhibition, Ki, app would be equivalent to KI × kdeg/kinact when [I] ≪ KI (Wang et al., 2004).
 where AUCp.o., i/AUCp.o. is the predicted ratio of in vivo exposure of a CYP3A-cleared drug with oral coadministration of the inhibitor versus that in the control state, fm, CYP3A is the fraction of total clearance of the affected drug to which CYP3A contributes, and Fg is the fraction of the dose of the affected drug that passes through the intestine unchanged after oral administration in the control state.
The fraction of object drug metabolized by CYP3A (fm, CYP3A) was assumed to be the same as that observed previously for midazolam, sildenafil, fentanyl, triazolam, zolpidem, alprazolam, and trazodone (0.93, 0.79, 0.5, 0.8, 0.6, 0.8, and 0.35, respectively) (Obach et al., 2006). The fraction of drug metabolized by CYP3A in the intestine was assumed to be 1, and the Fg values for midazolam, sildenafil, triazolam, alprazolam, and trazodone were assumed to be 0.57, 0.38, 0.44, 0.88, and 0.75, respectively, as described previously (Ernest et al., 2005; Obach et al., 2006). [I] is collected from three main sources (details in Supplemental Table 1). The average systemic plasma concentration of the inhibitor [plasma concentration area under curve from 0 to the dosing interval (AUC0–τ) divided by the dosing interval] observed or calculated in the primary literature was preferred. In some cases this was not available, and then the plasma inhibitor concentration at a certain time point (e.g., when the victim drug was administered) reported in the primary literature was used. If the inhibitor concentration was not reported in the primary literature, values were obtained from secondary literature sources (Einolf, 2007; Fahmi et al., 2008, 2009). These values were previously derived from other literature sources in which similar dosing regimens were used for individual inhibitors. The IC50 values are based on total inhibitor concentration in plasma, and consequently there is no need to use unbound plasma concentrations in the predictions. For the prediction of intestinal inhibition, Ki, app values were converted to unbound values (Ki, app × fu) consistent with the assumption of no significant protein binding in the gut lumen. The fraction unbound in human plasma for each compound was taken from Goodman & Gilman's The Pharmacological Basis of Therapeutics (Hardman et al., 2001).
The concentration of the inhibitor in the enterocyte during absorption ([I]g) was estimated based on the assumptions 1) that there was no significant protein binding in the gut lumen and 2) that inhibitors were not subject to any first-pass metabolism (Rostami-Hodjegan, 2004; Galetin et al., 2008) (eq. 6):
 where D is the dose of the inhibitor (milligrams), ka is the oral absorption rate constant of the inhibitor, Fa is the fraction of the inhibitor absorbed into the gut wall from the intestinal lumen after oral administration, Qent represents the blood flow to the enterocyte, and MW is the molecular weight. For ka and Qent, values of 0.03 min−1 and 248 ml/min were used, respectively (Obach et al., 2006). An Fa value of 1 was used for all drugs (Einolf, 2007).
In the current investigation, there were 12 clinical studies in which victim drugs were given intravenously. Among these 12 studies, midazolam was the victim drug in 11 clinical studies, and the inhibitors were ketoconazole, aprepitant, conivaptan, voriconazole, troleandomycin, erythromycin, clarithromycin, diltiazem, and saquinavir. In the other clinical study, fentanyl was the victim drug and ritonavir was the inhibitor. For these 12 studies, the AUC ratio was predicted using eq. 7, in which the hepatic extraction ratio (EH) of the victim drug is accounted for in the DDI prediction (Kirby and Unadkat, 2010). Midazolam was assigned an EH of 0.4 (mean value calculated from the 11 clinical studies), and fentanyl was assigned a value of 0.7 (Olkkola et al., 1999):

The mechanistic method.
According to the inhibition mechanism, the magnitude of DDIs involving each inhibitor was predicted using the appropriate models. For drugs identified as reversible inhibitors, AUC ratios were calculated by eq. 5, where Ki, app was equal to the Ki estimated by model C.
For drugs identified as TDIs with model B, AUC ratios were calculated using eq. 8 (Mayhew et al., 2000; Wang et al., 2004):
 where kdeg is the first-order rate constant of in vivo degradation of the affected enzyme. The values of kdeg used for intestinal (kdeg, CYP3A, g) and hepatic CYP3A (kdeg, CYP3A, h) were 0.000481 min−1 (t1/2 = 24 h) and 0.000321 min−1 (t1/2 = 36 h), respectively (Wang et al., 2004; Obach et al., 2007; Quinney et al., 2010; Wang, 2010). For the 12 clinical studies involving intravenous administration of the victim drug, the AUC ratio was predicted using eq. 9 (Kirby and Unadkat, 2010):
 For drugs identified as reversible and time-dependent inhibitors with model A, the AUC ratio was calculated using eq. 10 (Fahmi et al., 2008). For the ritonavir and intravenous fentanyl DDI, the AUC ratio was predicted using eq. 11 (Kirby and Unadkat, 2010).


Data Source.
Data from 52 clinical DDI studies were collected from the literature after having been identified by the University of Washington Metabolism and Transport Drug Interaction Database (http://www.druginteractioninfo.org/). Forty-six clinical DDI studies involved the inhibition of midazolam metabolism, 5 studies involved the inhibition of alprazolam, fentanyl, sildenafil, trazodone, and triazolam metabolism by ritonavir, and 1 study involved the inhibition of sildenafil by saquinavir. The database was accessed on January 29, 2009, and the data are reported in Table 3.
Data Analysis.
Among 52 clinical DDIs, there are 22 strong interactions (AUC ratio >5), 26 moderate interactions (2 ≤ AUC ratio ≤5), and 4 weak interactions (1 ≤ AUC ratio <2). Two methods were used to quantify the accuracy of predicted DDIs. One was to compare the fold error of predicted and observed values of the AUC ratio (2-fold cutoff). The other method, called “categorical prediction,” is based on the definition of strong interactions, moderate interactions, and weak interactions.
Results
Enzyme Inhibition Parameter Estimation.
The 13 known CYP3A inhibitors represented reversible inhibitors (ketoconazole as a strong reversible inhibitor and fluconazole as a moderate inhibitor) and TDIs (TAO as a strong TDI, diltiazem as a moderate TDI, and erythromycin as a weak TDI) that displayed a wide range of plasma protein binding (itraconazole and ketoconazole with high protein binding, voriconazole and clarithromycin with moderate protein binding, and fluconazole with low protein binding). These inhibitors were incubated with human hepatocytes suspended in human plasma for 20 min over a range of concentrations in the absence of midazolam and a further 35 min in the presence of midazolam (30 μM). The IC50 value for each inhibitor was estimated using eq. 1 and the values are shown in Table 1. For ketoconazole and fluconazole, the IC50 values obtained here were similar to those observed by Lu et al. (2007, 2008a,b) using a comparable procedure. On the basis of the assumption that the nominal concentration of inhibitor is close to the extracellular concentration, these IC50 values represent the total (bound and unbound) concentration of the inhibitors that inhibit 50% of CYP3A activity, and thus there was no correction of fraction unbound in plasma for the IC50 values. As shown in Table 1, ritonavir was the most potent inhibitor with the lowest IC50 value, whereas aprepitant had the highest IC50 value among the 13 drugs studied. In additional studies, incubation times of 0, 10, and 20 min (with inhibitors alone) were used to generate IC50 values (Table 1). The IC50 value at 20 min in the two independent studies showed very good agreement (Table 1).
IC50 values of inhibitors from human hepatocytes suspended in human plasma: single IC50 assessment (20-min inhibitor incubation alone) and independent multiple IC50 assessment (0-, 10-, and 20-min inhibitor incubation alone)
Each number represents the mean ± S.E. of estimate of triplicate determinations.
To define the inhibition mechanism for each inhibitor, models of reversible inhibition (model C), irreversible inhibition (model B), and combined reversible and irreversible inhibition (models A) were used (eqs. 3–5). Examples of the results of the best fit for four representative drugs (ketoconazole, erythromycin, itraconazole, and ritonavir) are shown in Fig. 1, a–d, and the in vitro inhibition constants for each inhibitor obtained from the best model fit analyses are listed in Table 2. The process of defining the inhibition mechanism used the following three steps. First, all raw data were fitted to the combined reversible plus irreversible model (model A). The fit of model A indicated that ketoconazole is a reversible inhibitor but not a TDI because model A was able to estimate the reversible inhibition constant Ki but not the inactivation parameters (KI and kinact). This observation was also the case with fluconazole, aprepitant, and voriconazole, which is not unexpected because these compounds are all known reversible inhibitors (Ito et al., 1998). A second group of compounds (erythromycin, nefazodone, troleandomycin, clarithromycin, diltiazem, itraconazole, and saquinavir) were identified as TDIs only, because model A was able to estimate the inactivation parameters (KI and kinact) for each with reasonable precision but not the reversible inhibition constant Ki. Ritonavir represents a potential third group of compounds as it was suggested to be a reversible and time-dependent inhibitor because both the reversible inhibition constant Ki and the inactivation parameters (KI and kinact) were well estimated (Fig. 1d; Table 2).

Relationship between the relative CYP3A activity and inhibitor concentration. The relative CYP3A activity is determined as the rate of 1′-OH-midazolam formation in the presence of inhibitor to that in the absence of inhibitor. The best fit among three models for each inhibitor was chosen and is presented as follows: a, ketoconazole by model C; b, erythromycin by model B; c, itraconazole by model B; d, ritonavir by model A. The closed circles represent the 0-min inhibitor incubation alone, and the solid lines represent the best fits for the 0-min inhibitor concentration. The closed diamonds represent the 10-min inhibitor incubation alone, and the long dashed lines represent the best fits for the 10-min inhibitor concentration. The closed squares represent the 20-min inhibitor incubation alone, and the dotted lines represent the best fits for the 20 min-inhibitor concentration.
Inhibition constants predicted from the best fit of models A to C
In the second step of assigning a mechanism, inhibitors that were initially assigned as TDIs only were further analyzed using the model for irreversible inhibition (model B), which only estimates the inactivation parameters (KI and kinact). Better fitting of the data and more precise (less percent CV) estimates of inactivation parameters of these inhibitors (TDI only) were obtained using model B (Fig. 1, b and c; Table 2). For example, the fit of erythromycin to model A resulted in the mean estimate and the S.E. of the estimates of kinact, KI, and Ki as 0.08 ± 0.07 min−1 (87.50% CV), 35.09 ± 31.92 μM (90.97% CV), and 497.65 ± 8311.13 μM (1670.09% CV), whereas the results were significantly better when the data were fit to model B, yielding the values of kinact and KI as 0.08 ± 0.005 min−1 (6.25% CV) and 25.15 ± 4.90 μM (19.48% CV), respectively. In the third step, inhibitors that were identified as purely reversible inhibitors in the first step were analyzed using model C, which only estimates the reversible inhibition constant Ki. Better fitting of the data and more precise (less percent CV) estimates of Ki for these inhibitors were obtained using model C (Fig. 1a; Table 2). For example, the fit of ketoconazole to model A resulted in the mean estimate and the S.E. of the estimates of kinact, KI, and Ki as 0.000003 ± 0.2 min−1 (7686821% CV), 32.67 ± 8543863 μM (10845820% CV), and 0.61 ± 0.18 μM (29.51% CV), whereas the results were significantly better when the data were fit to model C, yielding the value of Ki as 0.59 ± 0.09 μM (15.25% CV). In addition, model C also fitted the ritonavir data well, which was not surprising because the compound was reported as a very potent reversible inhibitor as well as a TDI in HLM (Ernest et al., 2005). Thus, the inhibition constants of ritonavir estimated from both models are included in Table 2.
Prediction of DDIs.
The in vitro inhibition constants for the 13 CYP3A inhibitors studied were used to predict 52 clinical DDIs (Table 3) using the single incubation time method and mechanistic method. In these studies, for 12 of the 13 inhibitors the victim drug was midazolam; for ritonavir the victim drugs were sildenafil, fentanyl (intravenous), triazolam, alprazolam, and trazodone; and for saquinavir one of the victim drugs was sildenafil.
Predictions of CYP3A-mediated DDIs from in vitro inhibition parameters using the single incubation time method and the mechanistic method (52 clinical DDIs/13 drugs)
The single incubation time method: IC50 values from a 20-min incubation with inhibitor alone.
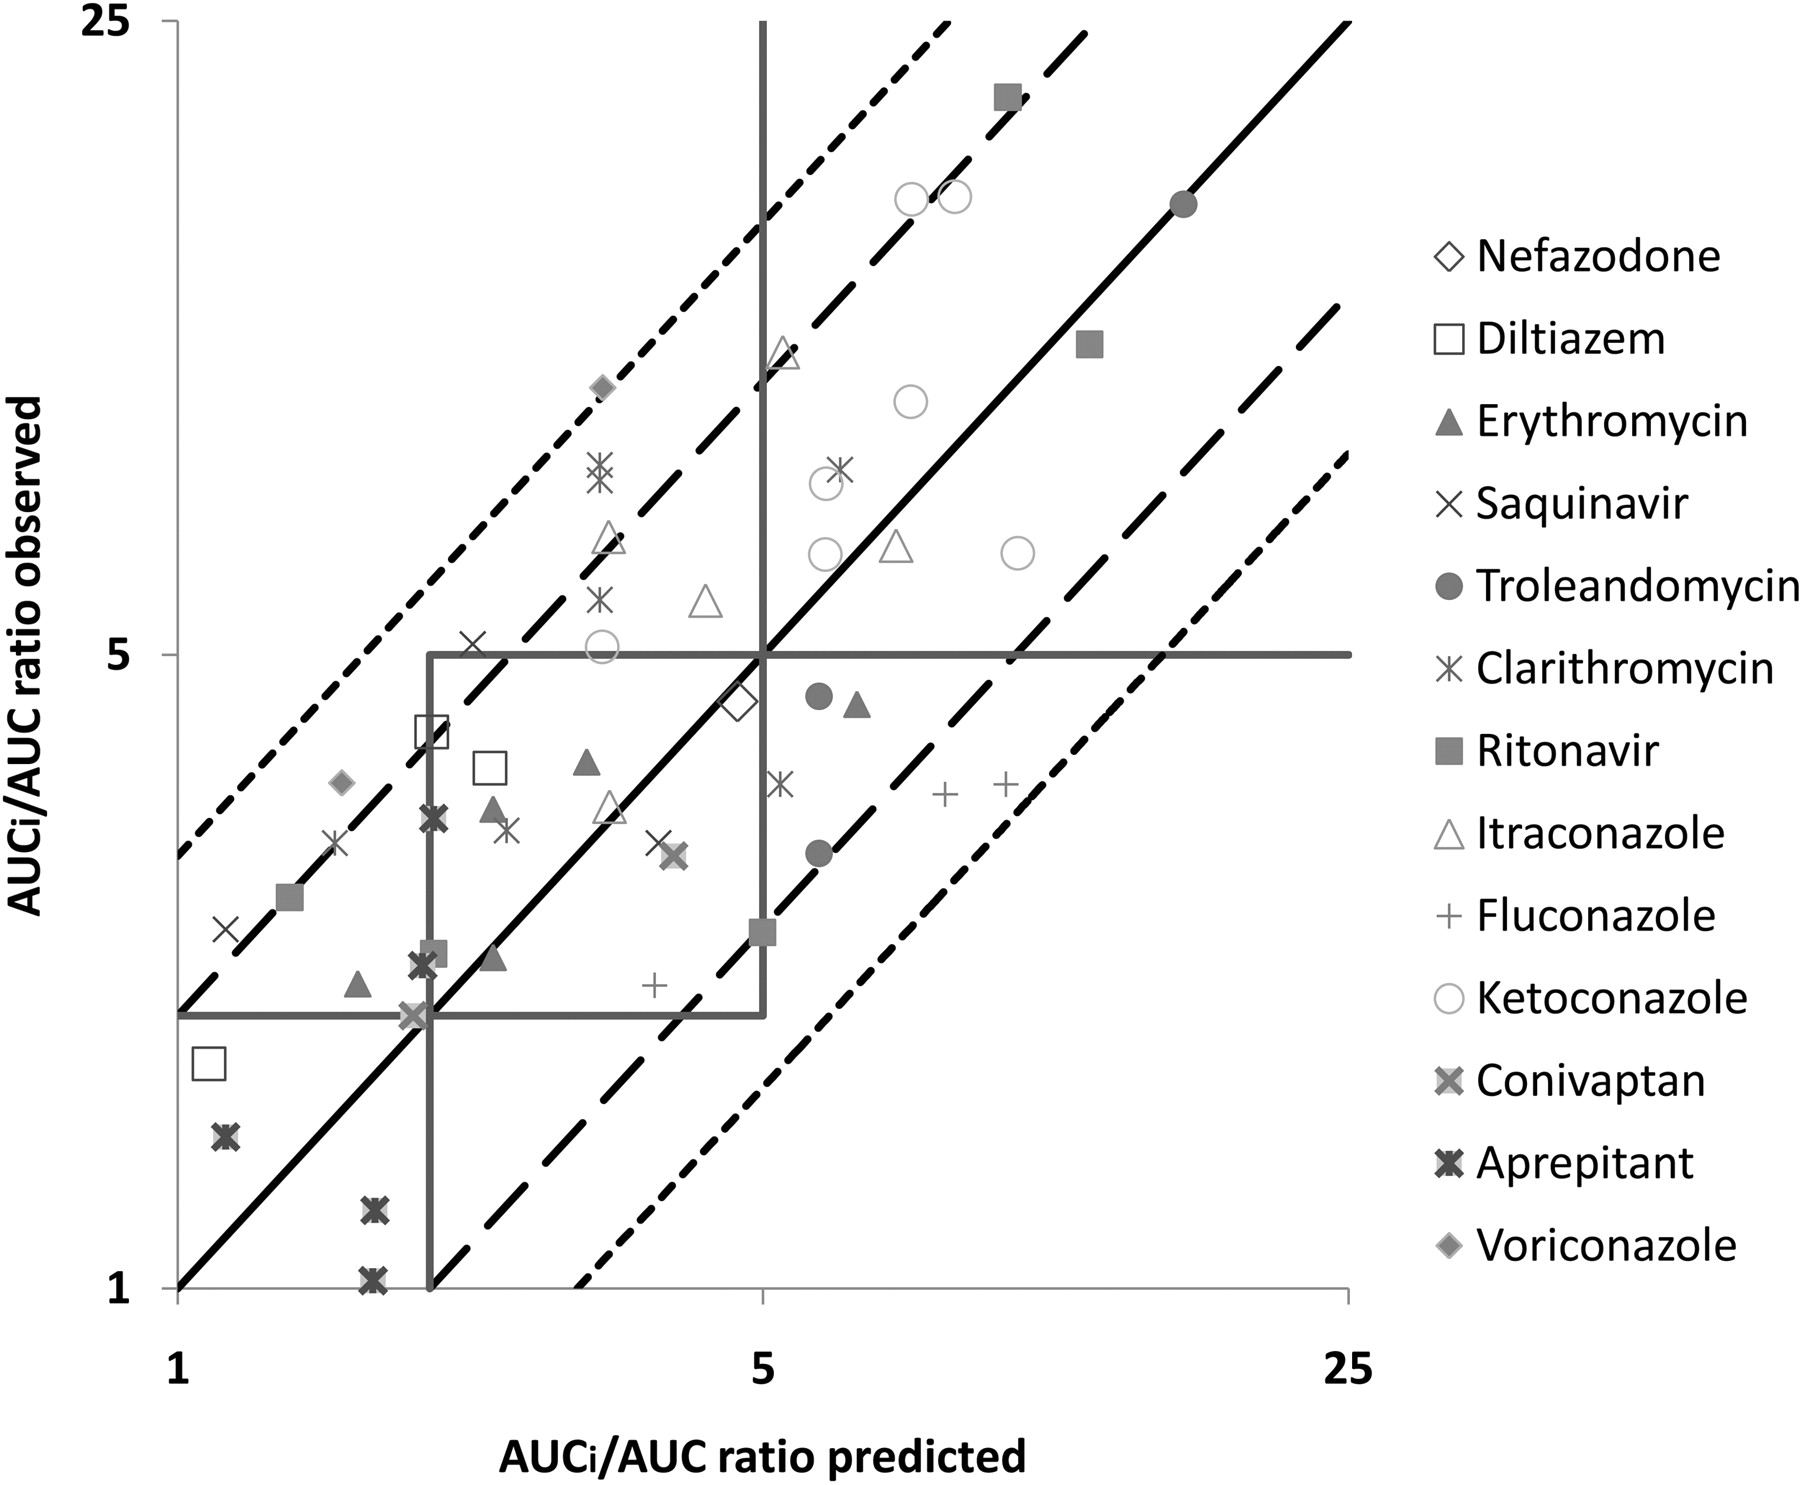
IC50 values from a 20-min incubation time with inhibitor and a further 35 min of incubation with midazolam were converted to Ki, app (Ki, app = IC50/2) and used in eqs. 5 and 7 to predict the extent of DDI in vivo. The total average systemic plasma concentration of each inhibitor was used as [I]. Because in vitro parameters were estimated relative to total plasma concentration, there was no need for correction for the fraction unbound in plasma for [I] (Table 3); [I]g was calculated using eq. 6. The predicted and observed AUC ratios are listed in Table 3, and a plot of predicted DDIs versus observed values from clinical studies is shown in Fig. 2. The single incubation time method correctly classified DDIs in 12 of 20 strong interactions (60% accuracy), 15 of 28 moderate interactions (54% accuracy), and 4 of 4 weak interactions (100% accuracy) (Fig. 2). Using the criteria of within 2-fold of the observed value for an accurately predicted DDI, this approach correctly predicted 44 of 52 clinical DDIs (85% accuracy) (Fig. 2). The predictions for the remaining outliners (8 of 52) were within 3-fold of the observed values and included 2 cases for fluconazole, 2 cases for voriconazole, 2 cases for saquinavir, and 2 cases for clarithromycin. There were no false-positive or false-negative predictions.

The single incubation time method: comparison of observed versus predicted AUC ratios. The square boxes correspond to areas of weak (1- to 2-fold increase in AUC ratio), moderate (2- to 5-fold increase in AUC ratio), and strong (>5-fold increase in AUC ratio) inhibition. The solid line depicts the line of unity, the long dashed line represents a 2-fold deviation from unity, and the short dashed line represents a 3-fold deviation from unity (13 drugs and 52 clinical DDIs).
The mechanistic method: using in vitro parameters estimated by models A to C.
As described under Materials and Methods, each DDI was also predicted according to the inhibition mechanism of the compound. The magnitude of DDIs for the four reversible inhibitors (ketoconazole, aprepitant, fluconazole, and voriconazole identified by model C) was predicted by eqs. 5 and 7. DDIs with the eight TDIs (troleandomycin, saquinavir, clarithromycin, conivaptan, diltiazem, erythromycin, itraconazole, and nefazodone identified by model B) were predicted by eqs. 8 and 9. DDIs with ritonavir, which was identified as a reversible and time-dependent inhibitor by model A, were predicted by eqs. 10 and 11. The total average systemic plasma concentration of each inhibitor was used as [I] because in vitro parameters were estimated relative to total plasma concentration (Table 3); [I]g was calculated using eq. 6. Predicted AUC ratios are listed in Table 3, and plots of predicted DDIs versus observed values from clinical studies are shown in Fig. 3. This approach correctly classified DDIs in 18 of 20 strong interactions (90% accuracy), 4 of 28 moderate interactions (14% accuracy), and 3 of 4 weak interactions (75% accuracy), respectively (Fig. 3). This approach predicted 34 of 52 clinical DDIs (65% accuracy) within 2-fold of the observed AUC changes and 46 of 52 clinical DDIs (88% accuracy) within 3-fold (Fig. 3). Predictions that were more than 3-fold different from observed values involved one case for saquinavir, one case for erythromycin, one case for clarithromycin, one case for diltiazem, and two cases for conivaptan. There were no false-positive or false-negative predictions.

The mechanistic method: comparison of observed versus predicted AUC ratios (13 drugs and 52 clinical DDIs). The square boxes correspond to areas of weak (1- to 2-fold increase in AUC ratio), moderate (2- to 5-fold increase in AUC ratio), and strong (>5-fold increase in AUC ratio) inhibition. The solid line depicts the line of unity, the long dashed line represents a 2-fold deviation from unity, and the short dashed line represents a 3-fold deviation from unity.
Predictive performance of the single incubation time method for each of the three inhibition mechanisms.
Eight inhibitors were identified as TDIs by model B, and the single incubation time method correctly classified the DDI caused by these 8 TDIs in 4 of 10 strong interactions (40% accuracy), 9 of 19 moderate interactions (47% accuracy), and 1 of 1 weak interaction (100% accuracy). For 4 reversible inhibitors, the single incubation time method correctly classified the DDIs in 6 of 8 strong interactions (75% accuracy), 4 of 6 moderate interactions (67% accuracy), and 3 of 3 weak interactions (100% accuracy). For ritonavir, the single incubation time method correctly classified DDIs in four interactions (75% accuracy). When the 2-fold cutoff criterion was used to evaluate the performance of the single incubation time method, 25 of 30 clinical DDIs were predicted correctly for TDIs (83% accuracy), 14 of 17 clinical DDIs were predicted correctly for reversible inhibitors (82% accuracy), and 5 of 5 clinical DDIs were predicted correctly for the reversible and time-dependent inhibitor ritonavir (100% accuracy). This retrospective analysis suggested that the single incubation time method was a strong predictor of DDIs due to TDIs as well as reversible inhibitors when the 2-fold criterion was used.
Discussion
Hepatocytes suspended in well defined serum-free media have previously been demonstrated to be a useful system for the estimation of CYP3A inhibition parameters (Zhao et al., 2005; McGinnity et al., 2006; Brown et al., 2007; Xu et al., 2009). Zhao et al. (2005) evaluated time-dependent inactivation of CYP3A in cryopreserved human hepatocytes for six drugs (amprenavir, diclofenac, diltiazem, erythromycin, raloxifene, and TAO), and the IC50 values for hepatocytes were 2- to 60-fold higher than those for HLM after correcting for factors such as nonspecific binding and inhibitor consumption in hepatocytes. McGinnity et al. (2006) incubated three CYP3A inhibitors (erythromycin, TAO, and fluoxetine) with cultured primary human hepatocytes for 48 h, and the parameters associated with irreversible inhibition were in good agreement with those generated with HLM, although lower values of kinact were observed in both hepatocytes and HLM systems compared with recombinant CYP3A. Brown et al. (2007) investigated six drugs (miconazole, ketoconazole, fluconazole, quinine, fluoxetine, and fluvoxamine) in both rat microsomes and freshly isolated rat hepatocytes and indicated that these systems gave similar estimates of inhibitory potency after correction for nonspecific binding in each system for these CYP3A inhibitors. However, although all three studies noted above (Zhao et al., 2005; McGinnity et al., 2006; Brown et al., 2007) compared the in vitro inhibition parameters generated from microsomes with those from hepatocytes, the question of whether the parameters generated from hepatocytes resulted in an improved ability to predict human DDIs was not addressed. Xu et al. (2009) noted that the values of kinact in HLM were higher and the values of unbound KI in HLM were lower than those estimated in cryopreserved human hepatocytes. The in vitro inactivation parameters from cryopreserved human hepatocytes resulted in good overall prediction of in vivo DDI extent, but there was a systematic overprediction with HLM data (Xu et al., 2009), and both hepatocyte and HLM prediction resulted in several false-negative predictions. Lu et al. (2007, 2008a,b) expanded the utility of cryopreserved human hepatocytes by using a suspension in human plasma and demonstrated good agreement between predicted and observed clinical DDIs involving two known CYP3A inhibitors, ketoconazole and fluconazole. In the present report, the utility of cryopreserved human hepatocytes suspended in human plasma to predict in vivo DDIs was further explored using 13 reversible and time-dependent inhibitors of CYP3A and midazolam as the probe substrate.
The approach to predicting CYP3A DDIs used in the current report did not focus on an initial characterization of the mechanism of inhibition but rather used a single IC50 measurement in hepatocytes suspended in human plasma; an analogous approach has been described in the HLM system (Obach et al., 2007; Grime et al., 2009; Burt et al., 2010). This single incubation time method captures both reversible and time-dependent inhibitors by using appropriate experimental conditions. In these studies, 0.5 × 10⁶ cryopreserved hepatocytes/ml were used because this is similar to 0.17 mg/ml HLM protein, a concentration commonly used in studies in HLM (based on the scaling factors of 120 × 106 hepatocytes cells/g liver and 40 mg HLM/g liver). The inhibitor-alone incubation time with hepatocytes was 20 min, and this would be expected to result in almost complete CYP3A inactivation given a typical HLM kinact value of approximately 0.1 min−1. However, it should be noted that the values of kinact of clarithromycin and saquinavir were 0.064 and 0.033, respectively (t1/2, respectively, of 11.55 and 20.02 min), and these relatively low values likely contributed to the DDI underprediction for these two compounds (Table 3). The concentration of midazolam used to determine residual CYP3A activity (30 μM) was close to the Km value of 45 μM in HHSHP (preliminary experiments; the estimate is based on total and not unbound midazolam concentration) to capture reversible inhibition in the IC50 measurement. The formation of 1′-hydroxymidazolam over a 35-min incubation time was used to quantify CYP3A activity. Under these conditions, metabolite formation was linear over time and yielded a sufficient analytical response to characterize extensive CYP3A inhibition.
The results presented demonstrate that an IC50 value generated from a single incubation time was able to adequately predict the magnitude of an in vivo DDI (Table 3; Fig. 2). This IC50 value is combined with the total average systemic plasma concentration of the inhibitor in a predictive model that incorporates the fraction of the victim drug cleared by CYP3A and intestinal availability of the victim drug (eq. 5). This approach differs from previous approaches wherein the mechanism(s) of inhibition needed to be identified before the parameter estimation in vitro and DDI prediction in vivo. The single incubation time method was able to predict 85% of 52 clinical CYP3A DDI studies within 2-fold of the observed change in AUC regardless of the inhibition mechanism (Fig. 2). The high rate of successful prediction of DDI suggests that this relatively simple, mechanism-independent approach will be of great use to determine the potential for CYP3A-mediated DDIs for new candidates and previously uncharacterized molecules. This single incubation time approach to predicting DDIs may be particularly useful for molecules with a potential for exhibiting time-dependent inhibition in the early discovery stage when the standard time-consuming process of estimating the inactivation parameters (KI and kinact) in HLM may not be feasible. Although the single time point method may not provide the inhibition mechanism, it was able to accurately predict the DDIs related to 8 TDIs. Among these 8 TDIs, itraconazole is believed to exhibit time-dependent inhibition because of the inhibitory metabolite formation (Isoherranen et al., 2004; Kunze et al., 2006; Quinney et al., 2008a; Templeton et al., 2008), whereas the remaining seven TDIs were known to display mechanism-based inhibition. The potential of predicting the interaction due to the inhibitory metabolite formation without synthesizing and testing the metabolite is an important feature of this model that is particularly useful in the discovery phase of the development of a new chemical entity, because identification of the exact structure of the metabolite often may not be available in early discovery.
It is well known that the expression of CYP3A enzymes in enterocytes results in significant presystemic intestinal metabolism of drugs and possible gut wall DDIs after oral administration (Schwenk, 1988; Kaminsky and Fasco, 1991; Paine and Oberlies, 2007). Clinical studies included in the dataset used in this investigation showed that ketoconazole, voriconazole, troleandomycin, erythromycin, clarithromycin, diltiazem, and conivaptan treatments led to a higher AUC increase for oral midazolam than for intravenous midazolam. These observations are consistent with significant inhibition of gut wall CYP3A, given that midazolam is a drug with a moderate hepatic extraction ratio. The single incubation time method showed accurate prediction for both intravenous and oral midazolam AUC changes with erythromycin, clarithromycin, diltiazem, TAO, and conivaptan. For example, clarithromycin administration (500 mg b.i.d. for 7 days) led to an increase in the AUC of midazolam by 3.20-fold after intravenous dosing and 8.00-fold after oral dosing (Quinney et al., 2008b). The corresponding predictions using the single incubation time method were 2.47- and 6.18-fold increases in midazolam AUC, respectively. In some cases, the oral midazolam DDI (e.g., ketoconazole) has not been well predicted. The reason for such an outcome is that the value of 0.57, which has been used as Fg for midazolam in this investigation (Ernest et al., 2005; Obach et al., 2006), is higher than the true value observed in some of the clinical DDI studies. For instance, Tsunoda et al. (1999) estimated the Fg value for midazolam to be 0.40 (assuming Fa = 1). To illustrate the impact of the Fg value on the DDI prediction outcome, another set of DDI predictions based on Fg, midazolam = 0.40 was constructed (Fig. 4a). The clinical studies with victim drugs other than midazolam were excluded from this figure. For the 11 clinical studies in which midazolam was dosed intravenously, the difference in Fg, midazolam would not influence the outcome of these DDI predictions. When Fg, midazolam = 0.40 was used, it was found that 38 of 46 clinical DDIs were predicted within 2-fold of the observed value (83% accuracy), 44 of 46 were predicted within 3-fold of the observed value (95% accuracy), and only 2 of 46 were slightly overpredicted beyond the 3-fold range. For the ketoconazole-midazolam interaction from Tsunoda et al. (1999), the prediction was improved from 8.47 to 12.05 and is closer to the observed value of 16-fold AUC change because of a better representation of the intestinal interaction when Fg, midazolam = 0.40. This example reinforces the concept that it is not only the in vitro inhibition parameters that influence the quality of the final DDI prediction but also whether the pharmacokinetic parameters used in the model (Fg and fm for the victim drug) represent the population in a specific clinical DDI study.

The single incubation time method: comparison of observed versus predicted AUC ratios. The square boxes correspond to areas of weak (1- to 2-fold increase in AUC ratio), moderate (2- to 5-fold increase in AUC ratio), and strong (>5-fold increase in AUC ratio) inhibition. The solid line depicts the line of unity, the long dashed line represents a 2-fold deviation from unity, and the short dashed line represents a 3-fold deviation from unity. a, the baseline value of Fg, midazolam used in Fig. 2 (0.57) was changed to 0.40 (12 drugs and 46 clinical DDIs); b, fu, p used in Fig. 2 was changed to 1 (no fu, p correction of Ki, app for the intestinal interaction, 13 drugs and 52 clinical DDIs).
Although there is no need to correct the systemic plasma concentration [I] with fu, p for the hepatic interaction prediction when the Ki, app values generated from hepatocytes plasma were used, the fu, p value was used to correct the Ki, app for the intestinal interaction prediction because enterocytes are considered to be a plasma protein-free environment. It is worthwhile to note that the intestinal inhibitor concentration calculated from the current model often exceeds the solubility of these drugs in intestinal fluid and generally is much higher than the Ki, app before any fu, p correction ([I]g ≫ Ki, app). As a result, the inhibitors examined in this study are predicted to completely inhibit the CYP3A in gut wall over the time during which the victim drugs are absorbed. Therefore, the final intestinal DDI prediction depends only on the value of Fg. This point is illustrated in Fig. 4b, in which there is no fu, p correction for the Ki, app in the intestinal interaction and the outcome of DDI prediction was similar to the performance when fu, p was used. One exception to this general observation was the case of aprepitant, which displays a high Ki, app value, and a fu, p correction is needed for the optimal prediction of the intestinal wall DDI component.
After the initial identification of inhibitors and DDI prediction by the single incubation time method, it may be desirable when examining new compounds to characterize the inhibition mechanism and estimate specific enzyme inhibition parameters. In the mechanistic approach, the incubation times with the inhibitor are 0, 10, and 20 min, and three IC50 curves are generated. All of the data are incorporated into the three models, A to C (eqs. 2–4), which are designed to differentiate reversible inhibitors, TDIs, and inhibitors with both properties. These models were used to correctly identify ketoconazole, aprepitant, fluconazole, and voriconazole as reversible inhibitors; erythromycin, troleandomycin, saquinavir, clarithromycin, conivaptan, diltiazem, itraconazole, and nefazodone as TDIs; and ritonavir as a reversible and time-dependent inhibitor. The in vitro inhibition constants estimated from the mechanistic models A to C were used to predict the magnitude of a DDI when combined with the total average plasma concentration of the inhibitor and incorporated into corresponding equations. With the knowledge of the inhibition mechanism, 65% of 52 clinical DDIs were accurately predicted within 2-fold of the observed fold change in AUC (Fig. 3).
The results reported here on the prediction of CYP3A DDIs using inhibitory parameters generated with human hepatocytes suspended in human plasma demonstrated that this robust system overcomes a number of perceived weaknesses associated with other in vitro approaches. In particular, this model provides an integrated cellular environment in which all modes of hepatic metabolism are retained and the uncertainty in concentration of inhibitor at the enzyme is greatly reduced. The single incubation time method simply requires a single inhibition parameter to predict the DDI caused by CYP3A inhibition, and there is no need to correct for nonspecific binding. Furthermore, in these predictions the total average systemic plasma concentration of the inhibitor provides a reasonable value for both reversible inhibitors and TDIs without the need for the determination of fraction unbound in plasma to calculate unbound drug concentrations. The study design for inhibition using HHSHP has been simplified such that there is only one time point, no dilution step (often performed with TDIs in HLM incubation), and the same midazolam concentration (close to its Km) is used in all IC50 assessments. This simple protocol design is achievable because model A has demonstrated the capability to extrapolate the reversible and time-dependent inhibition properties simultaneously.
In summary, cryopreserved human hepatocytes suspended in human plasma were determined to be a robust and reliable system for the prediction of CYP3A DDIs. These predictions may be made by using an IC50 determined at a single incubation time regardless of the inhibition mechanism, and, if needed, mechanism may also be explored with the mechanistic method.
Authorship Contributions
Participated in research design: Mao, Mohutsky, Harrelson, Wrighton, and Hall.
Conducted experiments: Mao, Mohutsky, and Harrelson.
Performed data analysis: Mao, Mohutsky, and Harrelson.
Wrote or contributed to the writing of the manuscript: Mao, Mohutsky, Harrelson, Wrighton, and Hall.
Acknowledgments
Thanks to Jeffrey M. Weber and Shane M. Lowery for the bioanalytic support.
Footnotes
Article, publication date, and citation information can be found at http://dmd.aspetjournals.org.
doi:10.1124/dmd.110.036400.
↵
 The online version of this article (available at http://dmd.aspetjournals.org) contains supplemental material.
-
ABBREVIATIONS:
- DDI
- drug-drug interaction
- HLM
- human liver microsome(s)
- P450
- cytochrome P450
- HHSHP
- human hepatocytes suspended in human plasma
- AUC
- area under the curve
- OH
- hydroxy
- CV
- coefficient of variation
- TDI
- time-dependent inhibitor
- TAO
- troleandomycin.

- Received September 20, 2010.
- Accepted January 6, 2011.
- Copyright © 2011 by The American Society for Pharmacology and Experimental Therapeutics


