


Abstract
The objective of this study was to assess the physiologically based pharmacokinetic (PBPK) model for predicting plasma concentration-time profiles of orally available cMet kinase inhibitors, (R)-3-[1-(2,6-dichloro-3-fluoro-phenyl)-ethoxy]-5-(1-piperidin-4-yl-1H-pyrazol-4-yl)-pyridin-2-ylamine (PF02341066) and 2-[4-(3-quinolin-6-ylmethyl-3H-[1,2,3]triazolo[4,5-b]pyrazin-5-yl)-pyrazol-1-yl]-ethanol (PF04217903), in humans. The prediction accuracy of pharmacokinetics (PK) by PBPK modeling was compared with that of a traditional one-compartment PK model based on allometric scaling. The predicted clearance values from allometric scaling with the correction for the interspecies differences in protein binding were used as a representative comparison, which showed more accurate PK prediction in humans than the other methods. Overall PBPK modeling provided better prediction of the area under the plasma concentration-time curves for both PF02341066 (1.2-fold error) and PF04217903 (1.3-fold error) compared with the one-compartment PK model (1.8- and 1.9-fold errors, respectively). Of more importance, the simulated plasma concentration-time profiles of PF02341066 and PF04217903 by PBPK modeling seemed to be consistent with the observed profiles showing multiexponential declines, resulting in more accurate prediction of the apparent half-lives (t1/2): the observed and predicted t1/2 values were, respectively, 10 and 12 h for PF02341066 and 6.6 and 6.3 h for PF04217903. The predicted t1/2 values by the one-compartment PK model were 17 h for PF02341066 and 1.9 h for PF04217903. Therefore, PBPK modeling has the potential to be more useful and reliable for the PK prediction of PF02341066 and PF04217903 in humans than the traditional one-compartment PK model. In summary, the present study has shown examples to indicate that the PBPK model can be used to predict PK profiles in humans.
Introduction
Potential clinical drug candidates are routinely screened for their absorption, distribution, metabolism, and excretion (ADME) properties in the drug discovery and development process. To improve and expedite clinical drug candidate selection, there has been an increased demand to predict pharmacokinetics (PK) in humans as early as possible. The development and application of reliable methods to predict PK in humans could help in selection of the best candidates for clinical development. As most therapeutic drugs are designed to be given orally to patients and the majority of these are intended to act systemically, the most important PK parameters related to dosing regimen are systemic clearance (CL), volume of distribution at steady-state (Vss), and fraction absorbed (Fabs). Among these parameters, CL plays a central role because it relates to both the drug's half-life (t1/2) and oral bioavailability (Foral), whereas Vss and Fabs are also required to fully characterize the dosing regimen such as dose size and frequency. Methods of predicting CL in humans include species scaling by allometry (Boxenbaum, 1984; Mordenti, 1986; Ings, 1990), in vitro-in vivo extrapolation (IVIVE) (Houston and Carlile, 1997; Obach et al., 1997; Rostami-Hodjegan and Tucker, 2007), and the combined use of in vivo animal and in vitro human data (Ubeaud et al., 1995; Lavé et al., 1999; Yamazaki et al., 2004). Allometric scaling is simply based on the similarity of anatomical, physiological, and biochemical variables across species including humans. Although allometric scaling is an empirical approach, it has been widely used and provided reliable predictions for a number of highly metabolized and renally excreted drugs (Boxenbaum, 1984; Mordenti, 1986; Mahmood and Balian, 1996). Over the last two decades, the methods for extrapolating in vivo CL from in vitro data (i.e., IVIVE) have been applied extensively with the increased availability of human liver samples (e.g., microsomes, hepatocytes, liver slices, and others) and have demonstrated prediction accuracy for metabolic CL of low to high hepatic extraction compounds (Houston and Carlile, 1997; Obach et al., 1997; Obach, 1999; Riley et al., 2005; Shiran et al., 2006). In recent years, there has been growing interest in the physiologically based pharmacokinetic (PBPK) model, which provides the disposition profiles in various species to be predicted from physicobiochemical properties of compounds with the species-specific physiological parameters (Jones et al., 2006; De Buck et al., 2007; Lavé et al., 2007; Nestorov, 2007). Advances in the prediction of Vss from in silico modeling (Poulin and Theil, 2002; Berezhkovskiy, 2004; Rodgers et al., 2005; Rodgers and Rowland, 2006) have greatly extended the applicability of the PBPK model to compounds in the early stage of drug discovery to the late phase of drug development.
(R)-3-[1-(2,6-Dichloro-3-fluoro-phenyl)-ethoxy]-5-(1-piperidin-4-yl-1H-pyrazol-4-yl)-pyridin-2-ylamine (PF02341066) and 2-[4-(3-quinolin-6-ylmethyl-3H-[1,2,3]triazolo[4,5-b]pyrazin-5-yl)-pyrazol-1-yl]-ethanol (PF04217903) (Fig. 1) were identified as orally available ATP-competitive cMet kinase inhibitors (Ki 4–5 nM) (Zou et al., 2007, 2008). PF02341066 and PF04217903 potently inhibited in vitro cMet phosphorylation and signal transduction as well as cMet-dependent proliferation, migration, or invasion of human tumor cells (IC50 5–20 nM). PF02341066 also potently inhibited phosphorylation of nucleophosmin-anaplastic lymphoma kinase in Karpas299 and SU-DHL-1 ALCL cells as well as nucleophosmin-anaplastic lymphoma kinase-dependent cell proliferation or apoptosis (IC50 20–40 nM) (Christensen et al., 2007). PF02341066 and PF04217903 are currently being developed for the clinical treatment of cancer.

Chemical structures of PF02341066 and PF04217903. MW, molecular weight.
These kinase inhibitors were selected to investigate the PK prediction accuracy in humans using in vitro and in vivo data because of relatively different physicochemical and PK properties. PF02341066 is a strong basic compound having pKa values of 5.4 and 8.9 with logP of 4.3, whereas PF04217903 is a weak basic compound having a pKa value of 4.7 with logP of 0.52. The solubility of PF02341066 in water (34 μg/ml) is approximately 50-fold higher than that of PF04217903 (0.6 μg/ml). PF02341066 showed moderate in vivo CL and relatively large Vss, whereas PF04217903 showed relatively low CL and Vss. These differences positioned these inhibitors as interesting compounds to investigate the prediction accuracy of oral PK parameters in humans. Moreover, the quantitative prediction of the plasma concentration-time profiles of clinical candidate drugs has become a matter of major interest to industry. The main reason for this focus is the fact that the plasma concentration-time profiles of clinical candidates are seen as the first surrogate markers of the pharmacological and toxicological effects. Therefore, we evaluated the prediction accuracy of the plasma concentration-time profiles of PF02341066 and PF04217903 in humans based on PBPK modeling compared with that of traditional one-compartment PK modeling.
Materials and Methods
Chemicals.
PF02341066 (hydrochloride salt: chemical purity >99%), PF04217903 (free base: chemical purity >99%) and structurally related in-house compounds (internal standard for analysis) were synthesized by Pfizer Worldwide Research and Development (San Diego, CA). All other commercially available reagents and solvents were of either analytical or high-performance liquid chromatography (HPLC) grade.
Animals.
All experiments with animals were performed in accordance with the Institute of Laboratory Animal Research (1996) Guide for the Care and Use of Laboratory Animals, as well as with internal company policies and guidelines. Male Sprague-Dawley rats (Charles River Laboratories, Inc., Wilmington, MA), weighing 0.25 to 0.28 kg, male beagle dogs (Pfizer dog colony; Pfizer, Kalamazoo, MI), weighing 7.9 to 12 kg, and male cynomolgus monkeys (Pfizer monkey colony; Pfizer, Kalamazoo, MI), weighing 2.4 to 4.1 kg, were used for the PK studies. Each animal was housed in a stainless cage or metabolic cage (urine collection) under controlled conditions (20–26°C, 30–70% relative humidity, and 12-h light/dark cycle).
In Vitro Incubation: Microsomes.
Pooled liver microsomes of Sprague-Dawley rats, beagle dogs, cynomolgus monkeys, and humans (n = 5, whites) were purchased from BD Gentest (Woburn, MA). The incubation mixture consisted of liver microsomes (0.5–0.8 mg/ml), 125 mM MgCl2, and PF02341066 or PF04217903 (1 μM) in 100 mM potassium phosphate, pH 7.4. The reaction was initiated by the addition of NADPH (final 1 mM), and the mixture (0.2 ml) was incubated at 37°C for 0, 5, 10, 15, 30, 45, and 60 min. The reaction was terminated by the addition of cold acetonitrile (0.1 ml) containing the internal standard (1 μM) followed by vortexing for 1 min on an SP Multi-Tube Vortexer (Baxter, McGaw Park, IL). The sample was centrifuged (Allegra 6KR centrifuge with a GH-3.8A rotor; Beckman Coulter, Fullerton, CA) at 2000g for 10 min, and the supernatant (0.1 ml) was mixed with an equal volume of water in an HPLC plate for liquid chromatography-tandem mass spectrometry (LC-MS/MS) analysis. All of the incubations were performed in triplicate.
In Vitro Incubation: Hepatocytes.
Cryopreserved hepatocytes of Sprague-Dawley rats, beagle dogs, cynomolgus monkeys, and humans (n = 5, whites) were obtained from In Vitro Technologies (Baltimore, MD) and used according to the manufacturer's instructions. Cell viability was routinely checked by the trypan blue (0.4% w/v) exclusion test and preparations in excess of 90% viable were used. The incubations with hepatocytes (final volume of 0.05 ml) were performed at a cell density of 0.5 to 1 × 10⁶ cells/ml in Williams' E medium supplemented with 10 mM HEPES buffer (pH 7.4) at 37°C up to 4 h in a CO2-O2 (5:95) stationary incubator. The reaction was started by the addition of either PF02341066 or PF04217903 (1 μM) and terminated by the addition of methanol (0.2 ml) containing the internal standard (1 μM) at each time point (0, 0.25, 0.5, 1, 2, 3, and 4 h). The sample was vortexed and centrifuged at 1900g (GH3.8A rotor) for 10 min. The supernatant (0.1 ml) was diluted with an equal amount of water and injected onto the LC-MS/MS system for analysis. All of the incubations were performed in triplicate.
In Vitro Plasma Protein Binding.
In vitro plasma protein binding of PF02341066 (0.5–20 μM) and PF04217903 (0.2–10 μM) was determined in Sprague-Dawley rats, beagle dogs, cynomolgus monkeys, and humans (n = 3, whites) using the equilibrium dialysis technique. The study was conducted in a 96-well Teflon dialysis chamber (HTDialysis, LLC, Gales Ferry, CT) using a semipermeable membrane (Spectra/Por4; Spectrum, Laguna Hills, CA) with a 12,000- to 14,000-Da molecular mass cutoff. The plate was covered with a top seal film to avoid evaporation and incubated at 37°C for 6 h. An appropriate volume of all samples was analyzed by LC-MS/MS. All of the incubations were performed in triplicate. Pilot experiments revealed that 1) PF02341066 and PF04217903 were stable in plasma and 2) protein binding reached equilibrium at 37°C within 6 h. The unbound fraction in plasma (fu, plasma) was calculated by the following equation:
 where Cbuffer and Cplasma denote the drug concentrations in buffer and plasma, respectively, after the incubation.
In Vitro Nonspecific Binding.
In vitro nonspecific binding of PF02341066 and PF04217903 was determined in liver microsomes using the equilibrium dialysis technique as described above. Dialysis mixtures contained liver microsomes (0.5–0.8 mg/ml), 125 mM MgCl2, and PF02341066 or PF04217903 (1 μM) in 100 mM potassium phosphate, pH 7.4, in a final volume of 0.2 ml. All of the incubations were performed in triplicate. The unbound fraction in microsomes (fu, microsomes) was calculated by the following equation:
 where Cbuffer and Cmicrosomes denote the drug concentrations in buffer and microsomes, respectively, after the incubation.
In vitro nonspecific binding of PF02341066 and PF04217903 in hepatocytes (fu, hepatocytes) was calculated by the following equation (Kilford et al., 2008):
 where Rhepatocytes is the cell/medium concentration ratio in hepatocytes, Rmicrosomes is the microsomal protein binding affinity, VR is the cell/volume ratio in the hepatocytes, and P is the microsomal protein concentration (milligrams per milliliter), respectively. The Rhepatocytes/Rmicrosomes ratio of 125 and the VR of 0.005 at the cell concentration of 106 cells/ml were used for the fu, hepatocytes calculation (Kilford et al., 2008).
Blood/Plasma Concentration Ratio.
The blood/plasma concentration ratios of PF02341066 and PF04217903 were determined by incubating the compounds with whole blood from Sprague-Dawley rats, beagle dogs, cynomolgus monkeys, and humans (whites). PF02341066 or PF04217903 (final 1 μM), dissolved in methanol or acetonitrile-water (1:1, v/v), was added to whole blood, and the spiked whole blood was incubated at 37°C for 1 h. Aliquots of the spiked whole blood and the harvested plasma were transferred into a tube with acetonitrile-methanol (1:1, v/v) containing the internal standard (1 μM). An appropriate volume of all samples was analyzed by LC-MS/MS. All of the incubations were performed in triplicate. The blood/plasma concentration ratio (Rbp) and the unbound fraction in whole blood (fu, blood) were calculated by the following equations:

 where Cblood and Cplasma denote the drug concentrations in whole blood and plasma, respectively, after the incubation.
In Vitro Hepatic CL Calculation.
The in vitro intrinsic clearance (CLint) was calculated from t1/2 of the parent drug disappearance, which was determined by the slope (k) of log-linear regression analysis from the concentration versus time profiles, i.e., t1/2 = −ln(2)/k. (Lavé et al., 1999). Values of CLint were scaled to in vivo units using scaling factors such as the hepatic microsomal protein concentrations (45 mg/g liver) or the hepatocellularity (135, 240, 120, and 120 × 106 cells/g liver in rats, dogs, monkeys, and humans, respectively) and the liver weights (40, 32, 32, and 21 g/kg b.wt., respectively) (Hosea et al., 2009). In vitro hepatic clearance (CLhep) was then calculated using the equation for the well stirred models, and the hepatic extraction ratio (ER) was calculated from CLhep divided by the hepatic blood flow (Qb). The use of validated scaling factors, 32 mg/g liver for human microsomal protein and 99 × 106 cells/g liver for human hepatocellularity, was recommended by Barter et al. (2007). The use of these scaling factors resulted in 15 to 30% lower CLhep values of PF02341066 and PF04217903. For consistency with previous reports (Obach et al., 1997; Obach 1999; Naritomi et al., 2003; Riley et al., 2005; Hosea et al., 2009), the scaling factors indicated above were used for this study.
In the well stirred model (WS-I), CLhep was calculated using CLint, fu, blood, the unbound fraction in microsomes or hepatocytes (fu, vitro), and Qb (70, 40, 44, and 20 ml per min/kg in rats, dogs, monkeys, and humans, respectively) (Hosea et al., 2009):

Many investigators have suggested that the well stirred model disregarding all binding (i.e., fu, blood and fu, vitro) provides a better estimate of in vivo CL (Obach, 1999; Riley et al., 2005; De Buck et al., 2007). Therefore, CLhep′ was also calculated on the basis of the modified well stirred model (WS-II) using only CLint and Qb under the assumption that fu, blood and fu, vitro effectively nullify in the liver model:

Preclinical PK Studies.
PF02341066 and PF04217903 were dissolved in saline and PEG400/saline (4:6, v/v), respectively, for intravenous administration, whereas they were suspended in 0.5% methylcellulose solution for oral administration. All dose levels of PF02341066 and PF04217903 are expressed as free base equivalents. Male Sprague-Dawley rats were given intravenous PF02341066 (5 mg/kg) or PF04217903 (2.5 mg/kg) by bolus injection through a catheter implanted into the jugular vein or oral PF02341066 (25 mg/kg) or PF04217903 (10 mg/kg) by gavage. Male beagle dogs were given intravenous PF02341066 (5 mg/kg) or PF04217903 (2.5 mg/kg) by bolus injection through the jugular vein or oral PF02341066 (25 mg/kg) or PF04217903 (10 mg/kg) via gastric gavage. Male cynomolgus monkeys were given intravenous PF02341066 (5 mg/kg) by bolus injection via the saphenous jugular vein or oral PF02341066 (25 mg/kg) via gastric intubation. The number of animals dosed was three per group for PF02341066 and two per group for PF04217903. Blood samples were collected from all animals at predetermined time points with K2EDTA or K3EDTA as the anticoagulant and were then centrifuged. The resulting plasma samples were stored at approximately −20°C until analysis. Urine samples were also collected from the intravenous dosing groups over 24 or 48 h postdose with a minimal cage rinse, and the samples were stored at approximately −20°C until analysis.
PF02341066 and PF04217903 Analysis.
Concentrations of PF02341066 and PF04217903 in preclinical biological samples were quantitatively determined by LC-MS/MS analysis. The chromatography was performed with an HP1100 HPLC system (Agilent Technologies, Santa Clara, CA) or an LC-10AD HPLC system (Shimadzu, Columbia, MD) using a reverse-phase column (XDB-C18, 2.1 × 50 mm, 5 μm; Agilent). Mass spectrometric analysis was performed on a Quattro Ultima triple-stage quadrupole mass spectrometer (Micromass, Beverly, MA) or an API 4000 triple-stage quadrupole mass spectrometer (Applied Biosystems, Foster City, CA). The mobile phase consisted of solvent A (98% HPLC-grade water, 2% acetonitrile, and 0.1% formic acid) and solvent B (98% acetonitrile, 2% HPLC-grade water, and 0.1% formic acid) at a flow rate of 0.4 to 0.6 ml/min. The gradient elution was programmed from B of 5 to 60% over 2.5 min for PF02341066 or B of 2 to 90% over 4 min for PF04217903. Sample analysis was performed in the positive ionization multiple reaction monitoring mode with unit resolution for the transitions of m/z 450 → 260 for PF02341066 and m/z 377 → 348 for its internal standard or m/z 373 → 142 for PF 04217903 and m/z 305 → 160 for its internal standard. Total time for the analytical run was 4 to 5 min. All sample analyses were conducted according to the internal assay quality guidelines based on the workshop/conference report (Shah et al., 2000).
Clinical PK Studies.
Plasma concentrations of PF02341066 and PF04217903 in the clinic were provided by the Oncology Business Unit (Pfizer Inc., San Diego, CA). PF02341066 (100 mg) was orally administered once daily to four patients with cancer, aged between 35 and 57 years old with body weights of 63 to 99 kg. Serial blood samples were collected over 24 h after the first dose. A single oral dose of PF04217903 (30 mg) was administered to six healthy volunteers, aged between 23 and 50 years old with body weights of 73 to 98 kg. Serial blood samples were collected up to 96 h postdose. The plasma concentrations of PF02341066 and PF04217903 were quantitatively determined by validated LC-MS/MS methods based on preclinical assay. Clinical protocols were approved by the investigational review boards of participating institutions, and all subjects gave written informed consent for participation in the clinical trials. Detailed clinical information for PF02341066 has been reported recently (Kwak et al., 2010), whereas clinical data for PF04217903 were previously reported by Tan et al. (2009) and detailed information will be published elsewhere (W. Tan, T. M. Checchio, N. Grace, R. Wang, and K. D. Wilner, manuscript in preparation).
Noncompartment PK Analysis.
For the in vivo studies, plasma concentration-time data for each species were analyzed by model-independent methods. The area under the plasma concentration-time curve from time 0 to the last time point (tlast) with a quantifiable concentration (Clast), AUC0–last, was calculated using the linear trapezoidal rule. The area under the plasma concentration-time curve was extrapolated to infinity time (AUC0–∞) by the following equation:
 where λ is the elimination rate constant determined by linear regression of the last two to four quantifiable data points in the log plasma concentration-time curves.
Plasma clearance (CLplasma), blood clearance (CLblood), the apparent disposition t1/2, and Vss were calculated by the respective following equations:


 where AUMC0–∞ is the area under the first moment of the plasma concentration-time curve from time 0 to infinity:

In vivo hepatic extraction ratio (ERvivo) was calculated from CLblood divided by the Qb values. Foral was calculated from the following equation:
 where AUCi.v. and AUCp.o. are AUC estimates after the intravenous and oral administration, respectively, and Dosei.v. and Dosep.o. are the administered doses for intravenous and oral administration, respectively.
Allometric Scaling Approach.
Allometric scaling assumes that PK parameters (Y) such as CLblood and Vss are correlated with their corresponding mean body weights (W, kilograms) by the allometric equation (Boxenbaum, 1984; Mordenti, 1986):
 where a and b are the allometric coefficient and exponent, respectively.
The values of the allometric coefficient (a) and exponent (b) were estimated by linear least-squares regression of the log-transformed allometric equation (log Y = log a + b log W). To improve the predictive performance of allometric scaling for CLblood, Mahmood and Balian (1996) evaluated three different allometric scaling methods: 1) simple allometry (CLblood = aWb), 2) product of CLblood and maximum life span potential (MLP) versus W (CLblood × MLP = aWb), and 3) product of CLblood and brain weights (BRW) versus W (CLblood × BRW = aWb). They proposed the selection of one of these methods on the basis of the exponents of simple allometric scaling (the rule of exponent): 1) if the exponent of the simple allometry lies between 0.55 and 0.70, simple allometry will predict CLblood more accurately than CLblood × MLP or CLblood × BRW, 2) if the exponent of the simple allometry lies between 0.71 to 1.0, the CLblood× MLP approach will predict CLblood better than simple allometry or CLblood × BRW, and 3) if the exponent of the simple allometry is ≥1.0, the CLblood × BRW approach is suitable to predict CLblood in humans compared with the other two methods. Allometric scaling methods with the rule of exponent were also evaluated in the present study. Furthermore, because protein-binding differences are known to affect PK comparisons across species and PK predictability in humans, the in vivo intrinsic clearance (CLint, vivo) calculated from CLblood by the well stirred model equation was also used for the allometric scaling. Collectively four different allometric scaling (ALS) methods for CL prediction were used:
ALS-CL: CLblood versus W (i.e., CLblood = aWb).
ALS-MLP: product of CLblood and MLP versus W (i.e., CLblood × MLP = aWb).
ALS-BRW: product of CLblood and BRW versus W (i.e., CLblood × BRW = aWb).
ALS-CLint: CLint, vivo versus W (i.e., CLint, vivo = aWb).
Likewise, two difference allometric scaling methods were used to predict Vss in humans:
ALS-Vss: Vss versus W (i.e., Vss = aWb).
ALS-Vss, u: unbound volume of distribution at steady-state (Vss, u = Vss/fu, plasma) versus W (i.e., Vss, u = aWb).
To predict plasma concentration-time profiles of PF02341066 and PF04217903 in humans based on allometric scaling, a standard one-compartment PK model with a first-order absorption rate was used with NONMEM version V (University of California at San Francisco, San Francisco CA). As inputs of the compartment PK model, the following two different sets of the predicted CLplasma and Vss from allometric scaling were used:
ALS-total: CLplasma from ALS-CL and Vss from ALS-Vss.
ALS-free: CLplasma from ALS-CLint and Vss from ALS-Vss, u.
The absorption rate constants (ka) of both the compounds were estimated in all preclinical species by the compartment PK analysis with NONMEM, and the mean ka values (0.30 h−1 for PF2341066 and 0.69 h−1 for PF04217903) in preclinical species tested were used as inputs of the one-compartment PK model: the estimates of ka = 0.24, 0.38, and 0.28 h−1 in rats, dogs, and monkeys, respectively, for PF02341066 and 0.76 and 0.61 h−1 in rats and dogs, respectively, for PF04217903.
PBPK Modeling.
The GastroPlus 5.3 PBPK model and its built-in mass balance differential equations were used for all simulations in preclinical species and humans (Simulations Plus Inc., Lancaster, CA). In brief, the PBPK model was composed of 14 tissue compartments, including lung, spleen, liver, gut, adipose tissue, muscle, heart, brain, kidney, skin, testes, bone, and the rest of the body, which were linked by the venous and arterial blood circulation. It was assumed that drug distributes instantaneously and homogenously within each tissue compartment, and uptake of drug within each tissue compartment was limited by the blood flow (perfusion rate-limited uptake). All physiological parameters for tissue volume and blood flows data are summarized in Supplemental Table 1. To predict the rate and extent of oral absorption of PF02341066 and PF04217903, the Advanced Compartmental Absorption and Transit (ACAT) model within GastroPlus was used (Agoram et al., 2001). The ACAT model is a semiphysiologically based transit model consisting of nine compartments corresponding to different segments of the gastrointestinal tracts. The generic logD model was used for the simulation of oral absorption of PF02341066 and PF04217903 in all species tested.
For PBPK modeling in preclinical species, the observed in vivo CLblood values obtained from a single intravenous administration of PF02341066 and PF04217903 were used as the CLhep inputs for PBPK modeling. As CLhep inputs for PBPK modeling in humans, CLhep values predicted by IVIVE using WS-II and allometric scaling by ALS-CLint were used as the representative PBPK modeling. Renal clearances of both PF02341066 and PF04217903 in humans were set to be null for PBPK modeling based on preclinical data (<1% of the administered dose as parent drug in urine for both the compounds after the intravenous dose). This assumption was further supported by clinical data (<2% of the dose in urine for both the compounds after the oral dose). Tissue/plasma partition coefficients (Kp) for each tissue compartment were predicted from physicochemical parameters of each compound using the equation developed by Poulin and Theil (2002) and corrected by Berezhkovskiy (2004).
Assessment of Prediction Accuracy.
The accuracy of prediction was assessed from the prediction error (difference between predicted and observed values) for each PK parameter:

 where PRED and OBS denote the predicted and observed values, respectively.
Results
In Vivo Noncompartment PK in Preclinical Species and Humans.
After a single intravenous administration of PF02341066 at a dose of 5 mg/kg to preclinical species, CLplasma values were estimated to be 29, 9.0, and 34 ml per min/kg in rats, dogs, and monkeys (Table 1), respectively, demonstrating that PF02341066 was a moderate to high clearance compound in preclinical species. The estimate of Vss in preclinical species was 13 l/kg, suggesting extensive distribution into tissues. The estimated apparent t1/2 values of PF02341066 were 5.5 to 17 h. After a single oral administration of PF02341066 at a dose of 25 mg/kg to preclinical species, PF02341066 was moderately absorbed with maximum plasma concentration (Cmax) values of 0.24 to 0.62 μg/ml at 4 to 6 h postdose. The estimated oral t1/2 values (7.0–12 h) were comparable to those for the intravenous administration (5.5–17 h). Foral was estimated to be 42 to 65% across species. After oral administration of PF02341066 at a dose of 100 mg to patients, PF02341066 was moderately absorbed with a mean Cmax of 0.061 μg/ml at 2.5 h postdose (Table 1). Thereafter, PF02341066 declined multiexponentially with an apparent mean t1/2 of 10 h over the dosing interval of 24 h.
Pharmacokinetic parameters of PF02341066 and PF04217903 in preclinical species and humans after intravenous or oral administration
Data are expressed as means ± S.D. (n = 3 animals or 4 patients per group for PF02341066; n = 2 animals or 6 healthy volunteers per group for PF04217903).
After a single intravenous administration of PF04217903 at the dose of 2.5 mg/kg in preclinical species, CLplasma values were estimated to be 8.2 and 12 ml per min/kg in rats and dogs (Table 1), respectively, demonstrating that PF04217903 was a low to moderate clearance compound in preclinical species. Estimates of Vss in rats and dogs were 1.6 and 3.7 l/kg, respectively, suggesting moderate distribution into tissues. The estimated apparent t1/2 values were 3.7 and 5.2 h in rats and dogs, respectively. After a single oral administration of PF04217903 at the dose of 10 mg/kg to preclinical species, PF04217903 was rapidly absorbed in rats and dogs with Cmax values of 2.4 to 2.7 μg/ml at 0.8 to 2 h postdose. The estimated oral t1/2 values (3.6–5.1 h) were comparable to those for the intravenous administration (3.7–5.2 h). Foral was estimated to be approximately 70 and 100% in rats and dogs, respectively. After a single oral administration of PF04217903 at the dose of 30 mg to healthy volunteers, PF04217903 was rapidly absorbed with a mean Cmax of 0.24 μg/ml at 1.2 h postdose (Table 1). Thereafter PF04217903 declined multiexponentially with an apparent mean t1/2 of 6.6 h.
In Vitro-In Vivo Extrapolation.
In vitro binding and blood partition data of PF02341066 and PF04217903 are summarized in Table 2. PF02341066 showed moderate to high in vitro binding (fu, blood = 0.051–0.092; fu, vitro = 0.091–0.151), whereas PF04217903 showed low to moderate in vitro binding (fu, blood = 0.183–0.423; fu, vitro = 0.780–0.843). The estimated Rbp values of PF02341066 and PF04217903 were approximately unity across species (0.850–1.37 and 0.806–0.980, respectively).
In vitro binding data of PF02341066 and PF04217903 across species
Data represent the mean of triplicate determination. fu,| plasma, Rbp, and fu,| microsomes were experimentally determined. fu,| blood and fu,| hepatocytes were calculated by the equations described under Materials and Methods.
The estimated in vitro CLhep values of PF02341066 and PF04217903 in liver microsomes and hepatocytes are summarized in Table 3. The in vitro CLhep values of PF02341066 were 2- to 3-fold higher in microsomes than in hepatocytes across species including humans. The CLhep values of PF02341066 calculated from WS-I were slightly lower (<2-fold) than those values by WS-II because the fu, blood values were approximately 2-fold lower than fu, vitro values. When the in vitro CLhep values of PF02341066 were compared with the in vivo CLblood in preclinical species, the estimated CLhep values in microsomes by WS-I and WS-II were reasonably consistent in rats and monkeys, whereas those in dogs were >2-fold higher than the in vivo CLblood value. The estimated CLhep values of PF02341066 in hepatocytes by WS-I and WS-II were 2- to 4-fold lower than the in vivo CLblood in rats and 1.3- to 2.5-fold lower than the CLblood in monkeys. In contrast, the estimated CLhep values in dog hepatocytes by WS-I and WS-II were reasonably consistent (<2-fold) with the CLblood value. Overall the IVIVE for PF02341066 using both WS-I and WS-II provided reasonable predictions in rat microsomes, dog hepatocytes, and monkey microsomes compared with rat hepatocytes, dog microsomes, and monkey hepatocytes, respectively.
In vivo blood clearance and in vitro hepatic clearance of PF02341066 and PF04217903 across species
Data represent the mean of triplicate determinations. In vivo CLblood was calculated from plasma clearance divided by the blood/plasma concentration ratio. In vitro hepatic clearances were calculated by the well-stirred models (WS-I and WS-II) with and without all binding (CLhep and CLhep′, respectively). In vitro ER and ER′ were calculated by CLhep and CLhep′, respectively, divided by hepatic blood flow.
In contrast to PF02341066, the fu, blood values of PF04217903 were 3- to 4-fold lower than fu, vitro values (Table 2). As a result, the CLhep values from WS-I were 1.5- to 4-fold lower than those from WS-II, whereas the estimated CLhep values were comparable between microsomes and hepatocytes. The estimated CLhep values of PF04217903 in rat microsomes and hepatocytes by WS-I were reasonably consistent (<2-fold) with in vivo CLblood, whereas those in rat microsomes and hepatocytes by WS-II were 2- to 3-fold higher than in vivo CLblood. In dog microsomes and hepatocytes, the estimated CLhep values by WS-II were more consistent (<1.2-fold) with the in vivo CLblood than those by WS-I. Overall a better IVIVE of PF04217903 was observed in rats using WS-I, whereas WS-II provided a better IVIVE in dogs than WS-I, disregarding whether microsomes or hepatocytes were used. Collectively, there was no consistent IVIVE method for PF02341066 and PF04217903 in preclinical species to provide a better projection of in vivo CLblood from one in vitro system (i.e., microsomes versus hepatocytes) and/or one mathematical model (i.e., WS-I versus WS-II).
Allometric Scaling for CL and Vss.
To predict CLblood of PF02341066 and PF04217903 in humans, four different allometric scaling approaches were used, i.e., ALS-CL, ALS-MLP, ALS-BRW, and ALS-CLint. Allometric parameters of PF02341066 and PF04217903 are summarized in Table 4. Predicted CLblood of PF02341066 by ALS-CL was 8.0 ml per min/kg, whereas that by ALS-CLint was 14 ml per min/kg. The difference in the predicted CLblood values between ALS-CL and ALS-CLint largely resulted from the difference in fu, blood across species. Predicted CLblood values of PF02341066 in humans by ALS-MLP and ALS-BRW were 3.9 and 2.6 ml per min/kg, respectively. When the rule of exponent (Mahmood and Balian, 1996) was applied, the predicted CLblood was 3.9 ml per min/kg from ALS-MLP based upon the allometric exponent of 0.729 on ALS-CL.
Predicted blood clearance and volume of distribution at steady state of PF02341066 and PF04217903 in humans by different allometric scaling methods
The CLblood values of PF04217903 in humans were predicted to be 22 and 7.6 ml per min/kg by ALS-CL and ALS-CLint, respectively. Thus, the predicted CLblood by ALS-CL was approximately 3-fold higher than that by ALS-CLint because of the difference in fu, blood across species. Predicted CLblood values of PF04217903 in humans by ALS-MLP and ALS-BRW were 7.8 and 4.3 ml per min/kg, respectively. When the rule of exponent was applied, the predicted CLblood was 4.3 ml per min/kg from ALS-BRW because the allometric exponent was 1.17 on ALS-CL.
To predict Vss of PF02341066 and PF04217903 in humans, two different allometric scaling approaches were performed, i.e., ALS-Vss and ALS-Vss, u. Allometric parameters of PF02341066 and PF04217903 by ALS-Vss and ALS-Vss, u are summarized in Table 4. The Vss values of PF02341066 in humans were predicted to be 13 and 25 l/kg by ALS-Vss and ALS-Vss, u, respectively. The difference in the predicted Vss values largely resulted from the difference in fu, blood across species. The allometric exponents and correlation coefficients were close to unity for both methods. The predicted Vss values of PF04217903 in humans by ALS-Vss and ALS-Vss, u were 6.3 and 2.2 l/kg, respectively, with the allometric exponents of 1.25 and 1.09, respectively. Likewise, the difference in the predicted Vss values largely resulted from the difference in fu, blood across species.
Prediction of Plasma Concentration-Time Profiles of PF02341066 and PF04217903 in Humans Based on the Allometric Scaling Approach.
Plasma concentration-time profiles of PF02341066 and PF04217903 in humans were predicted by a one-compartment PK model using the two different sets of predicted CLplasma and Vss values from the allometric scaling methods, i.e., ALS-total and ALS-free (Fig. 2). The mean ka values of PF02341066 and PF04217903 (0.30 and 0.69 h−1, respectively) estimated from preclinical species were used for the one-compartment modeling. The simulated PK parameters of PF02341066 and PF04217903 are summarized in Table 5 with the prediction accuracy, i.e., the fold error of the observed versus model-simulated PK parameters.

Observed and one-compartment pharmacokinetic model-simulated plasma concentration-time profiles of PF02341066 (A) and PF04217903 (B) in humans after oral administration. Observed plasma concentration-time profiles (OBS) were obtained from four patients after oral administration of PF02341066 at 100 mg or from six healthy volunteers after oral administration of PF04217903 at 30 mg. Model-simulated concentrations were predicted by the one-compartment pharmacokinetic model using the two different sets of the predicted CLplasma and Vss from the allometric scaling, i.e., ALS-total (– – –) and ALS-free (— —).
Simulated pharmacokinetic parameters of PF02341066 and PF04217903 in humans after oral administration of PF02341066 and PF04217903 at 100 and 30 mg, respectively
The accuracy of prediction is expressed as fold error (the ratio of predicted to observed or observed to predicted values) in parentheses.
The predicted AUC value of PF02341066 by ALS-total was approximately 4-fold higher than the observed value, although the Cmax value was predicted well with only 1.1-fold error. The overprediction of the AUC value was largely due to the overprediction of t1/2 (1.8-fold). The predicted AUC value with 4-fold error does not seem to fall in an acceptable range of the current industry criteria, i.e., 2-fold (Ward and Smith, 2004; Jones et al., 2006; Beaumont and Smith, 2009). In contrast, the fold errors for the AUC, Cmax, and t1/2 based on ALS-free were 1.8, 1.8, and 1.6, respectively. These predicted PK parameters might therefore be within the acceptable range (<2-fold). However, the predicted one-compartment plasma concentration-time profile of PF02341066 seemed to be considerably different from the observed profile, which showed multiexponential elimination (Fig. 2A).
For the one-compartment PK modeling of PF04217903 in humans, the predicted Cmax, AUC, and t1/2 values from ALS-total were underpredicted by approximately 4.0-, 1.8- and 2.0-fold, respectively (Table 5), whereas plasma concentration-time profiles were reasonably predicted after 6 h postdose (Fig. 2B). In contrast, the predicted Cmax and AUC values from ALS-free were overpredicted by 1.3- and 1.9-fold, respectively, whereas the predicted t1/2 value was significantly underpredicted by 3.4-fold.
PBPK Modeling of PF02341066 and PF04217903 in Preclinical Species and Humans.
The predicted Kp values and the resulting Vss values of PF02341066 and PF04217903 in rats, dogs, and humans are summarized in Supplemental Table 2. PF02341066 showed large Kp values in adipose tissues (42–63 in rats, dogs, and humans) compared with those in the other tissues, which appeared to be largely due to its high lipophilicity. The Kp values of PF04217903 were relatively consistent across all tissues. The predicted Vss values of PF02341066 in rats (13 l/kg) and dogs (14 l/kg) were consistent with the observed values (13 l/kg) in rats and dogs. The Vss value of PF02341066 in humans was predicted to be 19 l/kg. Likewise, the predicted Vss values of PF04217903 in rats (2.4 l/kg) and dogs (3.1 l/kg) were reasonably consistent with the observed values in rats (1.6 l/kg) and dogs (3.7 l/kg). The predicted Vss of PF04217903 in humans was 2.9 l/kg. Thus, the mathematically predicted Vss values of both PF02341066 and PF04217903 were relatively consistent with the predicted values from allometric scaling (Table 4).
The observed and PBPK model-simulated plasma concentration-time profiles of PF02341066 and PF04217903 in preclinical species are graphically presented in Figs. 3 and 4, respectively. The Fabs values of PF02341066 and PF04217903 estimated by the ACAT model were >90% in rats and dogs. Overall PBPK modeling reasonably matched the plasma concentration-time profiles of both PF02341066 and PF04217903 in rats and dogs after single intravenous and oral administrations, although there was a little discrepancy in the late phases (i.e., after 4–6 h postdose) of the intravenous plasma concentration-time profiles of PF04217903 in rats and dogs. As tabulated in Supplemental Table 3, the majority of PK parameters [i.e., Cmax, time at which Cmax occurred (tmax), AUC, and t1/2] calculated from the model-simulated plasma concentration-time profiles were within 2-fold of the observed values for both PF02341066 and PF04217903.
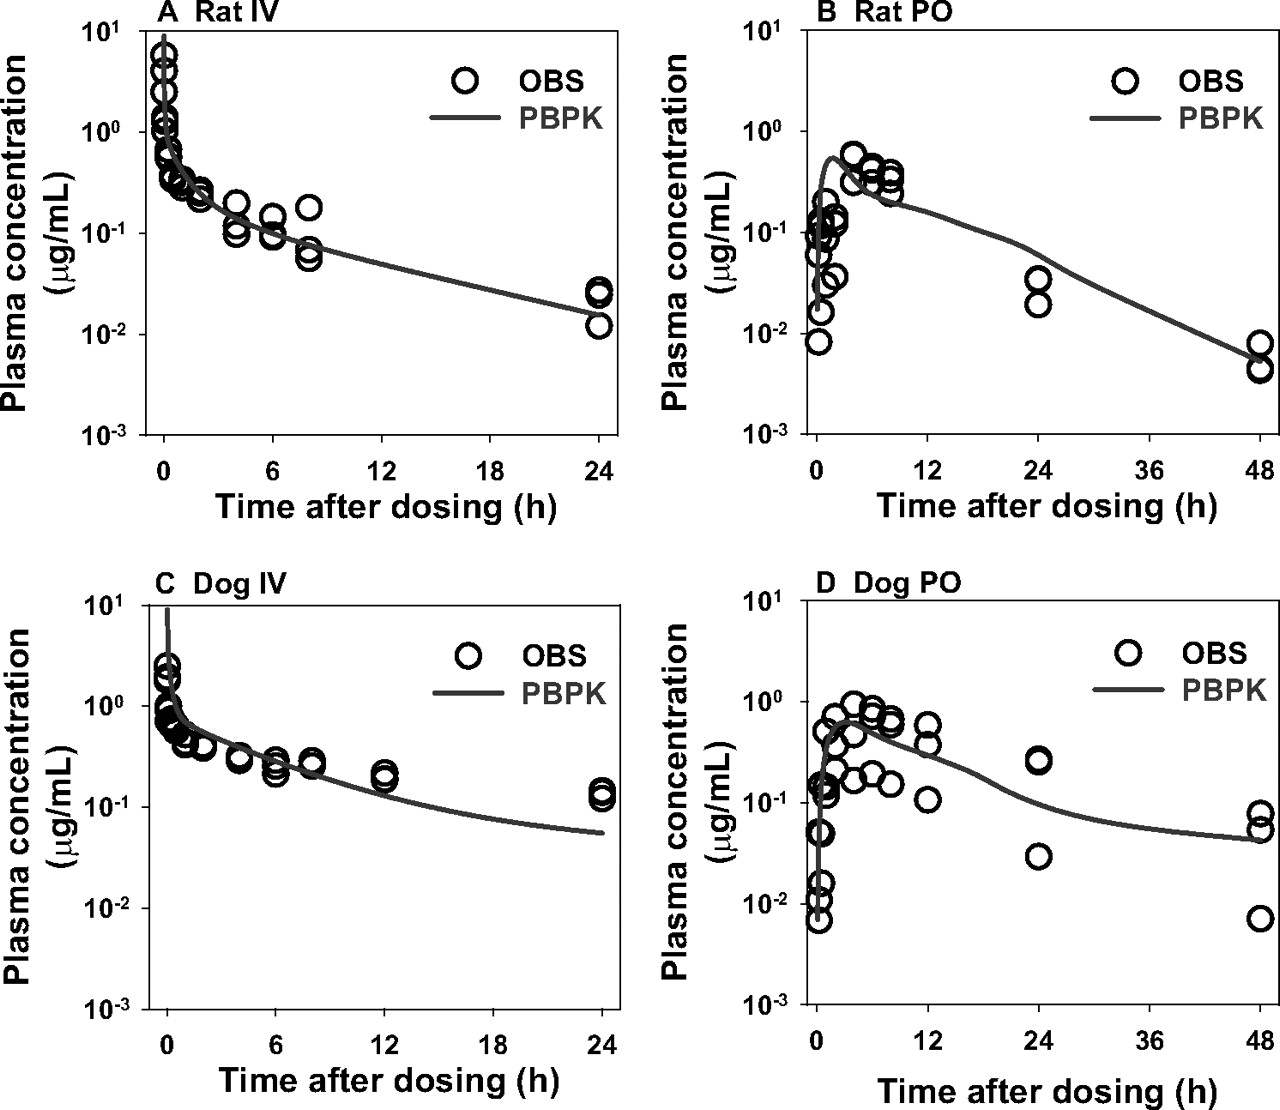
Observed and physiologically based pharmacokinetic model-simulated plasma concentration-time profiles of PF02341066 in rats (A and B) and dogs (C and D) after a single intravenous (IV) (A and C) or oral (PO) (B and D) administration. Observed plasma concentration-time profiles (OBS) were obtained from rats and dogs after a single intravenous and oral administration of PF02341066 at 5 and 25 mg/kg, respectively (n = 3 per group).

Observed and physiologically based pharmacokinetic model-simulated plasma concentration-time profiles of PF04217903 in rats (A and B) and dogs (C and D) after a single intravenous (IV) (A and C) or oral (PO) (B and D) administration. Observed plasma concentration-time profiles (OBS) were obtained from rats and dogs after a single intravenous and oral administration of PF04217903 at 2.5 and 10 mg/kg, respectively (n = 2 per group).
As CL inputs for PBPK modeling in humans, the CLhep values from the IVIVE method, WS-II, and allometric scaling, ALS-CLint, were used as representative PBPK modeling. That is, the CLhep values of PF02341066 used for PBPK modeling were 9.3 and 14 ml per min/kg, respectively, whereas those of PF04217903 were 3.6 and 7.6 ml per min/kg, respectively. The observed and PBPK model-simulated plasma concentration-time profiles of PF02341066 and PF04217903 in humans are graphically presented in Fig. 5. The Fabs values of both PF02341066 and PF04217903 estimated by the ACAT model were >90% in humans. The PK parameters calculated from the model-simulated plasma concentration-time profiles of PF02341066 and PF04217903 are summarized in Table 5 with the prediction accuracy.

Observed and physiologically based pharmacokinetic model-simulated plasma concentration-time profiles of PF02341066 (A) and PF04217903 (B) in humans after oral administration. Observed plasma concentration-time profiles (OBS) were obtained from four patients after oral administration of PF02341066 at 100 mg or from six healthy volunteers after oral administration of PF04217903 at 30 mg. Model-simulated concentrations were predicted by the physiologically based pharmacokinetic modeling using the two different predicted CLhep values from the IVIVE-WS-II (– – –) and ALS-CLint (— —).
By using the predicted CLblood value from WS-II, the Cmax and AUC values of PF02341066 were overpredicted (2.6- and 1.9-fold, respectively), whereas the predicted t1/2 (12 h) was comparable to the observed value (10 h). With the predicted CLblood from ALS-CLint, the Cmax and AUC values of PF02341066 were reasonably consistent (<1.3-fold) with the observed values. The predicted t1/2 (12 h) was also comparable to the observed value. Overall the predicted plasma concentration-time profiles of PF02341066 by PBPK modeling were reasonably matched with the observed profiles (Fig. 5A).
Regarding PBPK modeling of PF04217903 using the predicted CLblood value from WS-II, the Cmax value of PF04217903 was slightly underpredicted by 1.4-fold, whereas the AUC value was overpredicted by 2.2-fold. The predicted t1/2 (11 h) was 1.7-fold longer than the observed value (6.6 h). With use of the predicted CLblood from ALS-CLint, the Cmax value was underpredicted by 2.3-fold, whereas the AUC value was relatively consistent (1.3-fold error). The predicted t1/2 (6.3 h) was also consistent with the observed value. Thus, PBPK modeling of PF04217903 tends to underpredict Cmax values by approximately 2-fold, whereas AUC and t1/2 values were within an acceptable range of 2-fold. Overall the predicted plasma concentration-time profiles of PF04217903 by PBPK modeling using the predicted CLblood from ALS-CLint were reasonably matched with the observed profiles (Fig. 5B).
Discussion
PBPK modeling is a mechanistic approach that allows the disposition of drug candidates to be predicted in different species including humans (Jones et al., 2006; De Buck et al., 2007; Lavé et al., 2007; Nestorov, 2007). The modeling is generally achieved by using physiological parameters (e.g., organ volume and blood flow) and drug-dependent parameter (e.g., permeability, Kp, and CL). The recently developed mechanistic tissue composition-based equations could accurately predict Vss based on the physicochemical properties of each compound (Poulin and Theil, 2002; Berezhkovskiy, 2004; Rodgers et al., 2005; Rodgers and Rowland, 2006). These equations have greatly extended the applicability of PBPK modeling to PK prediction (Jones et al., 2006; De Buck et al., 2007; Lavé et al., 2007; Nestorov, 2007). In contrast, CL as one of the most important inputs in PBPK modeling is predicted by a variety of methods such as IVIVE, ALS, and others. Therefore, PBPK modeling has to rely on at least one of the CL prediction methods. In general, animal data are used to verify which IVIVE method would be used for CL prediction in humans. However, it is often difficult to choose the best IVIVE method based on animal data. A number of investigators have reported hepatocytes to be a superior system for CL prediction, with microsomes also providing reasonable data (Houston and Carlile, 1997; Obach, 1999; Naritomi et al., 2003). Both microsomes and hepatocytes were used in the present study to investigate the IVIVE approach as oxidative biotransformation was considered to be the major clearance pathway because 1) PF02341066 and PF04217903 were mainly metabolized to oxidative metabolites across species with little qualitative species differences in metabolite profiles (in house data) and 2) the contributions of urinary and biliary excretions of PF02341066 (<1 and 15% of the dose as parent drug, respectively) and PF04217903 (<1 and 5% of the dose, respectively) to systemic clearance were minimal in preclinical species. The decision of whether to incorporate fu, blood and fu, vitro into the IVVIE method seems to remain controversial (Obach, 1999; Riley et al., 2005; De Buck et al., 2007). The inclusion of both the unbound fractions (i.e., WS-I) has been generally suggested, whereas several investigators reported that disregarding all binding (i.e., WS-II) could provide better CL predictions for some compound classes (Obach et al., 1997; Obach, 1999; De Buck et al., 2007). Because PF02341066 showed similar values for fu, blood and fu, vitro, the CLhep values calculated by WS-I and WS-II were relatively comparable (Table 3). Overall, the estimated CLhep values from rat and monkey microsomes were more consistent with the CLblood compared with respective hepatocytes, whereas the CLhep values from dog hepatocytes were more consistent with the CLblood than with its microsomes. PF04217903 showed lower fu, blood compared with fu, vitro; thus, the calculated CLhep values by WS-I were 1.5- to 4-fold lower than those by WS-II. Disregarding whether microsomes or hepatocytes were used, the CLhep values of PF04217903 calculated from WS-I were more consistent with the CLblood than those from WS-II in rats, whereas the opposite trend was observed in dogs, in which the CLhep values from WS-II were more consistent with the CLblood in dogs than those from WS-I. Thus, there was no consistent IVIVE method to provide a better projection of in vivo CLblood for each PF02341066 and PF04217903 from one in vitro system and/or one mathematical model. The best use of an IVIVE method depends on knowing which in vitro metabolism system, which mathematical model, and which animal species are the most representatives in humans; thus, CL prediction of PF02341066 and PF04217903 in humans by the IVIVE methods is highly challenging.
Whereas the IVIVE approach has a physiological basis with theoretical mathematic modeling compared with empirical allometric scaling, studies comparing CL prediction by IVIVE and ALS have been minimal, with a few controversial reports (Obach et al., 1997; Mahmood, 2002; Shiran et al., 2006; Hosea et al., 2009). Therefore, there does not seem to be a clear answer about which method is more reliable for PK prediction in humans. Concerning ALS, Mahmood and Balian (1996) proposed a rule of exponents, which recommended judicious use of either MLP or BRW, depending on the ALS exponent. When the rule of exponent was applied to PF02341066, the predicted CLblood was 3.9 ml per min/kg by ALS-MLP (Table 4). The prediction accuracy with this method was worse than those with ALS-CL and ALS-CLint. Simple CL extrapolation from monkeys to humans based on the difference in Qb was reported by Jolivette and Ward (2005). Predicted CLblood by this method was 11 ml per min/kg, which was relatively consistent with the predicted values from ALS-CLint and IVIVE in microsomes. For PF04217903, we could not evaluate an exponent of the ALS-CL because of a lack of the third species. It has been reported that each species has a different influence on allometric scaling (Lavé et al., 1995; Tang and Mayersohn, 2005). A species close to the center of the regression, e.g., monkeys between rats and dogs, has less influence on the prediction because its data point lies close to the center of the regression. On the other hand, the importance of monkey data for CL prediction was reported (Jolivette and Ward, 2005; Goteti et al., 2008). Currently, it is not clear how monkey data make an impact on CL prediction of PF04217903. Several investigators (Obach et al., 1997; Chiou et al., 1998; Hosea et al., 2009) reported that ALS including interspecies differences in fu, blood was more reliable than simple ALS. The current study result seems to be consistent with these reports: ALS-CLint provided the most accurate CL inputs of the PBPK modeling for both PF02341066 and PF04217903.
The allometric exponents for Vss and Vss, u of PF02341066 and PF04217903 were close to unity (Table 4), suggesting that the Vss values of these compounds were linearly related to their body weights in preclinical species. Because both PF02341066 and PF04217903 showed an approximately 2-fold difference in fu, blood across species including humans (Table 2), the inclusion of a protein binding correction in ALS for Vss resulted in 2- to 3-fold differences in the predicted Vss values for both compounds (Table 4). These differences largely affected the plasma concentration-time profile simulation. The predicted AUC values of PF02341066 by ALS-total were approximately 4-fold higher than the observed values. The simulated AUC and Cmax values of PF04217903 by ALS-total were 2- to 4-fold lower than the observed values. In contrast, the simulated AUC and Cmax values of PF02341066 and PF04217903 by ALS-free were within 2-fold of the observed values, demonstrating that the overall prediction accuracy by ALS could be better for both compounds when the species difference in fu, blood was corrected. When the simulated plasma concentration-time profiles were compared between PBPK modeling with CL from ALS-CLint versus the one-compartment PK modeling based on ALS-free, PBPK modeling provided better AUC prediction for both PF02341066 (1.2- versus 1.8-fold error) and PF04217903 (1.3- versus 1.9-fold error) (Table 5). Of more importance, the simulated plasma concentration-time profiles of PF02341066 and PF04217903 by PBPK modeling appeared to be relatively consistent with the observed profiles showing multiexponential declines (Fig. 5), resulting in comparable apparent t1/2 values for both the compounds: the observed and predicted t1/2 values were, respectively, 10 and 12 h for PF02341066 and 6.6 and 6.3 h for PF04217903. The predicted t1/2 values by the one-compartment PK model were 17 h for PF02341066 and 1.9 h for PF04217903. Therefore, PBPK modeling has the potential to be more useful and reliable for the PK prediction of PF02341066 and PF04217903 compared with traditional one-compartment PK modeling.
In summary, the present study provides examples to show that PBPK modeling can be used to predict PK profiles in humans. Because blood flows and tissue volumes are drug-independent components of PBPK modeling, the success of in vivo PK prediction seems to largely depend on the quality of the prediction accuracy of in vivo CL, which most likely varies from compound to compound. This will be key to a successful application of PBPK modeling. As presented in this article, ADME scientists generally generate large amounts of preclinical in vitro and in vivo data for clinical drug candidates to predict PK parameters, in particular CL and Vss, in humans. However, ADME scientists are facing the dilemma of how to use the preclinical information in an appropriate manner to prospectively predict in vivo PK in humans (Beaumont and Smith, 2009). Furthermore, prediction accuracies of PK parameters such as CL, Vss, and Foral for most oral drugs are actually never evaluated because of a lack of intravenous PK data in humans, which is another dilemma ADME scientists are facing. For this gap, ADME scientists have started focusing on the prediction of plasma concentration-time profiles of clinical drug candidates by PBPK modeling. The prediction of plasma concentration-time profiles is also in line with the current focus on translational pharmacology, for which the plasma concentration-time profiles of clinical candidates are seen as the first surrogate markers of pharmacological effects.
Authorship Contributions
Participated in research design: Yamazaki and Koudriakova.
Conduct experiments: Skaptason, Romero, and Vekich.
Performed data analysis: Yamazaki, Skaptason, and Romero.
Wrote or contribute to the writing of the manuscript: Yamazaki, Skaptason, Vekich, Jones, and Koudriakova.
Others: Tan and Wilner.
Acknowledgments
We acknowledge the expert technical assistance of members of the Pharmacokinetics Group (Pfizer Worldwide Research and Development, San Diego, CA), Robert Hunter and David Paterson, for the animal experiments. We also thank Henry Cheng, Jean Cui, Michelle Tran-Dube, Pei-Pei Kung, and Mitch Nambu (Pfizer Worldwide Research and Development) for synthesizing PF02341066 and PF04217903. We acknowledge and thank Emi Kimoto, Bhasker Shetty, Bill Smith, and Paolo Vicini (Pfizer Worldwide Research and Development) for excellent input to the draft manuscript.
Footnotes
Article, publication date, and citation information can be found at http://dmd.aspetjournals.org.
doi:10.1124/dmd.110.035857.
↵
 The online version of this article (available at http://dmd.aspetjournals.org) contains supplemental material.
-
ABBREVIATIONS:
- ADME
- absorption, distribution, metabolism and excretion
- PK
- pharmacokinetics
- CL
- clearance
- Vss
- volume of distribution at steady-state
- Fabs
- fraction absorbed
- Foral
- oral bioavailability
- IVIVE
- in vitro-in vivo extrapolation
- PBPK
- physiologically based pharmacokinetic
- PF02341066
- (R)-3-[1-(2,6-dichloro-3-fluoro-phenyl)-ethoxy]-5-(1-piperidin-4-yl-1H-pyrazol-4-yl)-pyridin-2-ylamine
- PF04217903
- 2-[4-(3-quinolin-6-ylmethyl-3H-[1,2,3]triazolo[4,5-b]pyrazin-5-yl)-pyrazol-1-yl]-ethanol
- HPLC
- high-performance liquid chromatography
- LC
- liquid chromatography
- MS/MS
- tandem mass spectrometry
- AUC
- area under the plasma concentration-time curve
- MLP
- maximum life span
- BRW
- brain weight
- ALS
- allometric scaling
- ACAT
- Advanced Compartmental Absorption and Transit.

- Received August 13, 2010.
- Accepted November 17, 2010.
- Copyright © 2011 by The American Society for Pharmacology and Experimental Therapeutics


