


Abstract
We determined the disposition of a single 300-mg dose of [14C]celecoxib in eight healthy male subjects. The [14C]celecoxib was administered as a fine suspension reconstituted in 80 ml of an apple juice/Tween 80/ethanol mixture. Blood and saliva samples were collected at selected time intervals after dosing. All urine and feces were collected on the 10 consecutive days after dose administration. Radioactivity in each sample was determined by liquid scintillation counting or complete oxidation and liquid scintillation counting. Metabolic profiles in plasma, urine, and feces were obtained by HPLC, and metabolites were identified by mass spectrometry and NMR. [14C]Celecoxib was well absorbed, reaching peak plasma concentrations within 2 h of dosing. [14C]Celecoxib was extensively metabolized, with only 2.56% of the radioactive dose excreted as celecoxib in either urine or feces. The total percentage of administered radioactive dose recovered was 84.8 ± 4.9%, with 27.1 ± 2.2% in the urine and 57.6 ± 7.3% in the feces. The oxidative metabolism of celecoxib involved hydroxylation of celecoxib at the methyl moiety followed by further oxidation of the hydroxyl group to form a carboxylic acid metabolite. The carboxylic acid metabolite of celecoxib was conjugated with glucuronide to form the 1-O-glucuronide. The percentages of the dose excreted in the feces as celecoxib and the carboxylic acid metabolite were 2.56 ± 1.09 and 54.4 ± 6.8%, respectively. The majority of the dose excreted in the urine was the carboxylic acid metabolite (18.8 ± 2.1%); only a small amount was excreted as the acyl glucuronide (1.48 ± 0.15%).
Cyclooxygenase (COX)1 catalyzes the conversion of arachidonic acid to prostaglandin H2, a key step in the generation of proinflammatory eicosanoid mediators (Vane, 1971; Davies et al., 1984;Needleman et al., 1986). COX is present in two forms in human cells (DeWitt and Smith, 1988; Merlie et al., 1988): one form is constitutive (COX-1) and is widely expressed in nearly all tissues throughout the body (Kujubu et al., 1991; Xie and Chipman, 1991), and the other form is inducible (COX-2) and is predominantly expressed in inflamed tissues (Masferrer et al., 1994). Since the early 1970s, the mechanism of action of nonsteroidal anti-inflammatory drugs has been attributed to the blockade of the production of prostaglandins by the inhibition of COX (Vane, 1971; Davies et al., 1984). The hypothesis fueling the development of specific COX-2 inhibitors as anti-inflammatory agents is that the anti-inflammatory efficacy of traditional nonsteroidal anti-inflammatory drugs is due to inhibition of COX-2, whereas the adverse effects (gastrointestinal, platelet) are due to inhibition of COX-1.
Celecoxib (4-[5-(4-methylphenyl)-3-(trifluoromethyl)-1H-pyrazol-1-yl]benzenesulfonamide;Penning et al., 1997) is an inhibitor of COX-2 that has analgesic and anti-inflammatory effects in patients with rheumatoid arthritis and no effect on COX-1 activity at therapeutic plasma concentrations (Isakson et al., 1998). Celecoxib was recently approved in the United States for relief of the signs and symptoms of osteoarthritis and rheumatoid arthritis in adults.
Celecoxib is extensively metabolized in animals (Paulson et al., 1997). Excretion of intact celecoxib is a very minor route of elimination. The major route of excretion of metabolites of celecoxib is biliary. Celecoxib is metabolized via a single oxidative pathway. The methyl group of celecoxib is first oxidized to a hydroxymethyl metabolite, followed by further oxidation of the hydroxyl metabolite to a carboxylic acid analog (Paulson et al., 1997). Glucuronide conjugates of the hydroxyl and carboxylic acid metabolites of celecoxib are produced by rat and rabbit (S.K.P., unpublished data). The objective of the present study was to characterize the metabolism and excretion of celecoxib after the oral administration of a single dose to healthy male adults.
Materials and Methods
Chemicals.
Celecoxib and radiolabeled celecoxib (4-[5-(4-methylphenyl)-3-(trifluoromethyl)-1H-pyrazol-1-yl-5-[14C]benzensulfonamide; Fig. 1) were synthesized at G. D. Searle & Co. (Skokie, IL). The specific activity of the [14C]celecoxib was approximately 0.33 μCi/mg. The hydroxyl and carboxylic acid metabolites of celecoxib were synthesized at G. D. Searle & Co.,, and the structures were confirmed by mass spectrometry (MS) and NMR (Fig.2). All other chemicals and reagents were of analytical grade and available commercially.

Chemical structure for celecoxib.
*Position of radiolabeled carbon.

Proposed metabolic pathway for celecoxib in humans.
Subjects and Dosage.
Eight healthy male volunteers between the ages of 18 and 50 years were administered 300 mg of [14C]celecoxib. The [14C]celecoxib was administered as a fine suspension reconstituted in 80 ml of an apple juice/Tween 80/ethanol mixture.
Sample Collection.
Blood samples were collected before dosing and 0.5, 1, 1.5, 2, 2.5, 3, 4, 6, 8, 12, 16, 24, 36, 48, 60, and 72 h after dosing into chilled Vacutainer tubes. Plasma was obtained by centrifugation of blood for 10 min at approximately 2000g at 4°C. Urine samples were collected and pooled during the following time intervals: −12 h before dosing to 0 h; at 0 to 1, 1 to 2, 2 to 3, 3 to 4, 4 to 8, 8 to 12, and 12 to 24 h after dosing; and at six consecutive 24-h collection periods beginning 24 h after dosing. During the collection interval, the urine was stored at approximately 4°C. At the end of each collection period, the volume of the urine was recorded, and the sample was frozen immediately on dry ice. Individual fecal samples were collected beginning 12 h before dosing and continued through the morning (8:00 AM) of the 10th day after dosing. Each fecal sample was weighed and immediately frozen on dry ice. Saliva samples (2 ml) were obtained at −30 min before dosing and at 0.5, 1, 2, 4, 6, 8, 12, and 24 h after dosing. The saliva samples were immediately frozen on dry ice. All samples were stored at approximately −20°C until analysis.
Total Radioactivity Determination.
Plasma, urine, and saliva.
Samples were homogenized by vortexing, and duplicate 500-μl aliquots were taken and placed in scintillation vials. A 5-ml aliquot of Ultima-Gold scintillation cocktail (Radiomatic, Meriden, CT) was added, and the total radioactivity in the samples was determined by liquid scintillation counting (LSC).
Red blood cells.
The samples were homogenized by vortexing. Duplicate aliquots (0.5 g) were placed in Combusto cones and pads (Packard Instrument Co., Downers Grove, IL), combusted in a Packard Oxidizer model 306 or 307 (Packard Instrument Co), and analyzed by LSC.
Feces.
Fecal samples were weighed. Approximately two to three times the sample weight of methanol/water (80:20, v/v) was added. The resulting mixture was weighed and then homogenized using a probe homogenizer. Duplicate weighed aliquots (approximately 0.5 g) were taken for analysis and combusted in a Packard Oxidizer. The resulting14CO2 was trapped using Carbo-Sorb (Packard Instruments Co.). Perma-Fluor E liquid scintillation cocktail (Packard Instruments Co.) was added, and samples were analyzed by LSC.
The percentage of dose excreted in urine or feces was calculated as dpm in urine or feces divided by total dpm dosed to volunteer × 100. Background levels of radioactivity were determined in plasma, saliva, red blood cells, urine, and feces obtained before dosing from all subjects. Background levels of radioactivity were subtracted before calculations.
The total recovery data from subjects 105 and 106 (65.6 and 131%, respectively) suggested a potential sample mix-up. Therefore, the fecal and fecal wipe data from these subjects were excluded from the excretion data summaries.
Quantitative Metabolic Profiling.
Plasma was extracted using a solid phase extraction (SPE) C-18 Bond Elut column (3 ml, C-18; Varian, Harbor City, CA), which was preconditioned with 6 ml of acetonitrile and 6 ml of methanol. The SPE columns were rinsed with 6 ml of water and left hydrated before application of the sample. After application of the sample, the column was washed with 6 ml of water. The radioactive compounds retained on the column were eluted with 6 ml of acetonitrile and 3 ml of methanol. The extracts were evaporated to dryness in a heated water bath under a gentle stream of nitrogen. The residues were reconstituted in 15% acetonitrile in 0.010 M sodium phosphate buffer, pH 4.5, before being injected onto the HPLC system for determination of the metabolic profile. To determine the distribution of radioactivity in the urine samples, samples were directly injected onto the HPLC system.
To determine the distribution of radioactivity in feces, aliquots (approximately 0.2 g) of fecal homogenates were pooled on a percent weight basis and extracted with 15 ml of methanol by end-over-end rotation for 1.5 h at room temperature. The fecal extracts were centrifuged at approximately 2000g for 10 min at 4°C using a Sorvall RT6000D centrifuge (DuPont Co., Wilmington, DE). The supernatant volume was measured, aliquots were taken, and radioactivity was determined by LSC. The pellet was resuspended in 15 ml of methanol, vortexed briefly, and extracted as described earlier. The extracts were combined and evaporated in a heated water bath under a stream of nitrogen. The residues were reconstituted in 3.0 ml of methanol and centrifuged at approximately 2000g for 10 min at 4°C. Aliquots of the reconstituted residues were evaporated in a heated water bath under a stream of nitrogen; reconstituted in 15% acetonitrile containing 0.025 M sodium acetate, pH 4.5; and directly injected onto the HPLC system.
The extraction recovery of radioactivity from plasma and feces was greater than 90%, indicating that the HPLC profiles accounts for the majority of the metabolites in the samples. The metabolites in plasma extracts, urine, and fecal extracts were identified on the basis of retention times compared directly with synthetic standards. The structures were confirmed by MS and NMR (see below).
The percentage of celecoxib and metabolites excreted in urine and feces was calculated as follows: percentage of dose excreted as celecoxib or metabolite = percentage of dose excreted in urine or feces × fraction of radioactivity associated with celecoxib or metabolite on HPLC.
Incubation of Urine Samples with β-Glucuronidase.
Selected urine samples were incubated with β-glucuronidase to determined the presence of glucuronide or sulfate-conjugated metabolites. Urine samples were centrifuged at 3000 rpm for 10 min. Aliquots (500 μl) of the supernatant were mixed with 500 μl of 0.2 M sodium acetate buffer, pH 5.0. An aliquot (20 μl) of bovine liver β-glucuronidase in 50% glycerol solution, pH 5.0 (Sigma Chemical Co., St. Louis, MO) was added to two selected urine aliquots. The remaining urine sample aliquots to which no enzyme was added were used as controls. All samples were incubated at 37°C for 16 h. After the incubation, 0.1 ml of each sample was removed and injected onto the HPLC system to determine the metabolic profile.
HPLC.
HPLC analysis of plasma, urine, and fecal samples was performed using a Hewlett Packard HP1050 autosampler and HP1050 pump (Hewlett Packard, Wilmington, DE) equipped with a Waters Novapak C-18 column (3.9 × 150 mm, 5 μM; Marlborough, MA) and a Waters Novapak C-18 guard column. A linear gradient was used from 20% acetonitrile in 0.025 M sodium acetate buffer, pH 4.5 (mobile phase A), to 60% acetonitrile in 0.025 M sodium acetate buffer, pH 4.5 (mobile phase B), over 20 min and held at 100% mobile phase B for 5 min before being re-equilibrated at 100% mobile phase A for 20 min. The flow rate of mobile phase was 1 ml/min. Eluates from the HPLC column after the injection of urine samples and fecal extracts were mixed with Ultima Flo (Packard Instruments Co.) at a ratio of 1:3 (v/v) and analyzed for radioactivity using a Flo-One/Beta A-500 radioactivity detector. Plasma extracts were injected onto the HPLC system, and 0.5-min fractions were collected using an ISCO Foxy 200 (ISCO Inc., Lincoln, NE) fraction collector. Each fraction was mixed with 10 ml of Ultima Gold scintillation cocktail (Radiomatic, Meriden, CT), and carbon-14 was determined by LSC.
Preparation of Urine Samples for MS and NMR Analysis.
The eluent from the HPLC column containing the radioactive metabolite peaks was collected into 20-ml glass scintillation vials. The fractions were diluted with Milli-Q water to approximately 5% acetonitrile and subjected to the SPE extraction procedure described previously for plasma to remove the sodium acetate buffer. The eluent from the SPE procedure was dried under a stream of nitrogen in preparation for analysis by MS.
Samples for NMR were analyzed using a linear gradient HPLC system of 20% acetonitrile in 0.025 M ammonium acetate, pH 4.5, to 60% acetonitrile in 0.025 M ammonium acetate, pH 4.5, over a 15-min period. The flow rate of mobile phase was 1.5 ml/min. The eluent from the HPLC column containing the radioactive metabolites was collected into a glass vial. These samples were diluted 1:1 with acetonitrile, evaporated in a heated water bath under a stream of nitrogen, and analyzed by NMR.
MS and NMR.
The electrospray ionization (ESI) and the atmospheric pressure ionization (APCI) analyses were performed using the Finnigan MAT (San Jose, CA) ESI source assembly and APCI source assembly on a Finnigan MAT TSQ700 MS/MS system. All spectra were determined by loop injection into a 0.5 ml/min flow of 50:50 methanol/water solution that contained 25 mM ammonium acetate and 25 mM acetic acid. The mobile phase was delivered by a Beckman model 100 A pump (Beckman Instruments, Fullerton, CA). The ESI needle was held at 4.5 kV with an 80 psi sheath gas pressure and a 10 ml/min auxiliary gas flow of nitrogen. The capillary was held at 200°C, and argon was used as the collision gas for MS/MS experiments at 50 eV energy. For APCI analyses, all conditions were similar to ESI except that the corona needle was regulated to a 5-μA emission, the vaporizer was 400°C, and the capillary was 150°C.
All NMR spectra were determined using a CD3CN solution in a 3-mm concentric capillary tube and a Bruker AMX-500 instrument (Bruker Instruments, Billerica, MA) with a 5-mm indirect detection probe.
Plasma Celecoxib Assay.
Human plasma (0.3 ml) containing celecoxib and internal standard was treated with 100 μl of 1.0 N phosphoric acid. The plasma samples were extracted with a cation exchange/hydrophobic mixed-mode SPE column (Jones Chromatography, Lakewood, CO) preconditioned with 2 × 1 ml of acetonitrile followed by 2 × 1 ml of water. The samples were eluted from the SPE column with 1.0 ml of 1% ammonium hydroxide in methanol. The extract was evaporated under nitrogen, and the samples were dissolved into 200 μl of HPLC mobile phase, acetonitrile/0.01 M sodium phosphate buffer, pH 9 (50:50, v/v). An aliquot of the sample extract was injected onto a C-18 Nova Pak column (15 cm × 3.9 mm, 4 μM; Waters Associates, Milford, MA) using a 15 mm × 3.2 mm, 7 μM RP-18 New Guard Cartridge (Brownlee Labs, Inc., Santa Clara, CA). The mobile phase, acetonitrile/0.01 M sodium phosphate buffer, pH 9 (50:50, v/v), was run at a flow rate of 1.0 ml/min. The analyte was quantified using peak height ratios to the internal standard with a fluorescence detector with excitation at 240 nm and emission at 380 nm. The analyte was compared against a standard curve (0.010–5.00 μg celecoxib/ml) prepared as described earlier.
Results
Plasma Profiles of Drug and Total Radioactivity.
The plasma concentrations of radioactivity and celecoxib are shown in Fig. 3. Peak plasma concentrations of radioactivity (2.75 ± 0.45 μg Eq/ml) were achieved at 1.75 ± 0.30 h after dosing. Plasma concentrations of radioactivity had substantially decreased by 4 h after dosing. In all except two subjects, radioactive concentrations were below the limit of detection of the assay by 72 h after dosing. The AUC0–∞ value for radioactivity was 22.7 ± 1.8 μg Eq × h/ml. The terminal elimination half-life of radioactivity was 17.0 h.

Mean ± S.E. plasma concentrations of celecoxib (see legend) and radioactivity in healthy male volunteers administered a single oral dose of 300 mg of [14C]celecoxib.
The mean maximum plasma concentration and AUC0–48h values for celecoxib were 1.53 μg/ml and 8.71 μg × h/ml, respectively. The mean time to maximal plasma concentration was 1.42 h. The mean elimination half-life of celecoxib was 11.5 h.
Representative radiochromatograms of plasma samples obtained after the oral administration of [14C]celecoxib are shown in Fig. 4. In addition to celecoxib, three metabolites of celecoxib were observed in plasma. Two of the three metabolites coeluted on HPLC with authentic standards of the hydroxyl metabolite (M-3) and a carboxylic acid metabolite (M-2; Fig.2). The third peak coeluted at the same retention time as a 1-O-glucuronide of the carboxylic acid metabolite (M-1) that was identified in urine. At 0.5 h after dosing, mean plasma celecoxib concentrations represented about 85% of total plasma radioactivity, whereas at the later time points (3–12 h after dosing), plasma celecoxib concentrations were 50 to 65% of the total radioactivity. The percentages of plasma radioactivity associated with each of these metabolites are listed in Table1.

Representative HPLC radiochromatograms of plasma samples obtained 0.5 (top), 3 (middle), and 12 h (bottom) after the oral administration of 300 mg of [14C]celecoxib to healthy male volunteers.
HPLC profile of radioactivity in plasma
Excretion of Administered Radioactivity.
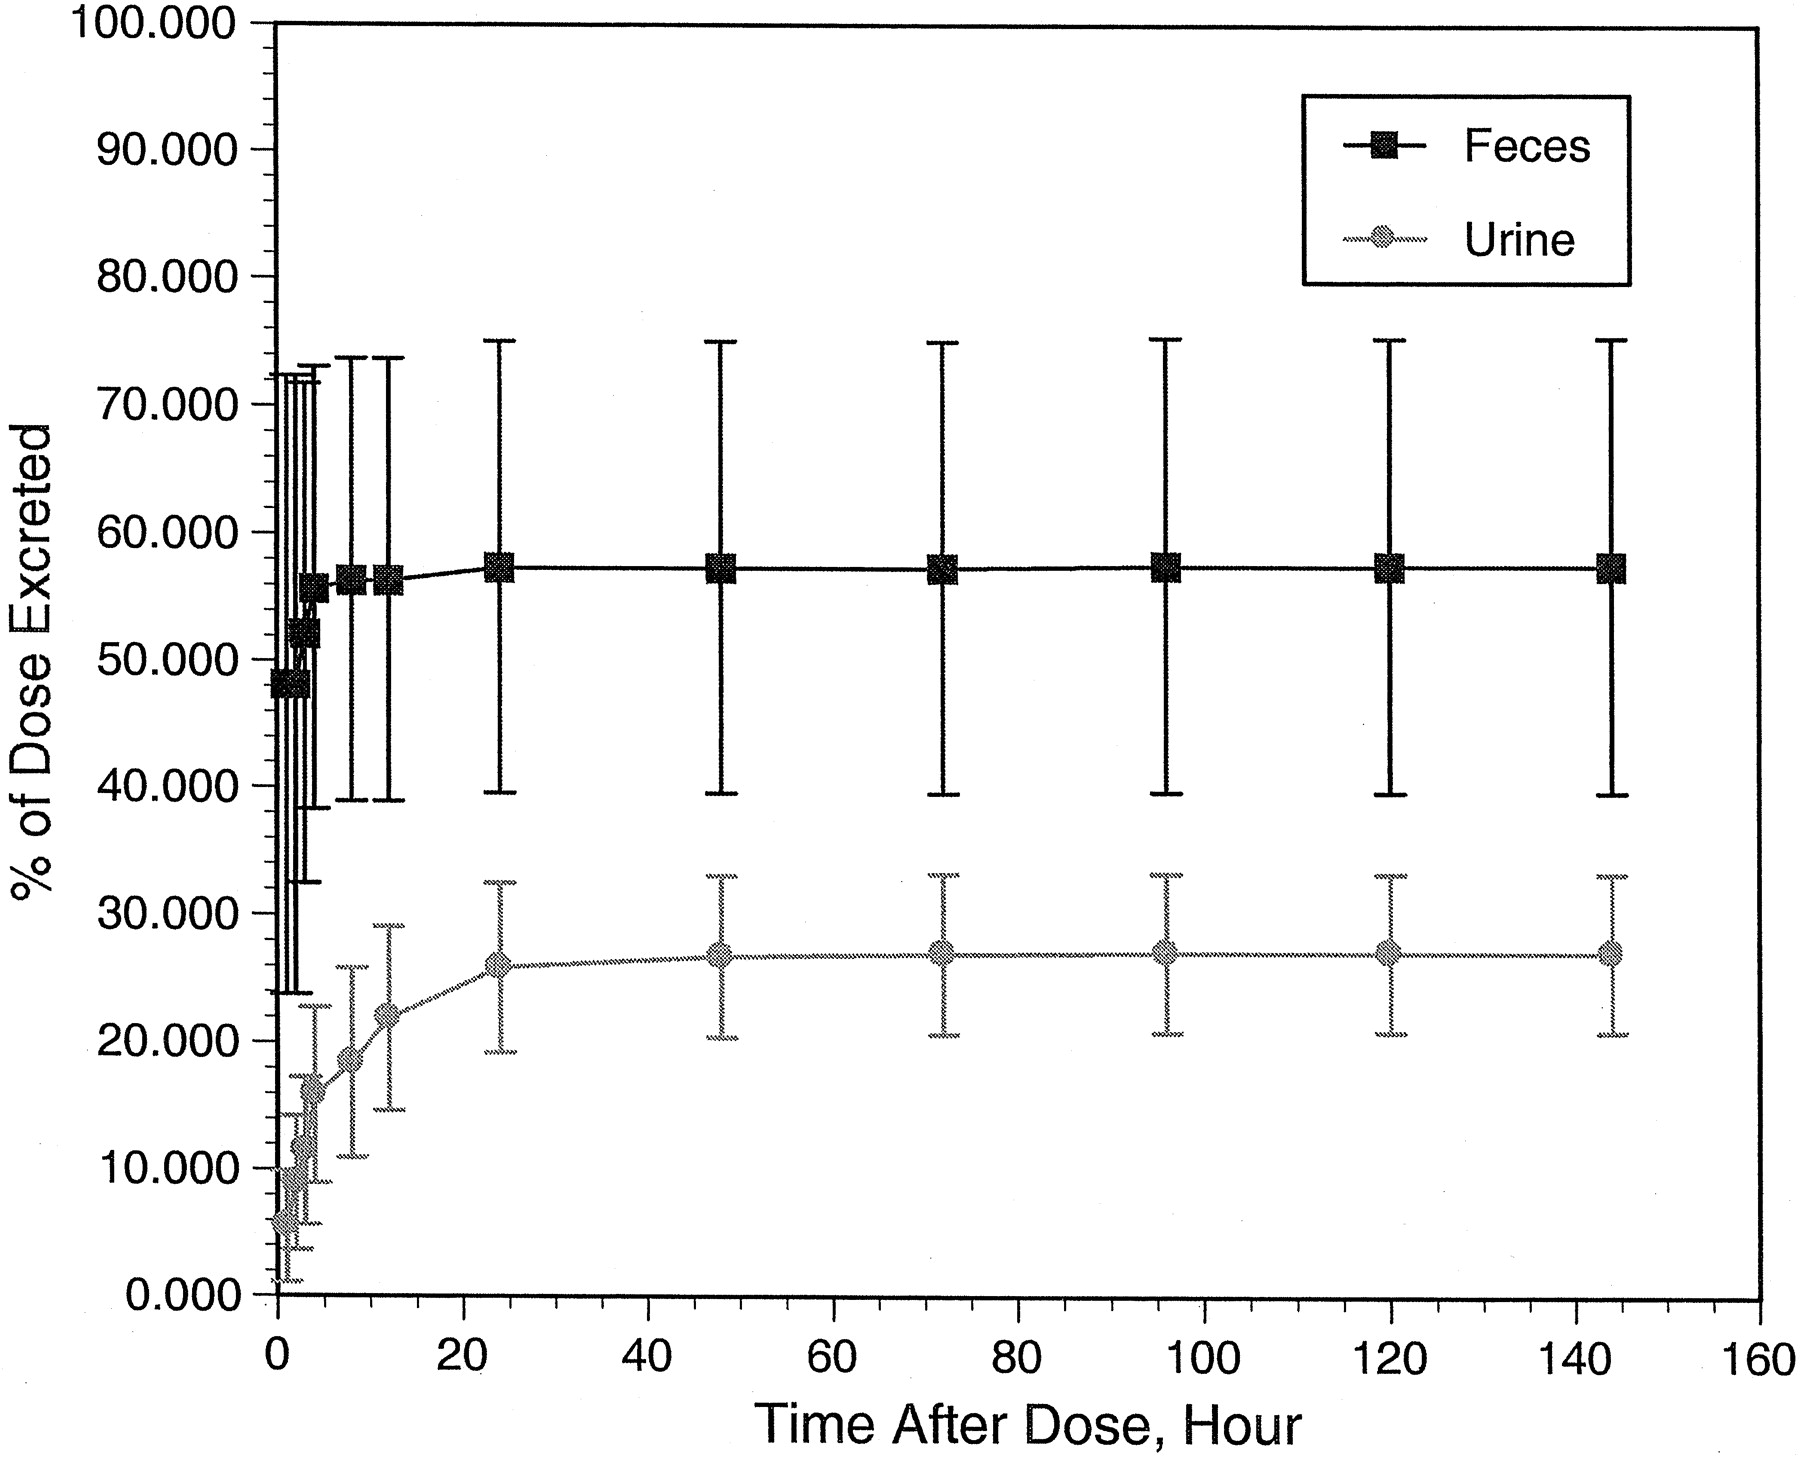
A summary of the excretion of radioactivity for the individual subjects is given in Table 2. The mean ± S.E. of the radiolabeled dose recovered in the urine, saliva, feces, and fecal wipes was 84.8 ± 4.9%. The majority of the radioactivity was detected in fecal samples (57.6 ± 7.3%) and urine samples (27.1 ± 2.2%), with only negligible amounts detected in saliva (0.03 ± 0.01%) and fecal wipes (0.11 ± 0.05%). The majority (>80%) of the detected radioactivity was observed within 12 h of dosing in the urine and within 4 days of dosing in feces (Fig. 5). Across individual subjects, urinary recovery of total radioactivity was consistent, whereas fecal recovery was quite variable. The somewhat lower recovery of the total radioactivity in some subjects may reflect incomplete collection of the fecal samples.
Total recovery of radioactivity in subjects administered a single oral dose of 300 mg [14C]celecoxib

Cumulative excretion of radioactivity in urine (see legend) and feces after the oral administration of 300 mg of [14C]celecoxib to healthy male volunteers.
Metabolic Profiles in Urine and Feces.
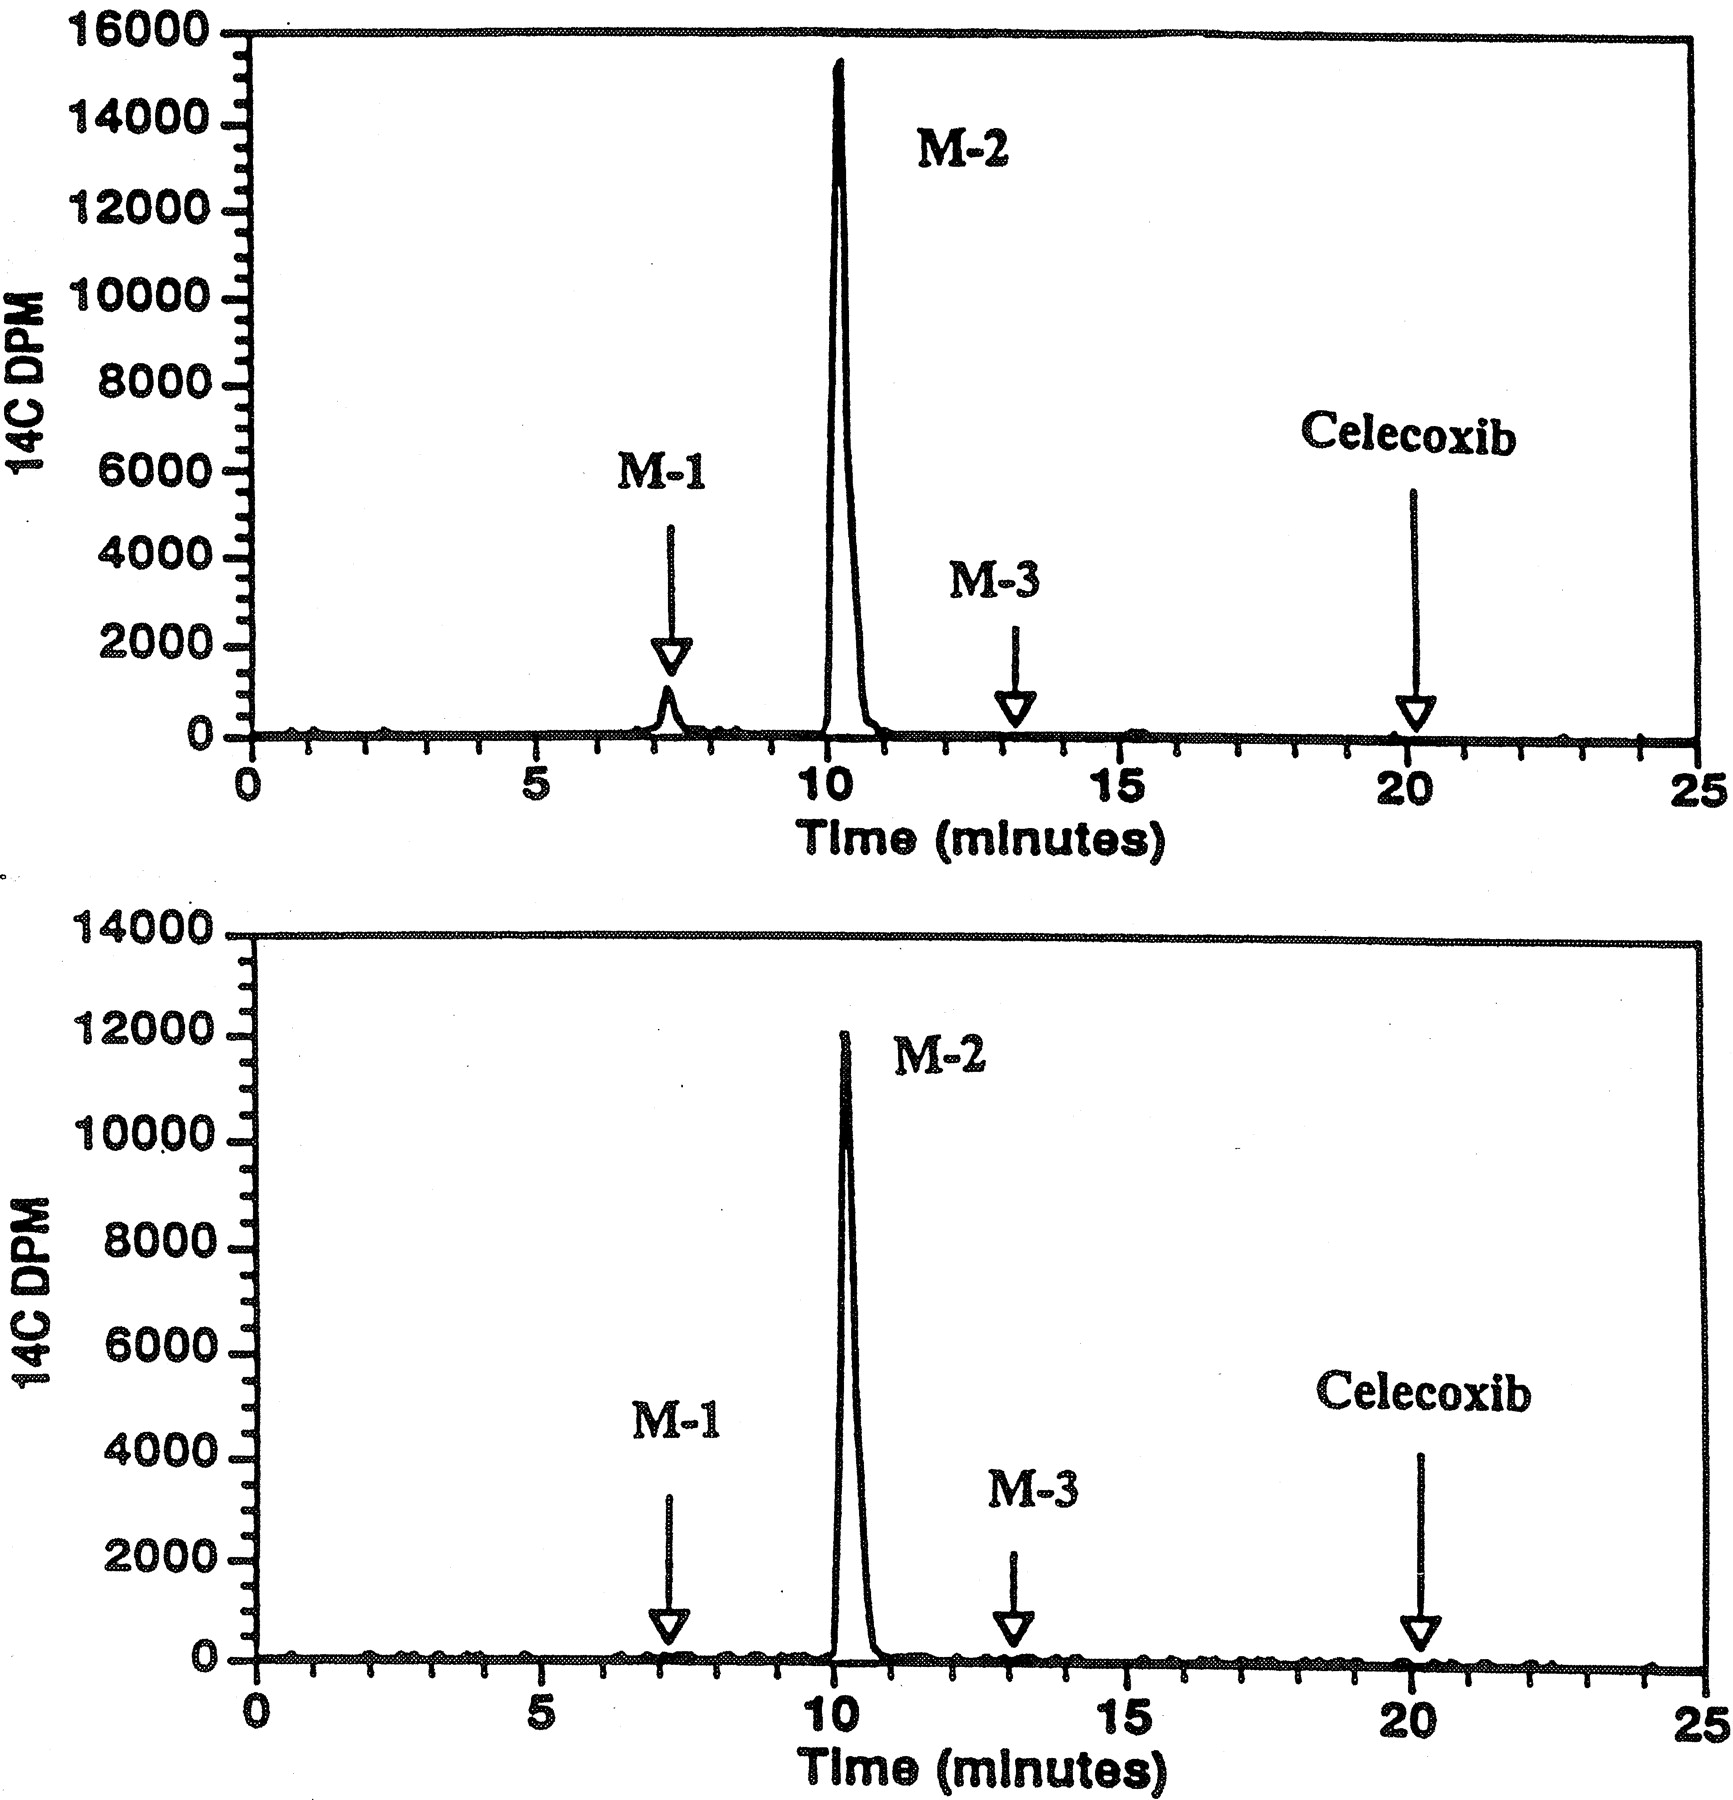
Representative radiochromatograms of urine are shown in Fig.6 (top). The majority of urine radioactivity had the same retention time as the carboxylic acid metabolite and was designated M-2. The second peak of radioactivity was identified as the glucuronide conjugate of the acid metabolite (M-1; see below). No celecoxib was detected in radiochromatograms of urine samples. The percentages of urine associated with the carboxylic acid and the acyl glucuronide metabolites are listed in Table3.

Representative radiochromatogram of urine from a healthy male volunteer administered 300 mg of [14C]celecoxib.
Top, untreated urine. Bottom, urine treated with β-glucuronidase.
Cumulative percentage of the dose excreted as M-1 (acyl glucuronide) and M-2 carboxylic acid metabolite in urine collected 0 to 12 h after dosing
Representative radiochromatograms of fecal sample extracts are shown in Fig. 7. The majority of the radioactivity in radiochromatograms of fecal extracts coeluted with the carboxylic acid metabolite (M-2; 54.4 ± 6.8% of the dose), and minor amounts were associated with the retention time of celecoxib (2.56 ± 1.09% of the dose). The percentages of the dose excreted in feces as celecoxib and M-2 are listed in Table4.

Representative radiochromatograms of extracts of feces collected from a healthy male volunteer 0 to 24 h (top) and 6 days after the administration of a single oral dose of 300 mg of [14C]celecoxib.
Cumulative percentage of the dose excreted as celecoxib and M-2 (carboxylic acid metabolite) in feces collected 0 to 10 days after dosing
Identification of Urine Metabolites.
Radiochromatograms of urine samples revealed two metabolite peaks, which were designated M-1 and M-2 (Fig. 6, top). The retention time for M-2 was the same as the retention time of an authentic standard of the carboxylic acid metabolite. After incubation of urine samples with β-glucuronidase, the M-1 peak disappeared from the radiochromatogram, leaving only the peak in the position of M-2 (carboxylic acid) as shown in Fig. 6 (bottom). These results suggest that M-1 is a glucuronide or sulfate conjugate of acid metabolite.
The negative ion ESI mass spectra of metabolite M-2 and the synthetic carboxy-celecoxib show an intense ion atm/z 470, the acetic acid adduct of the deprotonated molecule (M − H + HOAc)−. The MS/MS spectra of this ion from each of the compounds, shown in Table5, are nearly identical. The MS/MS spectra of the MNH4+ ions,m/z 429, from the positive ion APCI spectra of M-2 and the synthetic standard, shown in Table6, are also identical. These results support the assignment of M-2 as carboxy-celecoxib.
MSMS spectrum of the (M − H + HOAc)− ion (m/z 470) from the negative ion ESI spectrum of metabolite M-2 or carboxy-celecoxib
MSMS spectrum of the MNH4+ ion (m/z 429) from the positive ion APCI spectrum of metabolite M-2 or carboxy-celecoxib
The (M − H)− ion at m/z 586 in the negative ion ESI spectrum establishes the molecular weight of metabolite M-1 as 587 Da, which is consistent with the glucuronide of the carboxylic acid metabolite. The base peak in the MS/MS spectrum (Table 7) of them/z 586 (40%) ion at m/z410 is due to the loss of unsaturated glucuronic acid, C6H8O6. The two remaining peaks at m/z 366 (90%) andm/z 302 (8%) are due to losses of CO2 and CO2 plus SO2, in addition to the loss of the glucuronic acid. These are the same peaks present in the MS/MS spectrum ofm/z 410, the (M − H)− ion of metabolite M-2 carboxy-celecoxib. The positive ion ESI and MS/MS spectra (Table 8) of metabolite M-1 also support the glucuronide structure. The MNH4+ ion atm/z 605 loses ammonia to give them/z 588 (30%) ion. The loss of ammonia and unsaturated glucuronic acid gives the m/z 412 ion.
MSMS spectrum of the (M − H)− ion (m/z 586) from the negative ion ESI spectrum of metabolite M-1
MSMS spectrum of the MNH4+ ion (m/z 605) from the positive ion ESI spectrum of metabolite M1
The position of the glucuronide on M-2 was elucidated by NMR. The proton signals of the standard of M-2 were assigned on the basis of the nuclear Overhauser cross-peaks observed in the transverse rotating-frame Overhauser effect spectroscopy (ROESY) spectrum (Fig.8). This experiment correlates protons that are reasonably close to each other in space. The transverse ROESY spectrum shows small cross-peaks between C-4H and the protons on C-21 and C-25. Large cross-peaks are seen between the C-21 and C-25 protons to the protons on C-22 and C-24. The expected large cross-peaks are also seen between the C-7 and C-11 protons to the C-8 and C-10 protons. These data clearly establish the assignments of these proton signals.

The low-field region, 6.797 to 8.256 ppm, of the two-dimensional transverse ROESY spectrum of the standard, carboxylic acid metabolite.
The proton NMR spectrum of M-1, compared with the proton NMR spectrum of the standard, carboxylic acid metabolite, shows that the formation of the glucuronide causes a significant down-field shift (0.1 ppm) of the C-22H and C-24H signals and a smaller down-field shift (0.04 ppm) of the C-21H and C-25H signals (Table9). Formation of the glucuronide causes no significant shifts of the signals assigned to C-8H and C-10H or the shifts of the signals assigned to C-7H and C-11H. On the basis of these data, the location of the glucuronide moiety of M-1 is on the carboxyl group.
Comparison of the proton chemical shifts in the standard carboxylic acid metabolite M-2 and metabolite M-1
Discussion
After the oral administration of a 300-mg dose of [14C]celecoxib to healthy male subjects, total recovery of the radioactive dose was about 84.4%, with 27.1% excreted in the urine and 57.5% excreted in the feces. The primary route of elimination of celecoxib is metabolism with less than 3% of the dose excreted as unchanged drug in the feces. The major metabolic pathway for celecoxib is oxidation of the benzyl methyl group to the primary alcohol (M-3). The hydroxyl metabolite undergoes further oxidation to the carboxylic acid (M-2). The carboxylic acid (M-2) is the major metabolite excreted in urine and feces, representing 18.8 and 54.4% of the dose, respectively. The hydroxyl metabolite is not found in either urine or feces. The carboxylic acid is conjugated to glucuronide to form the 1-O-glucuronide (M-1). The acid glucuronide is a minor metabolite excreted in urine, representing less than 2% of the dose. If it is assumed that the carboxylic acid is formed systemically and its presence in the feces is mostly due to its (or its labile conjugate) excretion via bile, then it can be estimated that at least 73% of the orally administered celecoxib reaches the systemic circulation. Some acid glucuronides have been shown to undergo acyl migration to form positional isomers (Spahn-Langguth and Benet, 1992). No such positional isomers of the acyl glucuronide metabolite of celecoxib were produced by the human volunteers; only the 1-O-glucuronide of the carboxylic acid metabolite of celecoxib was identified.
The majority of the radioactivity in plasma was associated with unchanged celecoxib. At 0.5 h after dose administration, 84.4% of the plasma radioactivity was associated with unchanged drug, which suggests that celecoxib was absorbed unchanged and did not undergo extensive first-pass metabolism. By 3 h after dosing, circulating celecoxib accounted for about 55% of the circulating radioactivity. The major circulating metabolites at 3 h after dosing were the carboxylic acid (M-2) and the acyl-glucuronide (M-1). Only minor amounts (1–3%) of the hydroxyl metabolite (M-3) were observed in plasma. The radioactivity was eliminated from plasma with a terminal half-life of 17 h. Concentrations of radioactivity were below detection limits in most subjects by 72 h after dosing, indicating that celecoxib and its metabolites are rapidly eliminated.
Acknowledgments
Bioanalytical assays for celecoxib were performed by PPD Pharmaco (Richmond, VA). Radioactivity measurements were conducted by Covance Labs (Madison, WI). Radiolabeled compounds were synthesized by Charles Markos and Scott Harring (Radiochemistry Department, G. D. Searle & Co.).
Footnotes
-
Send reprint requests to: Susan K. Paulson, Ph.D., G. D. Searle, 4901 Searle Pkwy., Skokie, IL 60077. E-mail:Susan.K.Paulson{at}monsanto.com
- Abbreviations used are::
- COX
- cyclooxygenase
- LSC
- liquid scintillation counting
- MS
- mass spectrometry
- SPE
- solid phase extraction
- ESI
- electrospray ionization
- APCI
- atmospheric pressure ionization
- AUC0–∞
- area under the plasma concentration-time curve from 0 to infinity
- AUC0–48h
- area under the plasma concentration-time curve from 0 to 48 h
- Received August 27, 1999.
- Accepted November 9, 1999.
- The American Society for Pharmacology and Experimental Therapeutics


