


Abstract
Brain interstitial fluid (ISF) concentrations, which regulate the toxicodynamic effect of quinolone antimicrobial agents (quinolones) in the central nervous system, have been determined for norfloxacin, ofloxacin, fleroxacin, and pefloxacin using a quantitative brain microdialysis technique. Steady-state brain ISF concentrations of the quinolones were 7–30 times lower than the unbound serum concentrations due to restricted distribution in the brain. Cerebrospinal fluid concentrations of the quinolones were approximately twice as high as the brain ISF concentrations, except for norfloxacin. Thus, it seems that an active efflux transport system across the blood-brain barrier is responsible for maintaining brain ISF concentrations lower than unbound serum concentrations at steady-state. A good correlation was observed for norfloxacin, ofloxacin, fleroxacin, and pefloxacin between brain ISF concentrations and total brain concentrations. Moreover, a relatively small difference was observed among the quinolones for thein vitro brain slice-to-medium concentration ratio, compared with an 11-fold difference in the in vivobrain-to-unbound serum concentration ratio after intravenous infusion. These results indicate that the different quinolones studied all exhibit similar apparent binding and/or uptake by brain parenchyma, with an average brain ISF-to-total brain concentration ratio of 0.688.
Epileptogenic neurotoxicity is a well known CNS3side effect of quinolone antimicrobial agents (quinolones) seen during chemotherapy (1). Nevertheless, quinolones with a wide and powerful spectrum of antimicrobial activity against Gram-negative and Gram-positive bacteria are used to treat a variety of infectious diseases (2). To develop new quinolones with low CNS side effects, it is important to devise a strategy based on toxicodynamic and toxicokinetic principles. As the GABA receptor binding of quinolones is believed to play an important role in these CNS side effects (3), minimizing the in vitro GABA receptor binding is one promising strategy (4). Moreover, it is also important to minimize thein vivo brain ISF concentration of quinolones after administration, because the brain ISF concentration directly affects GABA receptor binding in vivo.
Because the in vivo total brain concentrations of quinolones have been reported to be significantly lower than unbound plasma concentrations (5-7), the brain distribution of quinolones seems to be restricted. Although it has been suggested that quinolones are removed from CSF to the circulating blood via an unknown transport system (8, 9), one possible explanation is that this active efflux system on the blood-CSF barrier plays an important role in limiting the brain distribution of quinolones. However, because the surface area of the BBB is known to be 5,000 times greater than that of the blood-CSF barrier (10), we could not exclude the possibility that an efflux transport system on the BBB may be responsible for reducing the brain ISF concentration of quinolones in the brain with the result that the apparent brain concentration is lower than that of the unbound serum concentration.
The purpose of present study is to clarify the restricted cerebral distribution mechanism of quinolone antibiotics. Quantitative brain microdialysis (11, 12) and brain slice uptake studies have been performed to determine the in vivo and in vitrodistribution of quinolones, respectively.
Materials and Methods
All of the quinolones (NFLX, FLRX, OFLX, SPFX, PFLX, and AM-1155) were synthesized at the Central Research Laboratories of Kyorin Pharmaceutical Co., Ltd. (Tochigi, Japan). Xylazine hydrochloride and ketamine hydrochloride (Ketaral 50) were purchased from Sigma Chemical Co. (St. Louis, MO) and Sankyo Co., Ltd. (Tokyo, Japan), respectively. [carboxyl-14C]Inulin was purchased from Du Pont-New England Nuclear (Boston, MA). All other chemicals were commercial products and of analytical grade. Male Wistar rats weighing 270–300 g were used throughout the experiments. The animals all had free access to food and water.
Microdialysis Cannula.
The transcranial-type microdialysis cannula was prepared as described previously (11, 13) using Cuprophan hollow-fiber (Kawasumi Laboratories, Inc., Tokyo, Japan) and stainless-steel tubing (outer diameter: 0.2 mm; MT Giken, Tokyo, Japan). The molecular weight cut-off of this dialysis fiber is 30,000, and its inner diameter is 200 μm. The length of dialysis fiber implanted was 8 mm. To perfuse RHB [NaCl, 141 mM; KCl, 4 mM; CaCl2, 10 mM; and 4-(2-hydroxyethyl)-n-piperazine ethanesulfonic acid, 10 mM; pH 7.4] through the microdialysis cannula at a constant flow rate, a 5.0 ml Luer-Lock tip syringe (model 1005TLL; Hamilton Co., Reno, NV) and a syringe infusion pump (model 22; Harvard Apparatus, Dover, MA) were used.
In Vivo Microdialysis Study.
Brain microdialysis was conducted using a method reported previously (11). All the experiments were performed under anesthesia with ketamine (235 mg/kg im) and xylazine (2.3 mg/kg im). Cannulation with polyethylene tubing (PE-50, Becton Dickinson & Co., Parsippany, NJ) was performed on a femoral artery and vein to allow blood to be sampled and drugs to be administered. The rat was placed in a stereotaxic frame (KN-398, Natsume Seisakusyo Ltd., Tokyo, Japan), and 1.0 mm holes were made on both sides of the skull 3.4 mm posterior to the bregma and 3.5 mm below the dura using a dental drill. The microdialysis cannula was passed through the holes perfusing RHB into the microdialysis cannula at a constant flow rate of 10 μl/min.
Thirty minutes after probe implantation, the loading and maintenance doses of antipyrine and each quinolone were administered through the indwelling cannula in the femoral vein. The loading doses and following maintenance doses were 75 mg/kg and 8.4 mg/kg/hr for antipyrine, 15.6 mg/kg and 5.40 mg/kg/hr for NFLX, 5.73 mg/kg and 2.75 mg/kg/hr for OFLX, 3.91 mg/kg and 1.05 mg/kg/hr for FLRX, and 12.9 mg/kg and 2.71 mg/kg/hr for PFLX, respectively. The dosage of quinolones was the same as in our previous report (14), in which the steady-state concentration of quinolones in whole brain and CSF was determined without implanting a dialysis probe. The plasma quinolone concentration at steady-state would be expected to be 2–10 μg/ml, which should allow us to obtain a detectable CNS concentration. Immediately after implantation, the dialysate was collected at 10-min intervals. Blood samples were collected from the femoral artery at 0.5, 1, 2, 3, and 4 hr after intravenous injection. At the end of the brain microdialysis (i.e. 4 hr), 50-μl aliquots of crystal-clear CSF were obtained by cisternal puncture using the sharp point of a 24-gauge needle (15). Then, rats were immediately decapitated and the cerebral cortex removed for analysis.
Serum Unbound Fraction.
The in vivo serum unbound fractions of the quinolones were determined by the centrifugal ultrafiltration method. Portions (1 ml) of serum collected from animals at 4 hr were loaded onto a membrane (MPS-1; Amicon, Inc., Beverly, MA) and centrifuged at 2,500 rpm for 10 min at 37°C. The concentration of quinolones in serum and filtrate were determined by HPLC as described herein.
In Vitro Microdialysis.
In vitro microdialysis studies were conducted in RHB containing 100 μg/ml of antipyrine and 10 μg/ml of each quinolone. The dialysis fiber was put into 50 ml of reservoir solution at 37°C. Dialysis was performed with RHB at 10 μl/min, and the dialysate was collected every 10 min.
Extrapolation of Brain ISF Concentration.
The concentration in the ISF was determined from that in the dialysate as reported previously (11) and described herein. The in vitro permeability clearance (PAin vitro) of a drug and reference compound was determined from the following equation:
Brain Slice Uptake Study.
Brain slices were prepared as reported previously with some modification (16). Rats were killed by decapitation; the brain was removed, dissected in ice-cold buffer at pH 7.3, and placed on ice. The buffer used throughout the brain slice experiment contained: NaCl, 122 mM; NaHCO3, 25 mM; glucose, 10 mM; KCl, 3 mM; CaCl2, 1.4 mM; MgSO4, 1.2 mM; K2HPO4, 0.4 mM; and 4-(2-hydroxyethyl)-n-piperazine ethanesulfonic acid, 10 mM. The experiment was conducted in an atmosphere of prehumidified 95% O2:5% CO2 gas.
A hypothalamic slice, 300 μm thick, was cut using a microslicer (DTK-2000; Dosaka EM Co., Ltd., Kyoto, Japan) and was kept in the ice-cold buffer until required. Slices were transferred by wide-bore pipette to the preincubation buffer (50 ml) maintained at 37°C. After preincubation for 5 min, the brain slice (∼150 mg) was transferred to 50 ml of the same medium containing quinolone (0.5 μg/ml) or [14C]inulin (1 kBq/ml) at 37°C. Initial uptake of [14C]inulin was measured at 5, 10, and 30 min, whereas the uptake of FLRX into the brain slice was determined at 30 min and at 1, 2, 3, and 4 hr. Steady-state distribution of quinolones for the slice was compared at 4 hr. Incubations were terminated by removing the slice from the incubation medium. The brain slice and a portion of the incubation medium were stored at −20°C for the determination of drug concentrations.
Determination of Drug Concentration.
Brain tissues or slices were homogenized with 0.067 M phosphate buffer (pH 7.0). The homogenate was centrifuged at 3,000 rpm for 10 min to separate the supernatant.
In the in vitro brain slice uptake study, the concentrations of quinolones were determined by HPLC as described previously (17), with some modification. For the analysis of NFLX, FLRX, OFLX, SPFX, and PFLX, a portion of the supernatant or incubation medium (0.2–0.5 ml) was mixed with 0.5 ml internal standard solution and extracted with chloroform (1 × 5 ml for FLRX, OFLX, SPFX, and PFLX; 2 × 5 ml for NFLX). The internal standard solution was prepared by dissolving pipemidic acid in 0.5 M phosphate buffer (2 μg/ml for NFLX; 20 μg/ml for FLRX; 40 μg/ml for OFLX; and 4 μg/ml for SPFX and PFLX). The organic phases were evaporated to dryness and the resulting residues dissolved in 0.1 ml acetonitrile/0.04 M phosphoric acid (30:70, v/v). A portion of each solution (5–20 μl) was injected into the HPLC system (model 655A-11; Hitachi Ltd., Tokyo, Japan) equipped with a TSK gel ODS-120T column (particle size, 5 μm; 4.6 × 250 mm; Tosoh Co., Tokyo, Japan). The eluting mobile phase and flow rate were as follows: NFLX; acetonitrile/10 mM KH2PO4 (20:80, v/v, containing 0.005% 1-octane sulfonate sodium; pH 3.0), 1.0 ml/min; FLRX, OFLX, and PFLX; methanol/5 mM tetra-n-butylammonium hydrogen sulfate (28:72, v/v), 0.8 ml/min; SPFX; and acetonitrile/10 mM KH2PO4(3:10, v/v, containing 0.012% 1-octane sulfonate sodium; pH 3.0), 1.2 ml/min. To quantify the concentration of AM-1155, samples were diluted with an equal volume of methanol to precipitate proteins and then centrifuged at 3,000 rpm for 10 min. The supernatants (5–10 μl) were applied to the HPLC column, TSK gel ODS-80Tm (particle size, 5 μm; 4.6 × 150 mm; Tosoh Co.).
In the microdialysis study, HPLC was also used to quantify the quinolones and antipyrine. Brain homogenate and serum samples were deproteinized with methanol (1:3, v/v) and centrifuged at 3,000 rpm for 10 min. An aliquot of supernatant or dialysate (5–50 μl) was injected directly onto the HPLC column, TSK gel ODS-80Tm. The mobile phases were acetonitrile/78 mM phosphate buffer (25:75, v/v; pH 7.2) for antipyrine and acetonitrile/20 mM phosphoric acid (20:80, v/v) for the quinolones, and the flow rate was 1.0 ml/min.
A fluorescence detector was used for NFLX, AM-1155, FLRX, and OFLX. The excitation and emission wavelengths were 290 and 460 nm for NFLX, 295 and 485 nm for AM-1155, 290 and 450 nm for FLRX, and 290 and 500 nm for OFLX, respectively. To detect SPFX and PFLX, UV absorption was used. The analytical wavelengths were 298 nm for SPFX and 280 nm for PFLX. Antipyrine was monitored using its UV absorption at 254 nm.
Calibration standards were prepared by adding authentic standards of each compound (quinolones: 0.0001–0.25 μg/ml for the microdialysis study and 0.01–0.5 μg/ml for the brain slice study; antipyrine: 0.1–100 μg/ml for the microdialysis study) to blank materials (i.e. serum and tissue homogenates). To analyze dialysate, we added quinolone and antipyrine to RHB and used these for calibration. The concentration of quinolones and antipyrine was calculated from the calibration curve by linear regression of the peak intensity (peak height ratios to internal standard or peak heights) as a function of the spiked concentrations. The detection limit of quinolones in this procedure was 0.01 μg/ml in serum, 0.05 μg/g in tissues, and 0.0001 μg/ml for dialysate. The coefficient of variation for the quinolones assays in serum was <4.8%.
Total [14C]inulin-related radioactivity was determined in a liquid scintillation spectrophotometer (model LS6000SE; Beckman Instruments, Inc., Berkeley, CA).
In Vivo Brain Concentration.
Because the observed brain concentration in the in vivomicrodialysis study included drug in the vascular space of the brain capillary, the quinolone concentration in the brain parenchyma was used after subtracting the drug in the vascular space. The blood vascular volume was found to be 0.020 ml/g from the reported plasma vascular volume (0.011 ml/g) (18) using a hematocrit of 0.45.
Results
Figure 1 illustrates the time course of the serum and brain dialysate concentrations of NFLX, OFLX, FLRX, and PFLX during the combination of brain microdialysis and constant intravenous infusion via the femoral vein in rats. The dialysate concentration reached a steady-state at 2 hr after the start of infusion (fig. 1). The steady-state concentrations of serum and brain dialysate are given in table 1. The total brain concentrations (CBrain) and CSF concentrations (CCSF) of the quinolones were determined at the end of brain microdialysis (i.e. 4 hr after infusion). TheCBrain and CCSF values determined are also given in table 1.

Time courses of NFLX (A), OFLX (B), FLRX (C), and PFLX (D) in the serum (closed circles) and brain dialysate (open circles) after bolus administration and infusion of quinolones via the femoral vein in combination with brain microdialysis.
Each point represents the mean ± SE of three experiments, respectively.
Steady-state concentration of quinolones in the serum, brain, brain ISF, and CSF of rats
The steady-state unbound serum concentrations (Cp,u) and serum unbound fraction (fu) of the quinolones were determined by the ultrafiltration method and are given in table 1. TheCBrain-to-Cp,u ratio (Kp,uBrain) andCCSF-to-Cp,u ratio (Kp,uCSF) were also estimated and given in table1. An ∼11-fold difference in Kp,uBrain was observed between NFLX and FLRX (table 1).
To estimate the in vivo brain ISF concentration (CISF) from the dialysate concentration (Cdial), antipyrine was used as a reference marker. The in vitro dialysate-to-reservoir concentration ratio (Cdial/Cr ) (i.e. the relative recovery) of antipyrine was 0.110 ± 0.003 (mean ± SE, N = 12). In the in vivo brain microdialysis experiment, the steady-state unbound serum concentration and the dialysate concentration of antipyrine were found to be 66.3 ± 3.3 μg/ml and 2.57 ± 0.13 μg/ml (mean ± SE, N = 12), respectively. Based on eqs.1 and 2, PAin vivo and PAin vitro of antipyrine was determined to be 1.18 ± 0.03 and 0.410 ± 0.012 μl/min (mean ± SE, N = 12), respectively. Thus, the effective dialysis coefficient (Rd) of antipyrine was found to be 0.349 ± 0.014 (mean ± SE,N = 12), which was very similar to the reported value (11). In the study of quinolone analogs, the values of in vitro Cdial/Cr were found to be 0.0476 ± 0.0050, 0.0520 ± 0.0009, 0.0548 ± 0.0064, and 0.0500 ± 0.0019 (mean ± SE,N = 3) for NFLX, OFLX, FLRX, and PFLX, respectively. Thus, PAin vitro of NFLX, OFLX, FLRX, and PFLX was found to be 0.496 ± 0.057 μl/min, 0.543 ± 0.009 μl/min, 0.573 ± 0.068 μl/min, and 0.522 ± 0.022 μl/min (mean ± SE, N = 3), respectively. Accordingly, the CISF values of quinolones were obtained using eq. 4. The CISF values of the quinolones, the ratios of CISF andCp,u, and the ratios of CBrain andCISF are also given in table 1. For all of the quinolones examined, the CISF values were significantly lower than Cp,u (p < 0.05, Student’s paired t test). Moreover, theCCSF values were approximately twice those of the corresponding CISF values (table 1) for OFLX, FLRX, and PFLX. As illustrated in fig. 2, theCISF values correlated closely with theCBrain values for the quinolones studied. The slope of CISFvs. CBrain (fig. 2) was found to be 0.459 ± 0.092 (95% confidence interval). The ratio ofCISF and CBrain are also listed in table 1. The average ofCISF/CBrain for the quinolone analogs examined was found to be 0.688 (table 1).

Relationship between the brain ISF concentration (CISF) and brain total concentration (CBrain) of quinolones.
Brain ISFs were determined by brain microdialysis during the constant infusion of quinolones into the femoral vein. Linerepresents the result of a least squares regression analysis. The slope was 0.459 ± 0.092 (95% confidence interval). •, NFLX; ○, OFLX; ▴, FLRX; ◊, PFLX.
In the brain slice uptake study, the apparent brain slice concentration-to-medium concentration ratio (Cs/Cm) of [14C]inulin was found to be 0.141 ± 0.004, 0.177 ± 0.009, and 0.259 ± 0.008 at 5, 10, and 30 min, respectively. Extrapolation of the Cs/Cm value of zero-time incubation gave the adherent water space of the slice (0.124 ± 0.019 ml/g slice, N = 9; 95% confidence interval), and this was subtracted to correct the quinolone distribution. Figure3 illustrates the Cs/Cm of FLRX, determined by the in vitro brain slice uptake study. No significant differences in Cs/Cm were observed during those incubation times (fig. 3), indicating that a 4-hr incubation is enough for a steady-state quinolone level to be achieved in the brain slice at 37°C. For NFLX, OFLX, PFLX, AM-1155, and SPFX, steady-stateCs/Cm values were also determined, and these are given in table 2. Although Cs/Cm values of FLRX, PFLX, and OFLX were significantly smaller than that of NFLX (table 2), these differences were relatively smaller than the difference in the in vivo Kp,uBrain among quinolones (table 1). The mean Cs/Cm value for all of the quinolones studied was found to be 1.56 ± 0.06 ml/g (mean ± SE, N = 24).
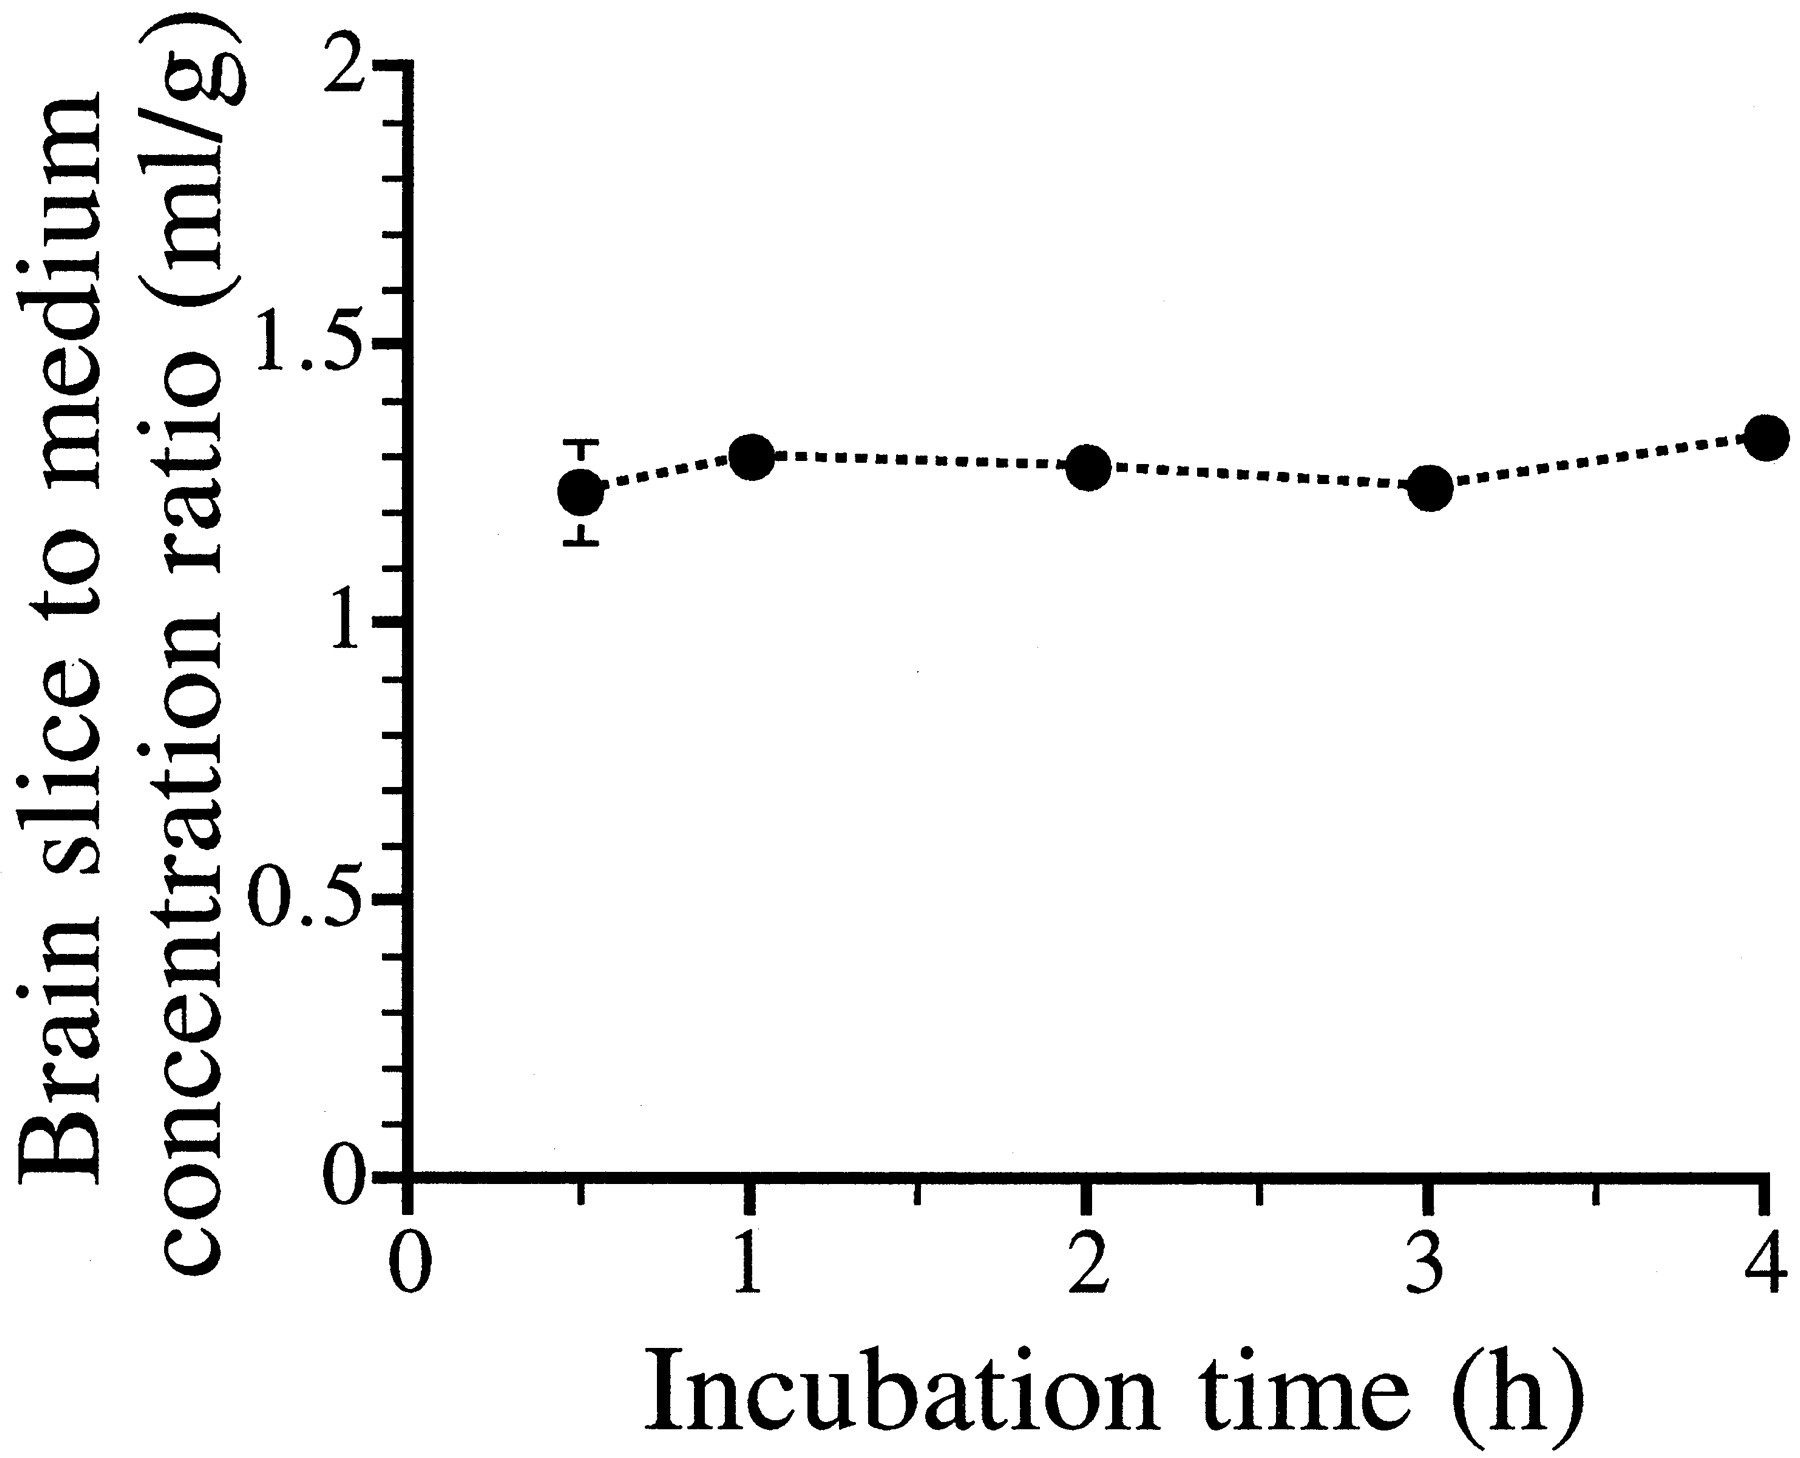
Time course of brain slice-to-medium concentration ratio of FLRX.
Brain slices were incubated at 37°C in the incubation medium containing 0.5 μg/ml of FLRX. Each symbol indicates the mean ± SE of four experiments.
Comparison of brain slice to medium concentration ratio among quinolones
Discussion
Steady-state concentrations of quinolones in brain ISF were 7–30 times lower than the unbound serum concentrations (table 1). In the same manner, the CSF concentrations of quinolones were 2–30 times lower than the unbound serum concentrations (table 1), which is consistent with previous reports for different quinolone analogs (6,8). To explain these results, one has to assume that an active efflux transport system for quinolones at the BBB (i.e. brain capillary endothelial cells) is responsible for the restricted distribution in the brain (table 1), although at least two other possible mechanisms can be postulated: i) the bulk flow rate of CSF along with an active efflux system on the blood-CSF barrier is efficient enough to reduce the brain ISF concentration of quinolones and ii) quinolones are significantly metabolized in the brain parenchyma. Because the CSF concentration of quinolones is greater than the brain ISF concentration for OFLX, FLRX, and PFLX (table 1), the first possibility can be excluded for these analogs. Essentially, no metabolites were detected in the brain and brain dialysate by HPLC analysis (data not shown), although some slight enzyme activity in brain tissue has been reported, catalyzingN-desmethylation (19). Thus, the second possibility can also be excluded.
It has been reported that quinolones are substrates for the renal organic anion and cation transport system (20, 21) and for the nicotinic acid transport system on the erythrocyte membrane (22), and that several transport systems are responsible for the excretion of compounds across the BBB [P-gp for lipophilic organic cations (23-26), and a transport system for organic anions such as β-lactam antibiotics (15), azidothymidine (27, 28), and valproic acid (29)] as reviewed previously (30). Characterization of the transporter for quinolones on the BBB still remains unclear. Although Jaehde et al. (31) reported that quinolones are transported across the cultured brain endothelial cells via passive diffusion, these data might be accounted for by the downregulation of transporters in the cultured cells (32, 33).
Regarding the microdialysis technique, many studies of the methodology, particularly mathematical treatments of microdialysis perfusate drug concentration data, have been published (34, 35). Although the in vitro recovery of microdialysis probes can be easily estimated, it is well known that in vitro recovery is not a reliable estimate of the in vivo situation. Thus, several approaches have been proposed for estimating relative recovery in vivo. These include: i) the “extrapolation to zero flow-rate” method (36); ii) the “point of no net flux” method (37,38); iii) conducting dialysis at a very slow perfusion rate, yielding almost 100% recovery (35); and iv) adding internal standard to perfusate and measuring the relative loss that is related to the recovery of the compounds being investigated (39). In the present study, we administered antipyrine systemically as a reference marker to correct for in vivo dialysis clearance (PAin vivo) that allows the determination of relative recovery. This method has been successfully applied to tritiated water, caffeine, and aminopyrine (11). Theoretical considerations by Bungay et al. (40) suggest that the recovery of compound in the brain ISF to dialysate is influenced by metabolism in ISF, uptake by the brain parenchma, and transport across the BBB. This, in turn, suggests that the Rd for antipyrine does not necessarily hold for quinolone antibiotics. To determine the ISF concentration of quinolones more accurately, further detailed kinetic analysis based on a more elaborate mathematical model is required. However, the conclusion that quinolone antibiotics are actively transported across the BBB from brain ISF to blood is not refuted by these theoretical considerations, because the steady-state total brain concentration of quinolones is smaller than the unbound serum concentration (table 1), and quinolones have a large distribution space (Cs/Cm) in the in vitro slice experiments (table 2).
To reduce the incidence of CNS side effects, our findings suggest that a structural modification (increasing the affinity for the putative efflux transport system on the BBB) would be a new and potentially useful strategy for reducing the CNS side effects of quinolones, thus reducing the brain ISF concentration after administration. Comparing the value of CISF/Cp,u among the quinolone analogs (table 1), a 4-fold difference was observed between NFLX and PFLX. It is interesting that the structural difference between NFLX and PFLX is only a single methyl moiety, resulting in a significantly lower concentration ratio of brain ISF and unbound serum concentration in the circulating blood. Because the surface area of the brain capillary endothelial cells (i.e. the BBB) is 5,000-fold greater than that of the blood-CSF barrier (10), the BBB may play a dominant role in the restricted distribution of quinolones in the brain. However, further studies are necessary using the distributed model (30, 41, 42) to evaluate the contribution of BBB efflux transport to the restricted distribution of quinolones in the brain. Because renal excretion is reported to be a major elimination pathway for quinolones (2), it will be important to compare the structure–transport relationship between renal excretion (20, 21) and putative efflux at the BBB. If there are any differences in the nature of transport between the kidney and BBB, it should be possible to design a quinolone having a higher efflux rate across the BBB, but a lower excretion rate from the kidney.
In conclusion, the present study demonstrates that brain ISF concentrations of quinolones are significantly lower than the unbound serum concentrations. An active efflux transport system across the BBB may play an important role in the restricted distribution of quinolones in the brain. Furthermore, the apparent brain ISF concentration and total brain concentration ratios are similar for the quinolone analogs investigated (i.e. 0.688). Use of this average value will allow prediction of the brain ISF concentration, which is associated with the CNS side effects of quinolones, if the apparent quinolone concentration in the brain after administration is known.
Acknowledgments
We greatly appreciate Drs. H. Saito and H. Katsuki (Faculty of Pharmaceutical Sciences, The University of Tokyo) for valuable discussions about the brain slice uptake study.
Footnotes
-
Send reprint requests to: Dr. Yuichi Sugiyama, Department of Pharmaceutics, Faculty of Pharmaceutical Sciences, The University of Tokyo, Hongo, Bunkyo-ku, Tokyo 113, Japan.
-
↵1 Present address: Central Research Laboratories, Kyorin Pharmaceutical Co., Ltd., Nogi-machi, Shimotsuga-gun, Tochigi 329-01, Japan.
-
↵2 Present address: Department of Pharmaceutics, Faculty of Pharmaceutical Sciences, Tohoku University, Aoba-ku, Sendai 980-77, Japan.
-
This research was supported in part by a Grant-in-Aid for Scientific Research from the Ministry of Education, Science, and Culture, Japan and the Research Fund from the Human Science Foundation.
- Abbreviations used are::
- CNS
- central nervous system
- GABA
- γ-aminobutyric acid
- ISF
- interstitial fluid
- CSF
- cerebrospinal fluid
- BBB
- blood-brain barrier
- NFLX
- norfloxacin
- FLRX
- fleroxacin
- OFLX
- ofloxacin
- SPFX
- sparfloxacin
- PFLX
- pefloxacin
- AM-1155
- (±)-1-cyclopropyl-6-fluoro-1,4-dihydro-8-methoxy-7-(3-methyl-1-piperazinyl)-4-oxo-3-quinolinecarboxylic acid
- RHB
- Ringer’s HEPES buffer
- Received August 22, 1996.
- Accepted March 12, 1997.
- The American Society for Pharmacology and Experimental Therapeutics


