


Abstract
Raloxifene, a selective estrogen receptor modulator, exhibits quite large interindividual variability in pharmacokinetics and pharmacodynamics. In women, raloxifene is metabolized extensively by different isoforms of UDP-glucuronosyltransferase (UGT) to its glucuronides. To gain an insight into intestine, kidney, liver, and lung glucuronidation of raloxifene, human microsomes of all tested organs were used. Raloxifene-6-β-glucuronide (M1) formation followed the Michaelis-Menten kinetics in intestinal, kidney, and liver microsomes; meanwhile, raloxifene-4′-β-glucuronide (M2) formation followed the substrate inhibition kinetics. Human lung microsomes did not show any glucuronidation activity. The tissue intrinsic clearances for kidney, intestine, and liver were 3.4, 28.1, and 39.6 ml · min−1 · kg−1, respectively. The aim of our in vitro study was to explain the mechanism behind the observed influence of UGT1A1*28 polymorphism on raloxifene pharmacokinetics in a small-sized in vivo study (Br J Clin Pharmacol 67:437–444, 2009). Incubation of raloxifene with human liver microsomes genotyped for UGT1A1*28 showed a significantly reduced metabolic clearance toward M1 in microsomes from donors with *28 allele. On the contrary, no significant genotype influence was observed on the formation of M2 because of the high variability in estimated apparent kinetic parameters, although a clear trend toward lower glucuronidation activities was observed when UGT1A1*28 polymorphism was present. The liver intrinsic clearances of both homozygotes differed significantly, whereas the clearance of heterozygotes did not differ from the wild-type and the mutated homozygotes. In conclusion, our results show the high importance of the liver and intestine in raloxifene glucuronidation. Moreover, the significant influence of UGT1A1*28 polymorphism on metabolism of raloxifene was confirmed.
Introduction
Raloxifene is a selective estrogen receptor modulator that is marketed for the prevention and treatment of postmenopausal osteoporosis and for the prevention of breast cancer in postmenopausal women. Raloxifene binds to estrogen receptors and exhibits tissue-selective effects (Bryant et al., 1999). It undergoes extensive presystemic glucuronidation, and thus only 2% reaches the systemic circulation (Hochner-Celnikier, 1999). The products of in vivo glucuronidation are raloxifene-6-β-glucuronide (M1), raloxifene-4′-β-glucuronide (M2) [U.S. Food and Drug Administration (FDA), http://www.fda.gov/cder/foi/nda/99/20815S3_Evista.htm] (Jeong et al., 2005b), and raloxifene-6,4′-di-glucuronide (M3) (FDA, http://www.fda.gov/cder/foi/nda/99/20815S3_Evista.htm). The glucuronides show little affinity for the estrogen receptors and for bone tissue, but they should not be overlooked because they can be readily reconverted to active raloxifene in various organs, including the liver, lung, spleen, kidney, bone, and uterus (Dodge et al., 1997). For raloxifene, the quite large interindividual and intraindividual variability of its clearance and volume of distribution are known (FDA, http://www.fda.gov/cder/foi/nda/99/20815S3_Evista.htm). Our research group showed, in a small in vivo study, that the relatively common UGT1A1*28 polymorphism may considerably influence raloxifene pharmacokinetics and pharmacodynamics (Trontelj et al., 2007, 2009).
Human UGTs have been reported to be expressed in several tissues including liver, small intestine, kidney, lung, and others (Ohno and Nakajin 2009). Among UGTs, UGT1A1, UGT1A8, UGT1A9, and UGT1A10 showed the highest activity of raloxifene glucuronidation (Kemp et al., 2002). All of the listed isoforms are expressed in the intestine, but the liver is deficient from UGT1A8 and UGT1A10 (Ohno and Nakajin, 2009). Furthermore, the relative contribution of various organs to raloxifene presystemic and systemic metabolic clearance has not been clearly determined, although the main role is attributed to the intestinal wall and to the liver (FDA, http://www.fda.gov/cder/foi/nda/99/20815S3_Evista.htm) (Jeong et al., 2005b; Trontelj et al., 2009). None of the UGT isoforms responsible for raloxifene glucuronidation are expressed in lung, and only UGT1A9 is expressed in the kidney (Ohno and Nakajin, 2009). UGT1A1 is the isoform that is responsible for the metabolism of endogenous bilirubin to its glucuronides, and UGT1A1*28 is the most studied polymorphism, which leads to the elongated (TA)n repeat [A(TA)7TAA instead of A(TA)6TAA]. A(TA)7TAA (UGT1A1*28) reduces the UGT1A1 transcription by 70% (Bosma et al., 1995; Strassburg, 2008). Many studies have demonstrated considerable interindividual variation in glucuronidation activities for specific drugs because of the *28 polymorphism in the UGT1A1 gene (Iyer et al., 2002; Yoder Graber et al., 2007; Bae et al., 2011).
The objectives of the present study were to characterize the enzyme kinetics of raloxifene glucuronidation in human liver, kidney, intestinal, and lung microsomes and to confirm the role of UGT1A1*28 polymorphism on raloxifene glucuronidation in vitro using human liver microsomes genotyped for presence of UGT1A1*28 polymorphism.
Materials and Methods
Materials.
Raloxifene hydrochloride, haloperidol, and digitonin were purchased from Sigma Chemie (Deisenhofen, Germany). Human kidney and lung microsomes were from Celsis IVT (Neuss, Germany). Human liver microsomes, human intestinal microsomes, and human liver microsomes genotyped for UGT1A1 *1/*1, *1/*28, *28/*28 variants; solution A [uridine 5′-diphospho-glucuronic acid (UDPGA)]; and solution B (Tris-HCl, MgCl2, alamethicin) were from BD Biosciences (Woburn, MA). Human serum albumin (HSA) (200 g/l) was obtained from Octapharma (Ljubljana, Slovenia). Raloxifene metabolites M1, M2, and M3 were synthesized as authentic standards by incubating raloxifene hydrochloride with the bacterial cell line Streptomyces sp.-ATCC 55043 by a modification of the method that was published by Lilly Research Laboratories (Briggs et al., 1999), followed by purification. The details of this synthesis are described elsewhere (Trdan et al., 2011). Stock solutions of raloxifene, M1, M2, and M3 were prepared in dimethyl sulfoxide (DMSO).
Microsomal Incubations.
A typical incubation mixture contained 0.38 mg/ml human liver, kidney, intestine or lung microsomes, 7.6 mM MgCl2, 47.6 mM Tris-HCl, 24 μg/ml alamethicin, 1.7 mM UDPGA, 1% human serum albumin, and 1 to 260 μM raloxifene. First, microsomes were mixed with solution B (buffered alamethicin solution) and kept on ice for 15 min. Then, a stock solution of raloxifene in DMSO was added, and the mixture was preincubated at 37°C for 10 min. The final DMSO concentration in incubation was 1%. To initiate the reaction, 10 μl of 25 mM UDPGA solution was added resulting in a final volume of 150 μl. After the predetermined optimal stopping times, 4, 15, and 4 min for human liver microsomes (mixed and genotyped), human kidney microsomes, and human intestinal microsomes, respectively, the reactions were terminated by adding 450-μl aliquots of ice-cold methanol containing 0.5 mg/l haloperidol as an internal standard. The stopped incubation mixture was left to stand at −20°C for 48 h to fully precipitate the proteins and was then centrifuged at 1300g for 100 min at 4°C. The supernatant was subjected to LC-MS/MS for quantification of raloxifene, M1, M2, and M3 using haloperidol as an internal standard.
Digitonin (0.35 mg/mg microsomal protein) (Gordon et al., 1983) was tested as another pore-forming reagent instead of alamethicin in an attempt to produce incubation conditions where M3 would also be formed as it is formed in vivo (FDA, http://www.fda.gov/cder/foi/nda/99/20815S3_Evista.htm).
For the time-course experiment, the incubation mixture for each type of microsome containing the same amounts of reagents as typical incubation mixture and 20 μM raloxifene was monitored from 0 to 480 min. The incubations were terminated under initial velocity conditions. Each experiment was performed on three parallels.
LC-MS/MS Analysis.
For LC-MS/MS analysis, the Agilent 1290 Infinity HPLC system (Agilent Technologies, Santa Clara, CA) including a vacuum degasser, binary pump, autosampler, thermostat, and Triple Quad MS detector (Agilent Technologies) was applied to the analysis of microsomal samples. The autosampler temperature was kept at 4°C. The chromatographic separation was performed by using the Kinetex 50 × 2.1 mm, 2.6-μm column (Phenomenex, Torrance, CA) coupled with an In-Line filter KrudKatcher Ultra HPLC (0.5 μm; Phenomenex) and a guard column [C18(2), 4 × 2 mm; Phenomenex] at 50°C. The mobile phase consisted of 0.1% formic acid in water (mobile phase A) and 98% acetonitrile (mobile phase B). The separation required a gradient elution presented in Table 1. The run time was 2.7 min. The volume of injection was 0.1 μl, and after each injection, the sampling needle was washed with 0.1% formic acid in isopropanol/water (40:60 v/v).
Gradient elution for the optimal separation of raloxifene, its glucuronides, and haloperidol
The chromatographic system was coupled to the mass detector equipped with an Agilent Jet Stream electrospray ionizer source (Agilent Technologies) operated in positive ionization mode. The settings for quantification using multiple reaction monitoring are presented in Table 2. The retention times of raloxifene, M1, M2, M3, and haloperidol were 1.433, 1.073, 1.209, 0.909, and 1.463 min, respectively.
MRM mass transitions and collision energies used for quantification of raloxifene, its glucuronides, and haloperidol (IS)
Data Analysis.
Glucuronidation activities were determined on three replicates. Apparent kinetic parameters were determined using either the Michaelis-Menten kinetic model (eq. 1) or the substrate inhibition kinetic model (eq. 2):

 where v represents the reaction velocity, Vmax is the maximum velocity, S is the substrate concentration, Km is the Michaelis-Menten constant, and Ksi is a substrate inhibition constant. The kinetic parameters such as Km, Vmax, and/or Ksi for raloxifene glucuronidation were estimated by nonlinear regression of experimental data to eq. 1 or 2 using PASW 18.0 software (IBM, Chicago, IL). Goodness of fit to eq. 1 or 2 was assessed by visual inspections of Michaelis-Menten plots and by determination of the relative S.E.s.
Intrinsic clearance was calculated as Vmax/Km. The difference in glucuronidation levels among UGT1A1 genotypes were tested using the z test with Holm's correction. The significance criterion (α) was set at P < 0.05.
Total raloxifene microsomal intrinsic clearance (Clint) was calculated by summation of the partial intrinsic clearances toward M1 and M2, and the total tissue intrinsic clearance (Clint, o) was estimated by scaling the sum of intrinsic clearances for M1 and M2 to the organ (eq. 3).

For the scale-up, values 45, 3, and 45 mg/g tissue were used as the contents of the microsomal protein in the liver, intestine, and kidney, respectively. For the weights of liver, intestine, and kidney, 20, 30, and 4.4 g/kg body weight were used, respectively (Yamanaka et al., 2007).
Results
Glucuronidation of Raloxifene by Human Kidney, Intestinal, Lung, and Liver Microsomes.
Human kidney, intestinal, lung, and liver microsomes were tested for their ability to catalyze raloxifene glucuronidation. In the preliminary testing of the time course of glucuronidation at 20 μM raloxifene, a stop time of 15, 4, and 4 min was selected for kidney, intestinal, and liver microsomes, respectively. It was determined that except for the lung microsomes, which did not show any glucuronidation activity for raloxifene, all other types of the tested microsomes showed significant glucuronidation activity toward M1 and M2. Human lung microsomes did not show any glucuronidation activity of raloxifene because of the absent expression of UGT isoforms responsible for raloxifene metabolism (Ohno and Nakajin, 2009). It is noteworthy that no M3 was formed by any microsomal incubation although it was found in vivo (FDA, http://www.fda.gov/cder/foi/nda/99/20815S3_Evista.htm). Despite using digitonin instead of alamethicin to treat the microsomal membranes, M3 was not detected in incubations with any type of microsomes.
The kinetics of raloxifene glucuronidation to M1 in human liver, intestinal, and kidney microsomes were fitted to the Michaelis-Menten equation (eq. 1; Fig. 1A); meanwhile, the kinetics of raloxifene glucuronidation to M2 in all tested types of microsomes were fitted to the substrate inhibition equation (eq. 2; Fig. 1B). The fitting results are presented in Table 3. The in vitro intrinsic clearances (Vmax/Km) were calculated for the formation of M1 and M2 (Table 3) and after summation of M1 and M2 microsomal intrinsic clearances of 17.3, 312.2, and 44.0 μl · min−1 · mg−1 were determined for kidney, intestinal, and liver microsomes. In addition, by scaling up, the tissue intrinsic clearances (Clint,o) of kidney, intestine, and liver were calculated (Table 3; Fig. 2).
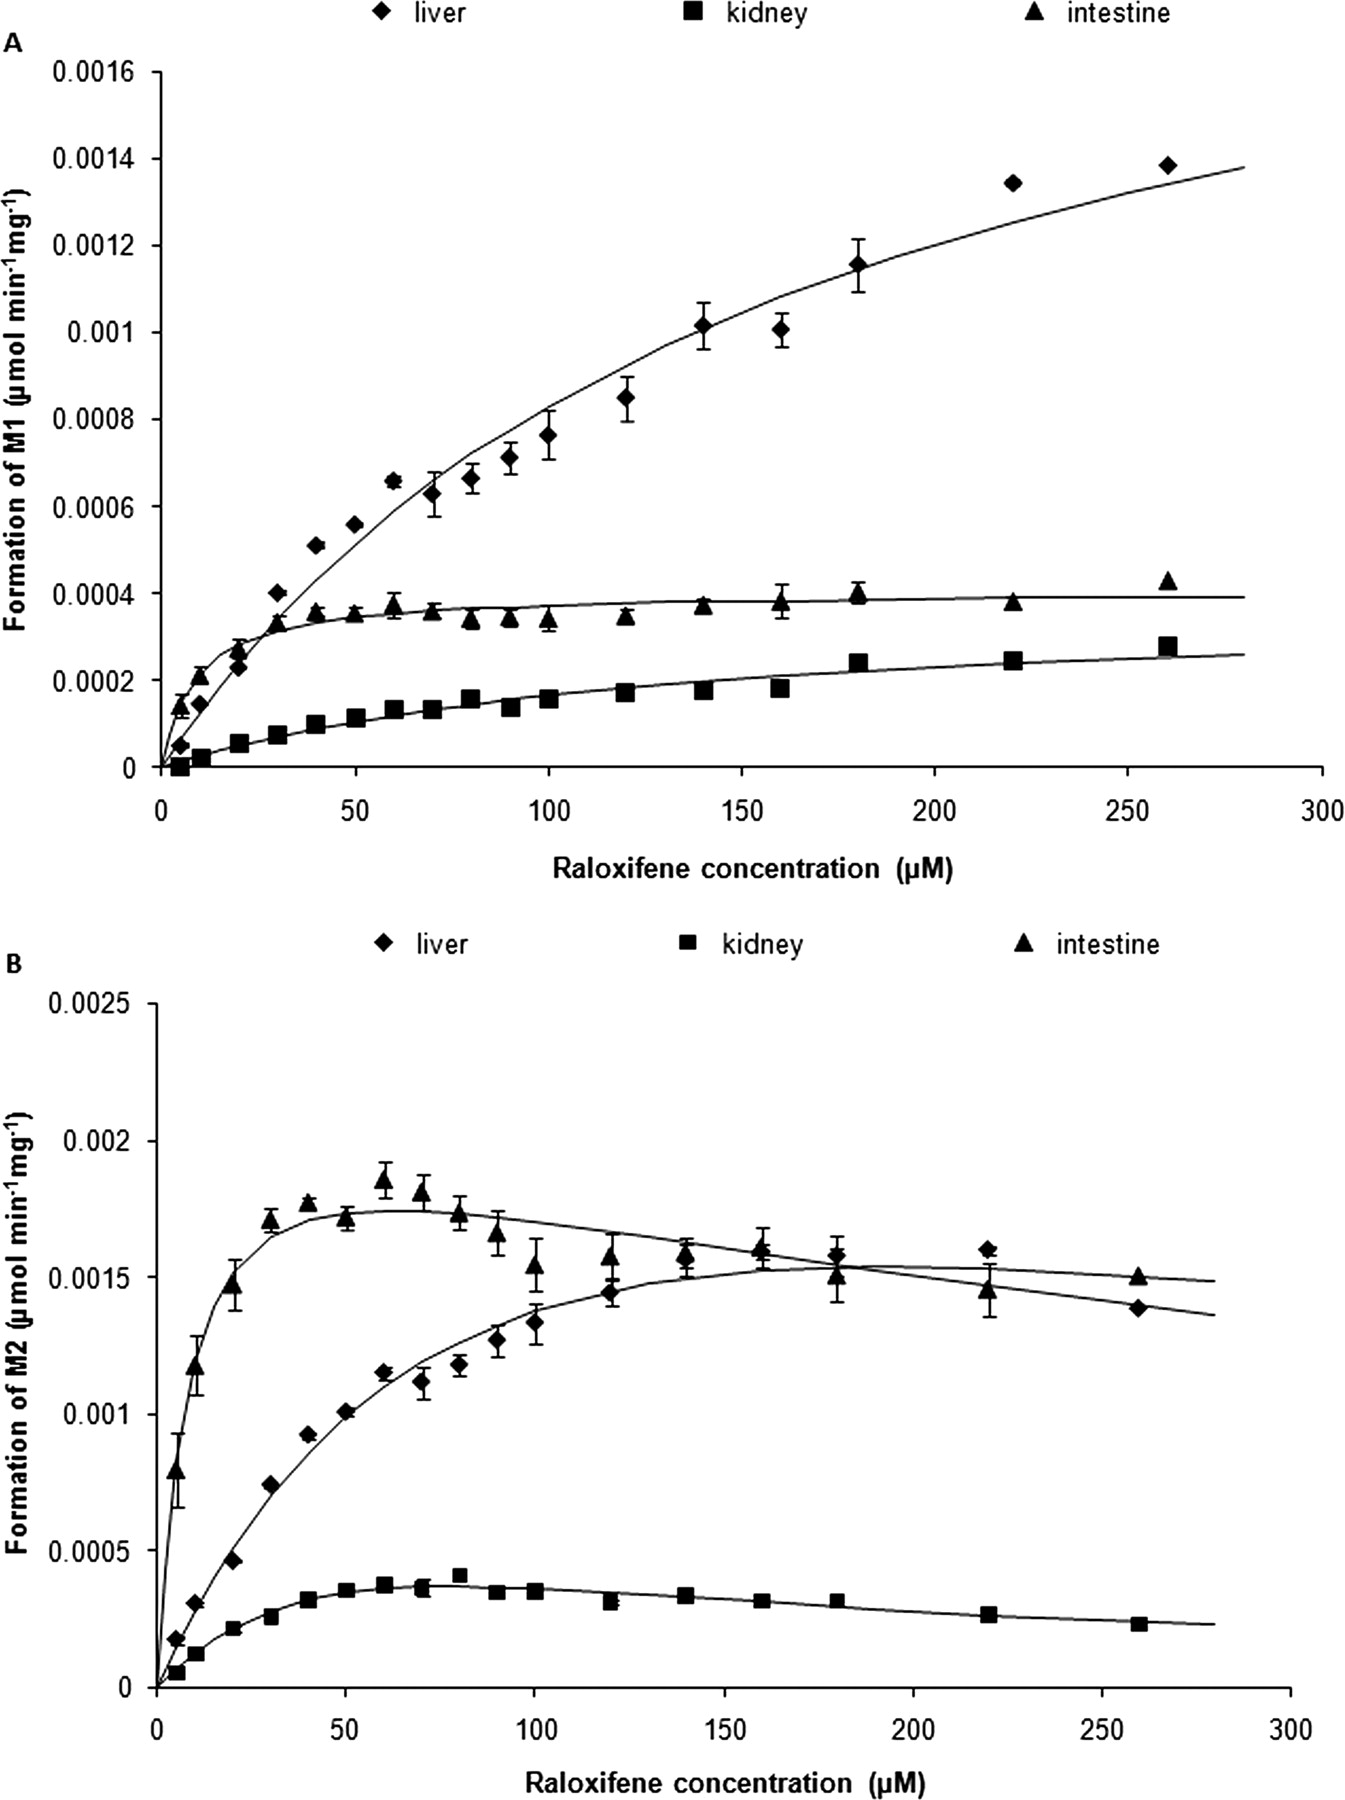
Kinetic analyses of raloxifene glucuronidation. The M1 formation rate (A; diamonds, squares, triangles) was fitted to the Michaelis-Menten equation (solid lines), whereas the M2 formation rate (B; diamonds, squares, triangles) was fitted to the substrate inhibition model (solid lines). Each data point represents the mean (S.E.) of triplicate determinations.
Apparent kinetic parameters of raloxifene glucuronidation to M1 and M2 in human kidney, intestinal, and liver microsomes and calculated microsomal intrinsic and tissue intrinsic clearances
Data are presented as mean (S.E.).

Tissue intrinsic clearances determined by human kidney, intestine, and liver microsomes.
Glucuronidation by UGT1A1*28 Polymorphic Human Liver Microsomes.
Raloxifene was incubated with each of the three types of human liver microsomes grouped by the presence of UGT1A1*28 genotype, namely *1/*1, *1/*28, and *28/*28. The same as with the pooled human liver microsomes, the formation of M1 and M2 followed the Michaelis-Menten and the substrate inhibition equations, respectively. Nonlinear regression curves for the formation of M1 and M2 are presented in Fig. 3, A and B, respectively. Determined apparent kinetic parameters are shown in Table 4. The Km values of all tested human liver microsomes ranged from 130 to 150 μM for M1 and from 159 to 181 μM for M2 and, as expected, did not differ significantly among the UGT1A1 variants (Tables 4 and 5). However, the difference was observed in Vmax values for M1, where microsomes from the wild-type homozygotes indicated the highest value, followed by the Vmax determined on microsomes from the heterozygotes and microsomes from the polymorphic homozygotes (Table 5). In the case of M2, the Vmax determined on microsomes of the wild-type homozygotes did not differ from the Vmax determined on microsomes from the heterozygotes; however, both were higher than Vmax of polymorphic homozygotes (Table 5). When calculating the intrinsic clearance for each metabolite, it was found that Clint to M1 differs significantly among all genotypes (Table 5). There was no significant difference observed in Clint to M2 according to the UGT1A1*28 polymorphism (Table 5) because of quite high variability of the estimated Vmax and Km and, consequently, high relative S.E. of the calculated Clint.

Kinetic analyses of raloxifene glucuronidation. Glucuronidation to M1 (A; diamonds, squares, triangles) was fitted to the Michaelis-Menten equation (solid lines), and glucuronidation to M2 (B; diamonds, squares, triangles) was fitted to the substrate inhibition equation (solid lines). Each data point represent the mean (S.E.) of triplicate determinations.
Apparent kinetic parameters of raloxifene glucuronidation to M1 and M2 in human liver microsomes genotyped for UGT1A1*28 polymorphism and calculated microsomal intrinsic and tissue intrinsic clearances
Data are presented as mean (S.E.).
P values that show the difference of apparent kinetic parameters of raloxifene glucuronidation to M1 and M2 among different UGT1A1 genotypes
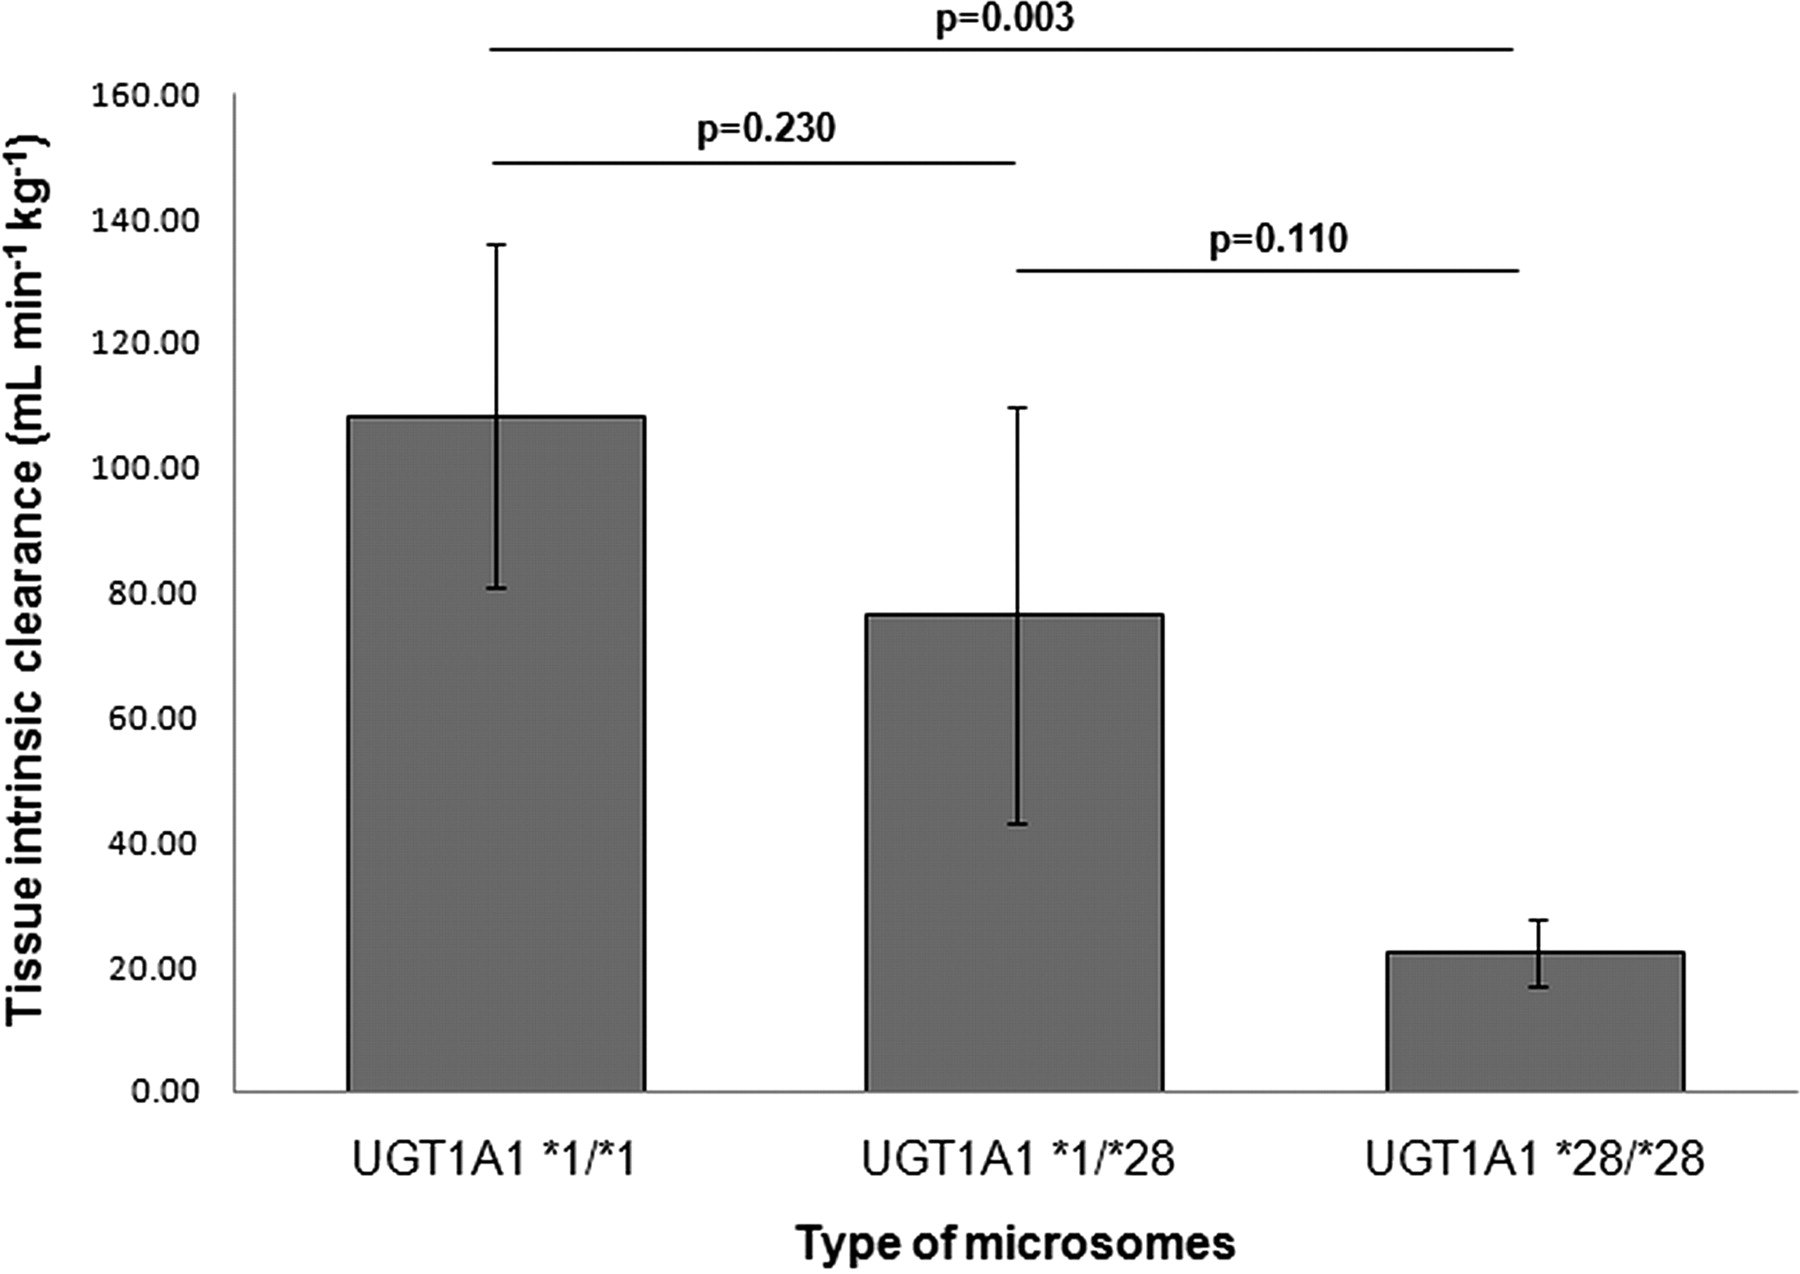
Clint,o determined in the incubation with UGT1A1 *1/*1 human liver microsomes did not differ significantly from UGT1A1 *1/*28, and Clint,o determined in the incubation with UGT1A1 *1/*28 did not differ significantly from UGT1A1 *28/*28 human liver microsomes. Clint,o of UGT1A1 *1/*1 was significantly higher than Clint,o of UGT1A1 *28/*28 (Fig. 4).

Raloxifene tissue intrinsic clearance determined by human liver microsomes genotyped for the UGT1A1*28 polymorphism. The significance criterion (α) was set at P < 0.05.
Discussion
In this study, raloxifene glucuronidation in human kidney, intestine, liver, and lung microsomes was investigated. In addition, the influence of UGT1A1*28 polymorphism on raloxifene glucuronidation in vitro was estimated.
First, we tried to select optimal conditions for the formation of all raloxifene glucuronides observed in vivo (FDA, http://www.fda.gov/cder/foi/nda/99/20815S3_Evista.htm) (Jeong et al., 2005b), but, unfortunately, we were not able to identify the conditions that would lead to the formation of raloxifene diglucuronide (M3). The reason for the absence of the M3 formation in any microsomal incubation lies probably in the microsomes per se as an in vitro model that differs significantly from the in vivo system. There is evidence that UGTs are functional as homodimers and heterodimers in monoglucuronide formation and they may form tetramers in diglucuronide formation (Bock and Köhle, 2009). As published by Gordon et al. (1983), microsomal diglucuronide-forming activity differs characteristically from the monoglucuronide-forming activity, and there is evidence that microsomes are intensely sensitive to manipulation of its membrane environment. Therefore, microsomes are not optimal for the formation of UGT tetramers, which may be crucial for the diglucuronide formation. It was also suggested by Gordon et al. (1983) that the most effective substance to treat the microsomal preparation is digitonin, which makes the active sites of the diglucuronide-forming enzymes more accessible but, at the same time, preserves the linkage of the enzyme to its milieu in the membrane in such a fashion as to preserve its activity. Despite using digitonin instead of alamethicin to treat the membranes, M3 was not formed with any type of microsomes. To reach stable high concentrations of raloxifene in incubation mixture, 1% HSA was used. It is known that raloxifene is only slightly soluble in water (Teeter and Meyerhoff, 2002), which is the reason why Kemp et al. (2002) were not able to determine the kinetic parameters for some types of the microsomes and recombinant enzymes. In our study, all kinetic parameters were successfully determined because of the achieved stable high raloxifene concentrations. The use of 1% HSA was necessary to achieve stable high-enough raloxifene concentrations that enabled us to determine all the kinetic parameters with good reproducibility. It was discovered that HSA with fatty acids could modulate the UGT enzyme kinetics (Rowland et al., 2007, 2008a,b; Miners et al., 2010), therefore the interpretation of our results should be discussed with caution. Glucuronidation by UGT1A9 but not by UGT1A1 seemed to be inhibited by fatty acids included in the HSA (Rowland et al., 2008b).
When comparing the microsomal intrinsic clearances from different organs, it could be said that the intrinsic clearance determined in human intestinal microsomes was the highest (312.2 μl · min−1 · mg−1) followed by the intrinsic clearances in human liver microsomes (44.0 μl · min−1 · mg−1) and human kidney microsomes (17.3 μl · min−1 · mg−1). After transformation of microsomal intrinsic clearances to tissue intrinsic clearances, the order was upside down, and it showed that tissue intrinsic clearance of the liver is the highest followed by the tissue intrinsic clearances of the intestine and the kidney. The tissue intrinsic clearances in kidney, intestine, and liver were 3.4, 28.1, and 39.6 ml · min−1 · kg−1, respectively. In human lung microsomes, the clearance could not be determined because of the lack of metabolic activity toward raloxifene. This is in accordance with the absent expression of isoforms in the lung (Ohno and Nakajin, 2009) responsible for raloxifene glucuronidation. When comparing the ratio of M1 and M2 formed in different types of microsomes, it was discovered that in the liver, the formation of M2 is 2.3 times higher than the one of M1. In the intestine and kidney, it was found that the formation of M2 is approximately 5 times higher than that of M1. The presence of UGT1A10 in the human intestine (Ohno and Nakajin, 2009) and its absence from the human liver may explain the higher formation of M2 compared with M1 in intestine. It was discovered by Jeong et al. (2005b) and Kemp et al. (2002) that UGT1A10 is responsible for the formation of M2. The higher formation of M2 compared with M1 in the kidney is probably due to UGT1A9, which is the only UGT isoform in the kidney capable of raloxifene glucuronidation. UGT1A1 is the UGT isoform expressed in liver and intestine that contributes to the glucuronidation of raloxifene to M1, M2 (Kemp et al., 2002), and perhaps also to M3.
Because of the reported inhibition of UGT1A9 by fatty acids, the calculated intrinsic clearance in the kidney may be underpredicted because we did not use a fatty acid-free HSA. However, based on previous results published by Kemp et al. (2002), the UGT1A9 contributes quite little to raloxifene conjugation. Therefore, considering the high liver and intestinal raloxifene clearance (and its enterohepatic cycling), it may be speculated that the kidney does not play a major role in overall raloxifene metabolism. In the case of genotyped liver microsomes, the same concentration of HSA was used across all genotypes. Moreover, UGT1A1 isoform is not influenced by fatty acids in HSA (Rowland et al., 2008b). Consequently, the comparison of the obtained results seems reasonable.
As published by Trontelj et al. (2009), UGT1A1*28 polymorphism may have an influence on the pharmacokinetics and pharmacodynamics of raloxifene. To confirm this finding also by in vitro experiments, human liver microsomes genotyped for the UGT1A1*28 polymorphism were used. This in vitro system should provide a useful tool to allow a more comprehensive prediction of UGT1A1 metabolism and to gain an insight into the effects of the UGT1A1*28 polymorphism (Peterkin et al., 2007; Yoder Graber et al., 2007; Zhang et al., 2007). The influence of UGT1A1*28 polymorphism on glucuronidation of raloxifene to M1 and M2 was confirmed in our study and was especially prominent in the case of M1 formation, where UGT1A1 *1/*1, *1/*28, and *28/*28 differed significantly. No significant influence on the formation of M2 was observed because of the high variability in estimated apparent kinetic parameters, although a trend toward lower glucuronidation activities was observed when UGT1A1*28 polymorphism was present. When the formation of glucuronide followed a substrate inhibition model, as in the case of M2, the estimation of apparent kinetic parameters by a nonlinear regression was less accurate compared with the Michaelis-Menten kinetics. The same as in incubation with other types of microsomes, M1 followed the Michaelis-Menten kinetics and M2 followed the substrate inhibition model. Comparison of metabolite formation according to the UGT1A1 genotype revealed that the heterozygotes metabolize raloxifene 2 times more efficiently to M2 than to M1 compared with both types of homozygotes that form equally M1 and M2. When comparing microsomal intrinsic clearances and tissue intrinsic clearances of different UGT1A1 genotypes, it was determined that the clearances of both homozygotes differ significantly, whereas the clearance determined on human liver microsomes of heterozygotes did not differ from the wild-type and mutated homozygotes significantly. The microsomal experiments showed the expected decrease in glucuronidation activity of raloxifene in UGT1A1*28/*28 human liver microsomes. We were surprised to find that a previous in vivo study by Trontelj et al. (2009) showed a conflicting result of higher levels of raloxifene glucuronides in *28/*28 compared with *1/*1 and *1/*28 individuals. Although the same could not be proven for raloxifene alone, the total raloxifene (sum of metabolites and parent raloxifene) concentrations were significantly higher in variant homozygotes. Because raloxifene metabolites can be considered as transport forms of active raloxifene, whose concentration is extremely variable and low, the total raloxifene can be used as a better parameter to evaluate raloxifene exposure. Moreover, the terminal parts of unconjugated plasma raloxifene levels were found to be parallel to raloxifene glucuronide levels (Hochner-Celnikier, 1999), indicating an equilibrium and interconversion of raloxifene species (Hochner-Celnikier, 1999) (FDA, http://www.fda.gov/cder/foi/nda/99/20815S3_Evista.htm). Thus, the higher total raloxifene means also a higher active raloxifene exposure, which may be linked to a lower raloxifene metabolic clearance in *28/*28 individuals as demonstrated by the present study. However, the phenomenon of higher metabolite levels observed in *28/*28 individuals is still difficult to understand with our limited data. It may be hypothesized that the higher glucuronide concentrations in *28 homozygotes is caused by the metabolic enzyme-transporter interplay as already proposed by Trontelj et al. (2009). Inhibition of one process leads to the inhibition of a linked process of metabolic conversion and excretion of the formed metabolites (Jeong et al., 2005a; Wu and Benet, 2005). Therefore, in the *28/*28 group, a decreased conjugating activity in the liver may cause a lower formation rate and a lower excretion rate of raloxifene conjugates as well.
In conclusion, the optimal in vitro incubation conditions for the formation of all three in vivo present glucuronides of raloxifene could not be determined, which is inconsistent with findings from Jeong et al. (2005b) and Kemp et al. (2002). Although the intrinsic clearance of the liver and the intestine has already been published, the intrinsic clearances of the kidney and lung have not been published yet. In addition, tissue intrinsic clearances of the tested organs were determined, and it was shown that tissue intrinsic clearance of the liver is higher than the tissue intrinsic clearance of the intestine even though the microsomal intrinsic clearances of these organs are ranked in the opposite direction. The tissue intrinsic clearance of the kidney is 10 times lower than tissue clearance of the liver. Moreover, the hypothesis that UGT1A1*28 polymorphism influences raloxifene metabolism was confirmed. The clearance of raloxifene determined on human liver microsomes with UGT1A1*1/*1 genotype was significantly higher than the clearance determined on human liver microsomes with UGT1A1*28/*28 genotype.
Authorship Contributions
Participated in research design: Trdan Lušin, Trontelj, and Mrhar.
Conducted experiments: Trdan Lušin.
Contributed new reagents or analytic tools: Trdan Lušin, Trontelj, and Mrhar.
Performed data analysis: Trdan Lušin and Trontelj.
Wrote or contributed to the writing of the manuscript: Trdan Lušin, Trontelj, and Mrhar.
Footnotes
This work was supported by the Slovenian Research Agency [Grant J1-0957].
Article, publication date, and citation information can be found at http://dmd.aspetjournals.org.
doi:10.1124/dmd.111.041897.
-
ABBREVIATIONS:
- M1
- raloxifene-6-β-glucuronide
- M2
- raloxifene-4′-β-glucuronide
- M3
- raloxifene-6,4′-di-glucuronide
- UDPGA
- uridine 5′-diphospho-glucuronic acid
- Clint
- microsomal intrinsic clearance
- Clint,o
- tissue intrinsic clearance
- HSA
- human serum albumin
- FDA
- U.S. Food and Drug Administration
- UGT
- UDP-glucuronosyltransferase
- DMSO
- dimethyl sulfoxide
- LC-MS/MS
- liquid chromatography-tandem mass spectrometry.
- Received July 22, 2011.
- Accepted September 21, 2011.
- Copyright © 2011 by The American Society for Pharmacology and Experimental Therapeutics


