


Abstract
Many laboratories use recombinant UDP-glucuronosyltransferases (UGTs), expressed in baculovirus-infected insect cells, for drug glucuronidation studies. We have infected Sf9 insect cells with increasing amounts of recombinant baculovirus, encoding either UGT1A9 or UGT2B7, and measured both glucuronidation activity and immunodetectable UGT in the resulting cell homogenates. The correlation between glucuronidation rates and degree of infection followed different trends, depending on whether activity was the actual activity measured or was corrected for UGT expression level. Above a certain low level of infection, further increases in infection ratios led to a large decline in normalized activity, presumably due to the presence of full-length but inactive enzyme in the sample. Because immunodetection does not distinguish between active and inactive UGT, comparison of normalized activity between different batches of a recombinant UGT, mutants of a given UGT, or different UGTs is prone to large inaccuracies. Such inaccuracies could be reduced by lowering the degree of infection of the insect cells, in combination with careful monitoring of UGT expression. However, the latter requires suitable antibodies for comparing UGT expression levels among preparations, antibodies that are not always available. Poly-His (His-tag)-containing peptides, fused to the UGT C terminus, allow sensitive immunodetection of expressed enzymes with monoclonal antibodies. We have now carefully examined the effects of two such fusion peptides on enzyme kinetics. A minor increase in the Km values has been detected in the His-tagged UGTs, but no changes in parameters such as the kinetic model and the effects of albumin addition.
Introduction
UDP-glucuronosyltransferases (UGTs) play important roles in detoxification of xenobiotics, pharmacokinetics of drugs, and homeostasis of endogenous compounds (King et al., 2000; Wells et al., 2004). UGTs catalyze the conjugation of a substrate molecule with glucuronic acid from the cosubstrate UDP-glucuronic acid (UDPGA). Such glucuronidation reactions increase water solubility of substrates and stimulate their excretion from the cell and the body.
There are 19 different human UGT enzymes in subfamilies 1A, 2A, and 2B (Mackenzie et al., 2005) and 2 in the UGT3A subfamily (Meech and Mackenzie, 2010). The latter two enzymes use UDP-sugar donors other than UDPGA (Mackenzie et al., 2011) and are not included in this study. Because of exon sharing among the UGT1As, the protein sequence of the C-terminal half, including the C-domain, the envelope helices, and the transmembrane helix-cytoplasmic tail of all the members of this subfamily are identical (Mackenzie et al., 2005) and a similar situation is also present between UGT2A1 and UGT2A2 (Sneitz et al., 2009). In UGTs of subfamily 2B and in UGT2A3, there is no exon sharing and each gene contains all the exons.
The UGTs are located in the endoplasmic reticulum membrane and are arranged so that most of their mass, including the N domain, the C domain, and the envelope helices, is located on the luminal side of the membrane (Radominska-Pandya et al., 1999). The N and C domains contain the substrate and cosubstrate binding sites, respectively, strongly suggesting that the active site of all the UGTs is on the luminal side of the endoplasmic reticulum membrane. This means that the “cytoplasmic tail” of the UGTs, as the approximate 20 residues at the very C terminus of the proteins are often called, is as far as possible from the active site of the enzymes. It is thus interesting that some previous studies reported that the genetic fusion of different peptides to the C terminus of UGTs significantly decreases activity (Meech et al., 1996; Lewis et al., 2011). On the other hand, using the baculovirus-infected insect cell expression system, we have not observed major effects of the fusion peptides we have used on the activity of UGT1A9 (Kurkela et al., 2003). Nonetheless, because of possible negative effects of the C-terminal fusion peptides we were planning to attach (cf. Meech et al., 1996), our first constructs also included a site for endopeptidase digestion for removing the His-tag after affinity purification (Kurkela et al., 2003). However, this treatment was never done because testing the tagged UGTs did not reveal a clear need for it. Nevertheless, the contradictory findings in the literature prompted us to examine the possible effects of an added string of 6 His residues (a His-tag) at the end of two short fusion peptides (which differ in length, from 3 or 4 residues in the -His to 11 or 12 residues in the -XHA/XHC constructs) at the C terminus of the UGTs (Table 1) on the cytoplasmic side of the endoplasmic reticulum membrane on the activity and kinetics of the UGTs.
C-termini sequences of the UGTs in this study
Asterisks indicate the end of the protein.
The substrate specificity of the human UGTs is very complex and partly overlaps. Recombinant UGTs, expressed individually in baculovirus-infected insect cells, HEK293 cells, or other, less common, systems (Radominska-Pandya et al., 2005), are often used to identify UGTs that can catalyze the glucuronidation of a new compound. Nevertheless, it is difficult to quantitatively compare the glucuronidation rate of two different UGTs or two genetic variants of the same enzyme, because UGT activity is measured in membrane samples or cell homogenates, not purified proteins. The amount of a given recombinant UGT in a sample may vary widely and has to be estimated by immunodetection. Suitable antibodies are not always available, unfortunately, particularly when enzymes of subfamily 2B are compared with enzymes of subfamily 1A. The His-tag we originally fused to the C terminus of recombinant human UGTs to facilitate affinity purification, can be used to overcome this limitation by serving as an identical and specific antigenic site for monoclonal antibodies (Kurkela et al., 2007). However, this requires that the tags themselves do not affect enzymatic activity significantly.
In this work, we describe how the His-tag, as an antigenic site, has been used for examining and improving the preparation of recombinant UGTs when one is trying to minimize the fraction of inactive enzyme in the samples. In addition, we have taken a close look at the possible effects of the His-tag on the activity of either UGT1A9 or UGT2B7 to ascertain that their use does not affect the catalytic activity of the enzymes.
Materials and Methods
Materials and Chemicals.
UDP-glucuronic acid triammonium salt (the cosubstrate) and most of the substrates used in this study [1-naphthol, 4-methyumbrillferone (4-MU), epitestosterone, ethinylestradiol, scopoletin, indomethacin, and zidovudine] were purchased from Sigma-Aldrich (St. Louis, MO). Entacapone was a generous gift from Orion Ltd. (Espoo, Finland). Pooled human liver microsomes (lot 18888) and anti-UGT1A1 polyclonal antibody were bought from BD Biosciences (San Jose, CA). The tetra-His monoclonal antibodies were from QIAGEN GmbH (Hilden, Germany). The anti-UGT2B (H-300) rabbit polyclonal IgG antibody, the goat anti-rabbit IgG HRP antibody, and the goat anti-mouse IgG HRP antibody were from Santa Cruz Biotechnology (Heidelberg, Germany).
C-Terminal Variant Preparation.
Preparation of the -XHA and -XHC variants was described previously (Kurkela et al., 2003). The new variants, -TL (wild-type C terminus; TL stands for “tag-less”) and the -His variants that contain a shorter C-terminal fusion peptide than -XHA/XHC (see Table 1 for the C-termini of all the variants that were used in this study), were prepared using the 1A1-XHC and 2B7-XHA plasmids as templates for polymerase chain reaction amplifications and as vectors for subcloning the resulting amplified fragments, as follows.
For the constructions of 1A1-TL (and other UGTs of the UGT1A subfamily), we have used a reverse oligonucleotide, 1A1-TL-R, that contains a stop codon at the position of the original stop codon of the genes, followed immediately by a Sal1 restriction site. The forward oligonucleotide for UGT1A1, 1A1-TL-F, was from the UGT1A1 sequence just upstream from the internal BstE2 restriction site. The corresponding oligonucleotides for UGT2B7 were 2B7-TL-R and 2B7-TL-F (upstream from the internal EcoR1 site): 1A-TL-R, 5′-TTTGTCGACTTAATGGGTCTTGGATTTGTGGGCT-3′; 1A-TL-F, 5′-TGTTAAGTGGCTACCCCAAAACGATCTGCT-3′; 2B7-TL-R, 5′-TTTGTCGACTAATCATTTTTTCCCTTCTTTGCT-3′; and 2B7-TL-F, 5′-TAATGATCCTTCATATAAAGAGAATG-3′. The amplified fragments were then digested with Sal1 and either BstE2 (1A1-TL) or EcoR1 (2B7-TL) and subcloned into 1A1-XHC or 2B7-XHA that were digested with the corresponding enzymes.
For the construction of the 1A1-His and 2B7-His plasmids, starting from 1A1-XHC and 2B7-XHA, respectively, we have used a forward oligonucleotide that inserts a Sal1 site, in either the 1A1-XHC plasmid (1A1-His-F) or the 2B7-XHA plasmid (2B7-His-F), immediately upstream of the 6 His residues in the corresponding plasmids (noting the difference in reading between the -XHA to the -XHC constructs), in combination with a reverse oligonucleotide (UGT-His-R), the sequence of which was downstream from the internal Mun1/Mfe1 site in the pFastBac1 vector: 1A-His-F, 5′-GAAGTCGACCATCATCATCATCATCATTAG-3′; and 2B7-His-F, 5′-TCGTCGACACATCATCATCATCATCATTAG-3′. The amplified fragment in each case was subcloned into the corresponding plasmid that was digested with Sal1 and Mfe1.
Recombinant UGT Expression and Expression Optimization Assays.
Recombinant UGTs were expressed in Sf9 insect cells (a cell line from the ovarian tissue of the fall army worm Spodoptera frugiperda) as described previously (Kurkela et al., 2007). The mutations to generate the -TL and -His fusion tag variants (Table 1) were prepared according to the QuikChange protocol (Stratagene, La Jolla, CA) using either cloned UGT1A1 or UGT2B7 in the shuttle vector pFastBac 1 (Kurkela et al., 2003), as the template for mutagenesis. The resulting mutants were sequenced in both directions and then used to prepare recombinant baculoviruses according to the Bac-to-Bac procedure (Invitrogen, Carlsbad, CA). The 1A9-TL clone was prepared by replacing the segment downstream from its internal BstE2 restriction site with the corresponding segment from 1A1-TL.
After preparation of recombinant virus stock, we tried to optimize the expression of active UGT enzymes and to minimize the expression of inactive UGTs. To this end, cell suspensions, at 2 million cells/ml growth medium, were infected with different amounts of “P3” or “P4” virus suspension (supernatant after three or four rounds of virus amplification following the initial insect cell transfection, according to the manufacturer's instruction) at ratios ranging from 0.25 to 10 μl of virus stock/ml diluted Sf9 cell suspension. Approximately 10 ml of each of these small cultures was grown at 27°C for 48 h, and the cells were then sedimented by centrifugation at 1500g. The pellets were suspended in 500 μl of Milli-Q water, and the expression level of the UGT in each of the suspended pellets was evaluated by dot-blotting with Tetra-His monoclonal antibodies and anti-mouse IgG HRP as the secondary antibody (Kurkela et al., 2004). In parallel, the glucuronidation activity of each of the suspended cell pellets was evaluated using a suitable aglycone substrate. For optimization of 1A9-XHC and 2B7-XHA, the substrate was 4-MU and its concentration in the “optimization assays” was either 100 μM (1A9) or 500 μM (2B7).
Determination of Relative Expression Levels.
To derive normalized activity rates (i.e., rates corrected for relative expression levels of the different UGTs) we used dot blot analyses, as described previously (Kurkela at al., 2007) for His-tagged UGTs. However, we used Western blots for UGTs that lack a His-tag (the -TL constructs). Hence, the expression levels of UGTs 1A1-XHC, 1A1-His, and 1A1-TL and the native UGT1A1 in human liver microsomes (HLM) were compared using anti-1A1 as primary antibody and anti-rabbit IgG HRP as the secondary antibody. In these and other Western blot analyses, we included a negative control sample (Bac control) made from Sf9 cells infected with baculovirus that did not encode any UGT. The expression levels of 2B7-XHA, 2B7-His, and 2B7-TL were compared by Western blot analysis using anti-2B (H-300; Santa Cruz Biotechnology) antibody as the primary antibody with the same secondary antibody and negative control as for the above samples. The Super Signal West Pico Chemiluminescence Substrate Kit from Thermo Fisher Scientific (Waltham, MA) was used in the chemiluminescence signal development and a GeneGnome instrument (Syngene Bio Imaging, Cambridge, UK) for its detection and analysis. The relative expression levels in the UGT1A1 and UGT2B7 batches that were used for studying the effects of the C-terminal fusion peptides were determined separately. In the case of the UGT1A1s, they were 1.0 for 1A1-XHC, 1.2 for 1A1-TL, and 2.4 for 1A1-His. Among the UGT2B7 batches they were 1.0 for 2B7-XHA, 1.2 for 2B7-TL, and 3.5 for 2B7-His. To correct for relative expression level differences (to normalize the activity), the measured glucuronidation rates (actual rates) were divided by the respective relative expression level value of each variant.
Membrane Preparation.
After determination of the optimal infection ratio for a given virus stock, we used that ratio to infect a larger volume of insect cells in suspension (at the same density, 2 million cells/ml growth medium), mostly 200 or 300 ml, for the production of the desired recombinant UGT. The cells were cultured at 27°C, on a rotating base at 120 rpm, for 48 h and collected by centrifugation at 1500g for 5 min using an Eppendorf Centrifuge 5810R. The resulting cell pellets were resuspended in ice-cold water at a ratio of 100 ml of water/50 to 75 ml of cultured cells and submitted to osmotic lysis while stirring at 4°C for 30 min. The membranes were separated from cell debris by centrifugation at 800g for 5 min at 4°C. Then membranes were collected by centrifuging at 41,000g in a Sorvall RC5B Plus centrifuge. Finally, the precipitated membranes were resuspended in a few milliliters of ice-cold Tris-EDTA buffer (25 mM Tris-HCl and 0.5 mM EDTA, pH 7.5), homogenized in a glass Potter homogenizer, divided into 1.5-ml bench centrifuge tubes, and stored at −80°C until use. The protein concentration in the stored membrane aliquots was typically 20 to 30 mg/ml. Protein concentrations were determined by the Pierce BCA (bicinchoninic acid) protein assay method (Thermo Fisher Scientific).
Glucuronidation Assays.
The glucuronidation assays were performed in a total volume of 100 μl containing 50 mM sodium phosphate buffer, 10 mM MgCl2, and 5 mM UDPGA. The DMSO, substrate, and protein concentrations in the different assays are listed in Table 2. The reaction mixture without UDPGA was preincubated at 37°C for 5 min. The reaction was initiated by the addition of 10 μl of UDPGA, incubated for 30 min, and terminated by the addition of 60 μl of a methanol-4 M perchloric acid (5:1) mixture. The reaction mixture was placed on ice for 10 min before centrifugation at 16,100g for 10 min. The resulting supernatant was subjected to HPLC or UPLC analysis.
Glucuronidation assays conditions
The selected substrates that were used for each recombinant UGT, the substrates and protein concentrations in the incubation, and the inclusion of DMSO in some of the assays are listed.
Liquid Chromatography, HPLC, and UPLC.
The 1-naphthol, 4-MU, entacapone, and scopoletin assays were analyzed using an Agilent HPLC system (Agilent Technologies, Waldbronn, Germany), ethinylestradiol glucuronidation was assayed using a Shimadzu HPLC system (Shimadzu, Kyoto, Japan), and indomethacin and zidovudine (AZT) activity was measured using a Waters Acquity UPLC system (Waters, Milford, MA). The analytical methods for the glucuronidation of 1-naphthol, ethinylestradiol, indomethacin, and AZT were as described in Zhang et al. (2011) for 4-MU glucuronidation as analyzed in Manevski et al. (2011) and for scopoletin as in Kurkela et al. (2003). Entacopone and its glucuronide were separated using a Poroshell column (120 EC-C18, 4.6 × 100 mm, 2.7 μm) at a flow rate of 1 ml/min. The mobile phase was 0.1% formic acid-methanol, and the elution was performed using a gradient of formic acid, 80 to10 to 10 to 80 to 80% at 0, 7, 7.5, 8, and 10 min. The UV signal was detected at 305 nm, and the standard curve was generated using authentic entacapone glucuronide.
Kinetic Analyses.
We tested the kinetics of differently tagged UGT1A9 variants, each at 0.02 mg/ml total protein, in the glucuronidation of 4-MU (substrate concentration in the range of 0 to 300 μM) and entacapone (0–400 μM). The kinetics of the differently tagged UGT2B7 variants, each at a concentration of 0.05 mg/ml, was studied for both 4-MU (0–1500 μM) and AZT (0–2000 μM) glucuronidation. The kinetics of HLM, at a protein concentration of 0.02 mg/ml, was investigated for entacapone (0–400 μM substrate concentration) and AZT (0.05 mg/ml, 0–2000 μM) glucuronidation. The incubation conditions for these assays were as described above, except that alamethicin, 5% of the protein concentration, was added to the assays in which HLM was the enzyme source, but not to analyses of recombinant UGTs (Zhang et al., 2011). In addition, 0.1% BSA was added to the kinetic assays of 4-MU, entacapone, and AZT glucuronidation assays for the studies on the His-tag effects (Manevski et al., 2011).
The kinetic data were analyzed using GraphPad Prism, version 4.0. Each set of glucuronidation rates was transformed into Eadie-Hofstee plots to determine the most appropriate kinetic model, and then subjected to curve simulation. The kinetic constants were calculated using one of the following equations.
Equation 1, Michaelis-Menten model:
 where v is the reaction velocity, Vmax is the maximal velocity, [S] is the substrate concentration, and Km is the substrate concentration at half Vmax.
Equation 2, substrate inhibition model (Tracy and Hummel, 2004):
 where Ksi is the constant of substrate inhibition interaction.
Equation 3, sigmoid kinetics (Hill equation) (Tracy and Hummel, 2004):
 where S50 is analogous to Km in eq. 1 and represents the substrate concentration at half Vmax and H is the Hill coefficient.
Equation 4, two-site inhibition model (Zhou et al., 2010):
 where Ksi is the binding affinity constant and β reflects changes in the rate of product formation.
Results
This study characterizes recombinant human UGTs from the points of view of expression optimization and the advantages or disadvantages of a C-terminal His-tag. Our work on expression optimization started from our observation that the relation of the infection size of the insect cells to glucuronidation activity was different from its relation to the amount of immunodetectable recombinant UGT. Although a similar phenomenon was obvious with all the UGTs we have expressed, in this study we have concentrated on UGT1A9 and UGT2B7 (Figs. 1 and 2, respectively).
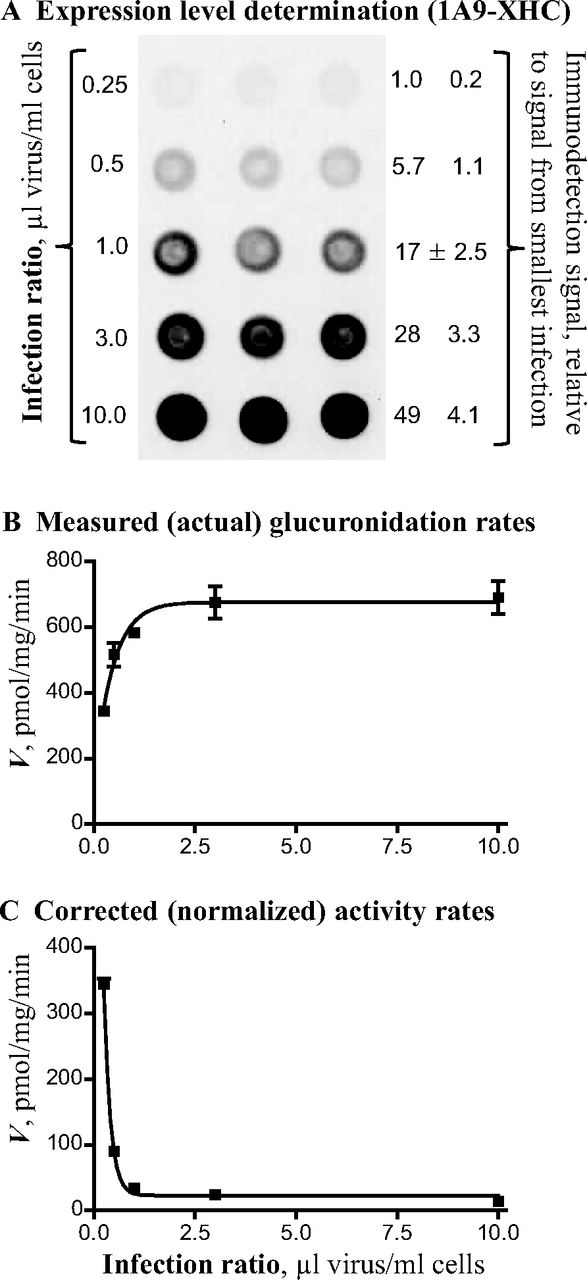
Optimization experiment for UGT1A9-XHC expression. A, dot blot result showing the expression level of different infection samples. The relative expression level was calculated using expression in the lowest infection ratio samples as the reference. B, actual glucuronidation rate; substrate was 100 μM 4-MU. C, normalized glucuronidation rates. All the values are means ± S.D. (n = 3).

Optimization experiment for UGT2B7-XHA expression. Details are the same as in the legend to Fig. 1, except that the substrate concentration in this assay was 500 μM 4-MU.
In the experiments described in Figs. 1 and 2, we present an infection titration of a fixed concentration of Sf9 cells in suspension with a variable amount of virus suspension (from the stock suspension that we had prepared earlier), i.e., the specific infection ratio. The UGT protein expression level in these experiments was determined using dot blot (Kurkela et al., 2007) rather than Western blot, because in this way it is easier to analyze many samples, in triplicate, side-by-side and because the monoclonal antibodies we used do not cross-react with control cells (Kurkela et al., 2007). Nevertheless, when we used a polyclonal antibody that is UGT isoform-specific but which also binds to other components in the insect cell membranes, such as the anti-UGT1A1 antibodies, we performed Western blots rather than dot blots (Fig. 3).

Western blot analyses of different UGT1A1 variants with anti-1A1 antibody and of different UGT2B7 variants with anti-2B (H300). The expression level values determined from these Western blots are listed as means ± S.D. (n = 3). Bac, baculovirus.
The activity of the enzymes in the expression optimization experiments (Figs. 1 and 2) was assayed using 4-MU as the aglycone substrate. The measured (actual) glucuronidation rate for each infection point was divided by the relative expression level for the respective sample (using the expression level from the lowest infection size as a reference) (Figs. 1A and 2A) to yield the normalized activity. The results in Figs. 1 and 2 clearly demonstrate that the highest level of normalized activity, namely the highest glucuronidation rate per expressed UGT, is achieved only when the infection ratio is small. There are differences between the UGTs in how sharply the normalized activity declines with increasing expression level, but for both UGT1A9 and UGT2B7, at least in our hands, increasing the virus infection ratio leads to decreased normalized activity (Figs. 1 and 2). In addition, there appears to be a limit to how much the uncorrected activity increases with an increased infection ratio. Even the uncorrected activity may decrease at high infection ratios, but this varies from case to case, whereas the normalized activity decreases in all the UGTs we have tested thus far (results not shown).
The 1A9-XHC and 2B7-XHA that were used in the normalization activity experiments carry a C-terminal fusion tag that is composed of a His-tag preceded by an endopeptidase cleavage site (Table 1) (Kurkela et al., 2003). Whereas the added antigenic site allows easy comparison of the expression level of all the different recombinant UGTs (Figs. 1 and 2), one might argue that this would lead to artifacts, because native UGTs do not have such fusion peptides. To address this concern, we prepared additional C-terminal variants of selected UGTs and used them to carefully test the effects of the tags on the UGT kinetics. The first similar pair of tags, -XHC and -XHA (Kurkela et al., 2003) are the ones we used in most of the recombinant UGTs that were prepared in our laboratory in Helsinki. In addition to the six His residues and the endopeptidase cleavage site, these peptides contain two or three additional residues that were inserted between the start of the endopeptidase cleavage site and the original C terminus of the UGTs to avoid changing any of the original residues of the UGTs. In the -XHA tag, which was used for all the members of UGT2A and UGT2B subfamilies, the additional residues were Ser and Thr, whereas in the -XHC tag, which was used for all the UGTs of subfamily 1A, the additional residues were Val, Asp, and Lys (Table 1).
In addition to the -XHA/-XHC tags and the enzymes without any C-terminal tag (-TL variants, tag-less), we have also prepared a shorter C-terminal fusion tag that contains only three or four residues followed by six His residues and termed it -His (Table 1).
The expression levels of the different variants of UGT1A1 and of UGT2B7, including the -TL variants that are not detectable by anti-His-tag antibodies, were determined by Western blots with suitable primary antibodies (see Materials and Methods). The expression level of UGT1A1 in HLM was also determined because the UGT1A1-specific antibodies are suitable for this (Fig. 3A). For UGT2B7, failure to get good results with some antibodies that were expected to be UGT2B7-specific prompted us to use anti-UGT2B antibodies and, therefore, the relative expression level of UGT2B7 in HLM could not be determined (Fig. 3B). Trials to compare the expression level of recombinant UGT1A9 between the 1A9-XHC and 1A9-TL constructs were unsuccessful, unfortunately (data not shown).
The effects of tags on the activity of the different UGT1A1, UGT2B7, and UGT1A9 variants were examined using different substrates. In the first round, we used a single concentration of each substrate and included at least one UGT-specific substrate for each of them to assess the corresponding activity also in pooled HLM (Table 2). With each UGT, we present the actual, measured glucuronidation rates, as well as the calculated normalized rates. For UGT1A1, because the antibodies were also suitable for estimating its expression level in HLM, we included the HLM ethinylestradiol glucuronidation activity, both actual and normalized rates (Table 3). In addition, the ratio between the glucuronidation rates of 1-naphthol, 4-MU, and ethinylestradiol are shown separately for each of the three UGT1A1 variants (Fig. 4A). The latter way of presentation has the advantage of being independent of the normalization and the fraction of inactive enzyme in each of the batches.
Glucuronidation activity of the three different UGT1A1 constructs and HLM
The rate values are means ± S.D. (n = 3). The relative expression values of the different UGT1A1 variants and HLM (Fig. 3A) are indicated in parentheses.

Comparison of glucuronidation rates of different substrates, on a percentage basis, among different UGT variants. A, UGT1A1, 4-MU, and 1-naphthol glucuronidation rates are compared with the ethinylestradiol glucuronidation rate. B, UGT2B7, 4-MU, and AZT glucuronidation rates are compared with epitestosterone glucuronidation rates. C, UGT1A9s, 4-MU, 1-naphthol, indomethacin, and scopoletin glucuronidation rates are compared with entacapone glucuronidation rates.
Similar comparisons between the activities of the two variants of UGT1A9 and the three variants of UGT2B7 are shown in Tables 4 and 5 and Fig. 4. In the case of UGT1A9, because of the lack of suitable antibodies to compare the expression levels of 1A9-TL and 1A9-XHC, only the actual glucuronidation rates are presented (Table 5). To partly compensate for this, we performed the UGT1A9 analysis with more substrates, because these ratio comparisons are independent of the expression level (Fig. 4C).
Glucuronidation activity of the three different UGT2B7 constructs and HLM
The rate values are means ± S.D. (n = 3). The relative expression values of the different UGT2B7 variants (Fig. 3B) are indicated in parentheses. The relative expression level of UGT2B7 in HLM could be determined (see Materials and Methods) and, therefore, its AZT glucuronidation rate could not be normalized.
These rate comparisons (Tables 3⇑–5; Fig. 4) show that, although there were some differences in the glucuronidation rates among the different variants of each UGT, the variation was small and may be due to the fraction of inactive enzyme, not the C-terminal tag. Nevertheless, because the above experiments were performed using a single substrate concentration in each case, it might still be suggested that the tags lead to significant differences in the glucuronidation kinetics. To examine this possibility directly, different UGT1A9 and UGT2B7 variants were subjected to kinetic analyses in the most up-to-date way, namely in the presence of 0.1% BSA during the incubations (Manevski et al., 2011).
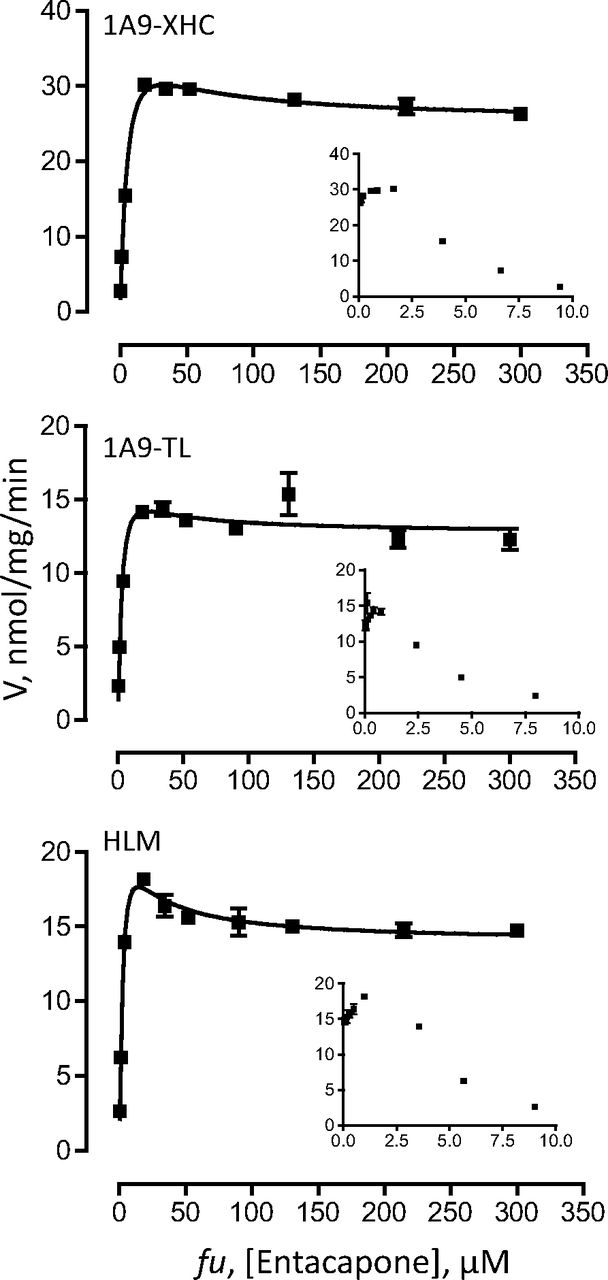
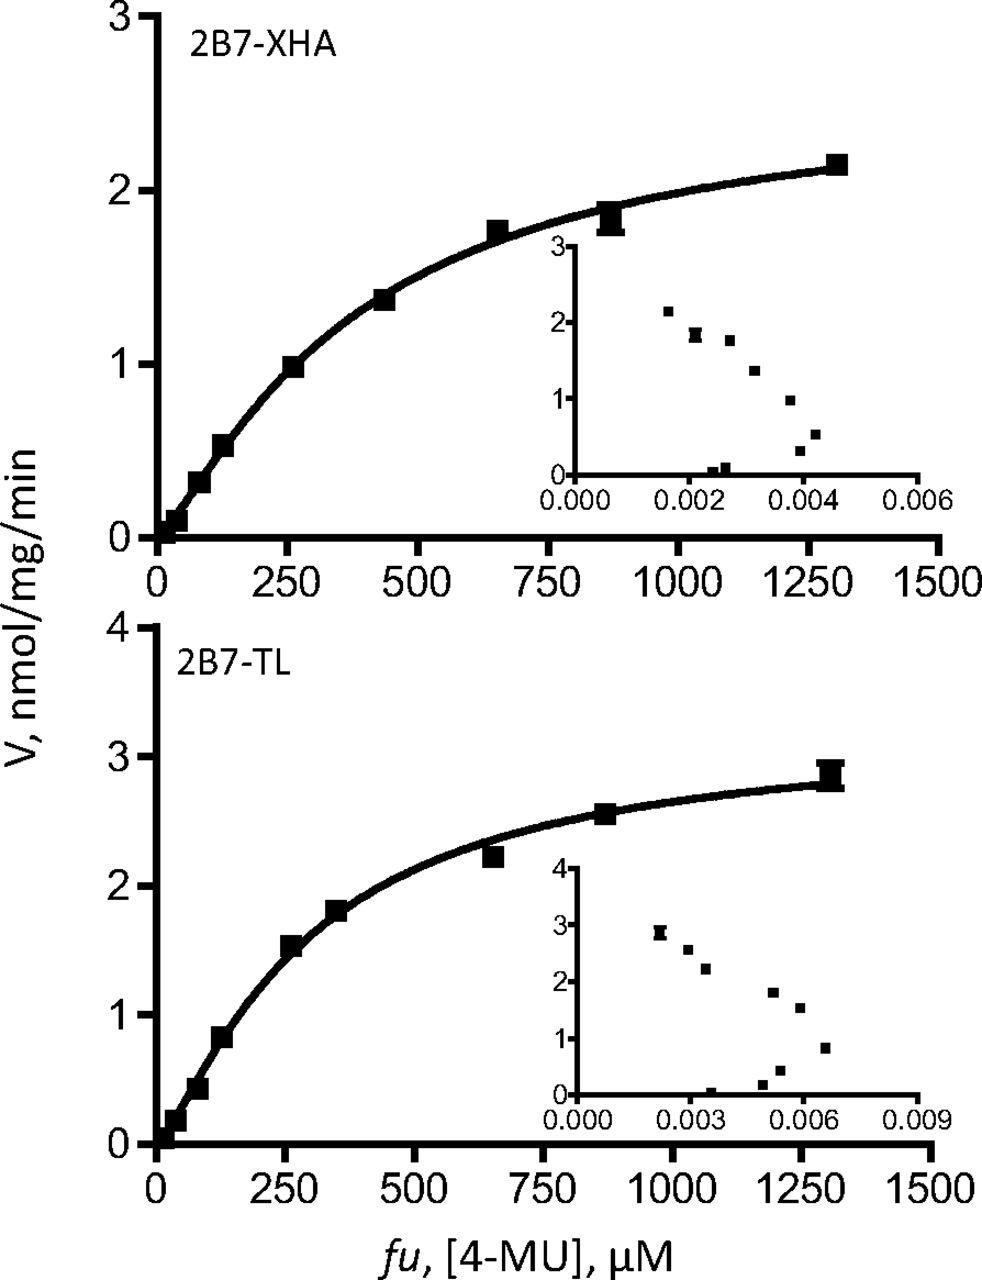
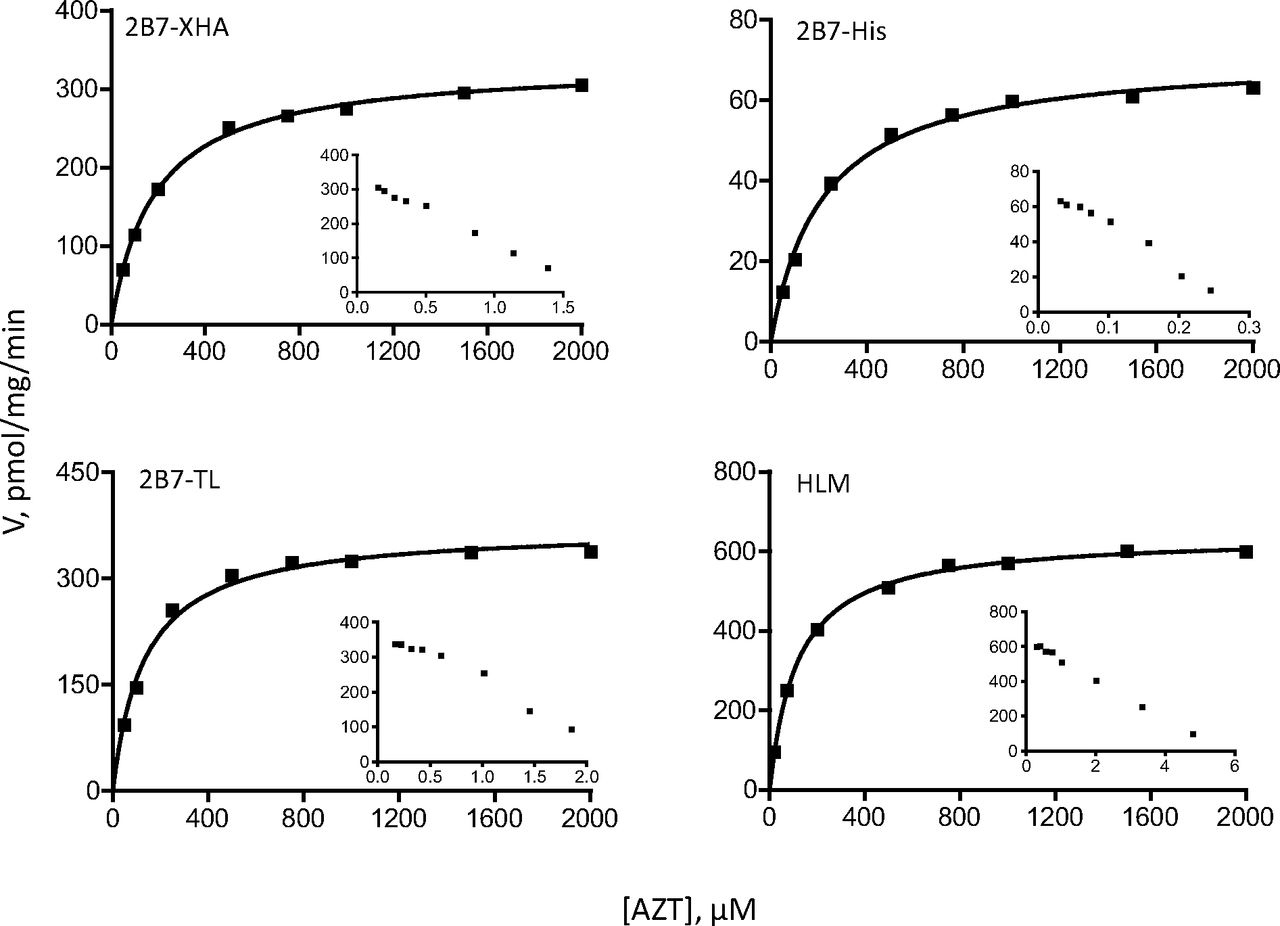
Each set of enzymes was analyzed with two different substrates, 4-MU and entacapone for UGT1A9 (Figs. 5 and 6), whereas for UGT2B7 they were 4-MU and AZT (Figs. 7 and 8). The enzyme-specific substrates were used to allow comparisons also between the recombinant UGTs that were expressed in insect cells and the respective native UGTs in HLM.


Kinetic curves of 4-MU glucuronidation by UGT2B7-TL and 2B7-XHA. The curves were fitted to the Hill equation (eq. 3). UGT2B7-TL glucuronidation rates were normalized to the rates of 2B7-XHA using the expression data (Fig. 3). The kinetic parameters are listed in Table 6, and Eadie-Hofstee plots are shown as insets.

Because BSA binds 4-MU and entacapone, the substrate concentration (fu) in each case, determined as described previously (Manevski et al., 2011), is presented on the x-axes and used in the calculation of the kinetic constants (Table 6). In the case of AZT, because of its negligible binding to BSA (Rowland et al., 2007; Manevski et al., 2011), no correction for albumin-bound substrate was done.
The kinetic assay results were first analyzed by Eadie-Hofstee plots to allow more accurate selection of the kinetic model and the equation required to calculate the kinetic constants. These analyses (insets in Figs. 5⇑⇑–8) clearly show that the tags, either -XHC/-XHA or -His, do not affect the kinetic model of the reactions, regardless of the model complexity (e.g., entacapone glucuronidation kinetics in Fig. 6). Moreover, the results confirm that the kinetics of recombinant UGTs that were expressed in baculovirus-infected cells, with or without the different C-terminal His-tags, is the same as the kinetics of the native UGTs in HLM. Nevertheless, examination of the calculated Km, Ks, or S50 kinetic constants (Table 6) reveals small differences between the variants in this category. Whether these small differences are due to the tags may be difficult to conclude at this stage because one rarely obtains exactly the same Km values when UGTs are tested on different days or in a different laboratory. In any case, it could be said with certainty that if there are differences in the Km values between the C-terminal tagged UGTs and the enzymes without any tag, they are small.
Comparison of Vmax values corrected for UGT expression (i.e., comparison of normalized Vmax values) (Table 6) could only be performed for the few recombinant UGT2B7 variants for which relative expression level data were available. AZT glucuronidation by 2B7-His (the kinetics of 2B7-His for 4-MU glucuronidation was not examined) revealed that this variant is clearly different from both 2B7-XHA and 2B7-TL because it exhibited a much lower Vmax value than either of the latter (Table 6). This result resembles the low normalized glucuronidation rates with different substrates that were found for both 1A1-His (Table 3) and 2B7-His (Table 4). It may be significant that the relative expression levels of the -His variants of both UGT1A1 and UGT2B7 in the samples we have used during this study were clearly higher than the expression level of the other variants of these UGTs (Tables 3 and 4). A possible link between low normalized glucuronidation rates and high relative expression values is discussed below.
Discussion
Recombinant human UGTs that were expressed in baculovirus-infected insect cells are used broadly, but there is little awareness of the limitations of this system, particularly the presence of inactive recombinant protein alongside the active one. Moreover, the ratio of active to inactive UGT may differ among different batches of the same individual UGT. Nevertheless, it should be noted here that all the experiments on the dependence of normalized activity on expression level were performed with the UGTs we have produced, not commercially available UGTs. This is not to say that the commercially available UGTs are superior or inferior to ours; it mainly indicates that such analyses could only be done in the laboratory that produces the recombinant UGTs and can vary the amount of recombinant virus that is used to infect the insect cells, as well as the way the infected insect cells are cultured.
The aim of the current study, concentrating on UGT1A1, UGT1A9, and UGT2B7, was to learn how to reach reasonably high amounts of normalized UGT activity. The results in Figs. 1 and 2 demonstrate that infecting a fixed amount of Sf9 insect cells in solution with an increasing amount of UGT-encoding baculovirus may lead to increased actual glucuronidation activity but decreased normalized enzyme activity. On the basis of our results, it is suggested that the observed decrease in normalized activity with a high expression level of the protein is either due to the lack of not yet fully characterized post-translation modifications, limited availability of needed chaperones and related proteins in the endoplasmic reticulum that assist in protein folding, or a combination of both reasons.
The results of the infection ratio analyses (Figs. 1 and 2) demonstrate that perhaps every sample of recombinant UGT1A9, and also to a lesser extent UGT2B7, contained inactive UGT. The practical question we are constantly faced with when producing different recombinant UGTs is how to get a sample that, on the one hand, is almost free of inactive UGT while, on the other hand, contains sufficient amounts of recombinant enzyme for the different activity and kinetic experiments we plan to do. We currently have no comprehensive solution to this question and, instead, try to reach a reasonable compromise that involves experiments similar to those shown in Figs. 1 and 2. Often the only reasonable compromise is to use a very low infection ratio, which means a relatively low actual glucuronidation rate per milligram of total protein in the sample.
Normalized activity, or expression-corrected activity, has thus far been examined mainly when the activity of a UGT of subfamily 1A was compared with that of another enzyme of the same subfamily. What has not been considered, however, is how well the expression level in any of the recombinant UGTs represents the active form of the enzyme in the particular sample. The results of the present study suggest that recombinant UGT samples may contain different amounts of both active and inactive enzyme, making it difficult to evaluate the significance of comparisons between the expression-corrected activity of different UGTs or different mutants of a given UGT.
The low normalized Vmax rate we have found for 2B7-His (Table 6, note that the Vmax values for the recombinant UGT2B7 variants were normalized values), and the significantly reduced normalized glucuronidation in 1A1-His and 2B7-His in comparison with that for the respective -TL and -XHC/XHA variants (Tables 3 and 4) may suggest that the fusion of six His residues directly to the C terminus of UGTs is reducing their turnover rate. A different possible explanation is that the 2B7-His sample contained a particularly high fraction of inactive enzyme, whereas the Vmax and Km values of the active fraction were similar to those of the other UGT2B7 variants. Some support for the latter suggestion is provided by the much higher relative expression level of the 2B7-His variant compared with that of either 2B7-TL or 2B7-XHA (Table 4). Likewise, a significantly higher relative expression level that leads to a significantly higher fraction of inactive UGT, may explain the low normalized glucuronidation rates of 1A1-His, compared with those of 1A1-TL and 1A1-XHC (Table 3). Future studies may help to further clarify this issue.
Despite the limitations of normalized activity determinations, as shown in this study, estimates of the activity of different individual UGTs may be closest by comparisons of their relative expression levels. For this, however, one must have useful antibodies that detect identical antigenic sequences in all the UGTs of interest, a requirement that is currently only fulfilled by the UGTs of subfamily 1A. When we first prepared the human UGTs for heterologous expression in insect cells, we fused them with a C-terminal His-tag, in the form of -XHC/-XHA, in the hope that it would assist in their purification (Kurkela et al., 2003). Although these purification experiments were terminated because of the severe inhibitory effects of the detergent needed to isolate the membrane-bound UGT, we have realized that a C-terminal His-tag can be used to compare the relative expression levels of two or more human UGTs, something that no other antibody currently provides. It was also clear from the start that these fusion tags do not abolish glucuronidation activity (Kurkela et al., 2003), but in the present study we wanted to go further and carefully test whether or not these and related His-tags affect the kinetics of the UGTs.
Two important human hepatic UGTs were selected for this study, UGT1A9 and UGT2B7. Kinetic analyses of these UGTs focused on the determination of kinetic model and Km (or equivalent) values (Vmax values could not be compared between His-tagged and untagged UGTs 1A9 or between recombinant variants of 2B7 and the enzyme in HLM, because of the lack of suitable antibodies). The results demonstrate that if the His-tags have any effect on the kinetics of the UGTs, they are minor (Figs. 5⇑⇑–8; Table 6). In no case was the kinetic model of the reaction changed by the tag, regardless of the kinetic model that the reaction followed, either a relatively simple model such as Michaelis-Menten (AZT glucuronidation by UGT2B7 in Fig. 8) or a much more complex one such as the two-site substrate inhibition model (entacapone glucuronidation by UGT1A9 in Fig. 6). In addition, the interactions of recombinant UGT1A9 expressed in our laboratory (in insect cells and with a C-terminal His-tag) with BSA are practically identical to the interactions both with the native UGT1A9 from HLM and the commercial recombinant UGT1A9 that lacks a C-terminal His-tag, with BSA (Manevski et al., 2011). It may be added here that the amount of different recombinant UGT in the assay, meaning here the concentration of active enzyme in each case, was not identical in each sample, somewhat limiting the interpretation of the activity rate results. However, because the results of this study reveal that concentrations of active UGT vary significantly among samples, there is currently no way to accurately determine the active UGT concentration. It is hoped that future development will teach us how to avoid the accumulation of inactive UGT or will provide a clear way to distinguish between active and inactive recombinant enzyme.
With respect to the properties of recombinant UGTs from different expression systems, it is noteworthy that we performed a study on the effects of N-glycosylation in human UGT1A9, using mutagenesis of Asn residues that were predicted to undergo N-glycosylation and performing enzymatic deglycosylation (A.-S. Patana, M. Kurkela, A. Goldman, and M. Finel, unpublished data). Our results indicated that N-glycosylation plays a role in the folding of the enzyme, but not in its activity once folded. By coincidence, another group performed an almost identical study and published their results shortly before our article was ready. Nevertheless, two differences between the two studies make it worth telling about our unpublished study here. The first is that their UGT1A9 lacked any C-terminal fusion peptide and the second is that it was expressed in HEK293 cells (Nakajima et al., 2010). The nearly identical results and conclusions of the two studies indicate that the similarity between active recombinant UGTs that were expressed in HEK293 cells and His-tagged UGTs from baculovirus-infected insect cells is very high. It may be added here that in contrast to the results we (unpublished data) and Nakajima et al. (2010) got with UGT1A9, a very recent study found that N-glycosylation affects the activity of UGT2B7 that was expressed in HEK293 cells (Nagaoka et al., 2012). The reason for this difference is currently unclear.
To exclude the possibility that the inactive UGT fraction we have identified in this study is the fraction of recombinant UGT that has not undergone complete N-glycosylation, we have tested the effect of infection size on the actual and normalized activity of the human UGT2B4, an enzyme that lacks predicted N-glycosylation sites (A.-S. Patana, M. Kurkela, A. Goldman and M. Finel, unpublished observations). The results revealed a dependence of the normalized activity on infection size very similar to that seen for UGT1A9 and UGT2B7 (Figs. 1 and 2, respectively). In other words, increasing the infection size led to a decrease in the normalized 4-MU and 1-naphthol glucuronidation rates (results not shown).
The many documented similarities between recombinant UGTs, with or without a C-terminal His-tag and the native UGTs in HLM with respect to substrate specificity, enzyme kinetic model, and BSA effects raise the question of whether recombinant UGTs expressed in HEK293 cells are significantly better than recombinant human UGTs from baculovirus-infected insect cells in terms of the ratio of active to inactive UGTs. Although this issue has not yet been tested in UGTs expressed in HEK293 cells, it might be possible that the absence of a very strong promoter in the HEK293 expression system, similar to the very late viral promoters that are used in baculovirus-infected insect cells, helps to avoid the accumulation of inactive UGTs in HEK293 cells. However, such a possibility remains to be explored.
In conclusion, our study highlights limitations in determining the accurate turnover rate for most recombinant UGT preparations. The current results, together with related studies discussed above, strongly suggest that there are no major differences between active UGT expressed in baculovirus-infected insect cells and the enzyme from HEK293 cells or the “native” UGT in human liver microsomes preparations.
The results of a new article by Oda et al. (2012) concerning the commercial UGT1A9 preparation, UGT1A9 Supersomes, shown in Fig. 2 of that article, strongly support our conclusion that high-level expression of recombinant UGTs, at least in baculovirus-infected insect cells, leads to the accumulation of inactive enzyme.
Authorship Contributions
Participated in research design: Zhang and Finel.
Conducted experiments: Zhang, Patana, and Ikushiro.
Contributed new reagents or analytic tools: Patana and Ikushiro.
Performed data analysis: Zhang and Finel.
Wrote or contributed to the writing of the manuscript: Zhang, Mackenzie, Goldman, and Finel.
Acknowledgments
We thank Johanna Mosorin for skillful assistance in the preparation of recombinant UGTs.
Footnotes
This work was supported by the Sigrid Juselius Foundation, Finland; the Academy of Finland [Grant 1252206]; and the National Health and Medical Research Council of Australia.
Article, publication date, and citation information can be found at http://dmd.aspetjournals.org.
ABBREVIATIONS:
- UGT
- UDP-glucuronosyltransferase
- UDPGA
- UDP-glucuronic acid
- HEK
- human embryonic kidney
- 4-MU
- 4-methylumbelliferone
- HRP
- horseradish peroxidase
- HLM
- human liver microsomes
- DMSO
- dimethyl sulfoxide
- HPLC
- high-performance liquid chromatography
- UPLC
- ultraperformance liquid chromatography
- AZT
- zidovudine
- BSA
- bovine serum albumin.
- Received April 5, 2012.
- Accepted July 10, 2012.
- Copyright © 2012 by The American Society for Pharmacology and Experimental Therapeutics


