


Abstract
Background: Although cancer cells appear to maintain the machinery for intrinsic apoptosis, defects in the pathway develop during malignant transformation, preventing apoptosis from occurring. How to specifically induce apoptosis in cancer cells remains unclear. Methods: We determined the apoptosome activity and p53 status of normal human cells and of lung, colon, stomach, brain, and breast cancer cells by measuring cytochrome c–dependent caspase activation and by DNA sequencing, respectively, and we used COMPARE analysis to identify apoptosome-specific agonists. We compared cell death, cytochrome c release, and caspase activation in NCI-H23 (lung cancer), HCT-15 (colon cancer), and SF268 (brain cancer) cells treated with Triacsin c, an inhibitor of acyl-CoA synthetase (ACS), or with vehicle. The cells were mock, transiently, or stably transfected with genes for Triacsin c–resistant ACSL5, dominant negative caspase-9, or apoptotic protease activating factor-1 knockdown. We measured ACS activity and levels of cardiolipin, a mitochondrial phospholipid, in mock and ACSL5-transduced SF268 cells. Nude mice carrying NCI-H23 xenograft tumors (n = 10) were treated with Triacsin c or vehicle, and xenograft tumor growth was assessed. Groups were compared using two-sided Student t tests. Results: Of 21 p53-defective tumor cell lines analyzed, 17 had higher apoptosome activity than did normal cells. Triacsin c selectively induced apoptosome-mediated death in tumor cells (caspase activity of Triacsin c–treated versus untreated SF268 cells; means = 1020% and 100%, respectively; difference = 920%, 95% CI = 900% to 940%; P <.001). Expression of ACSL5 suppressed Triacsin c–induced cytochrome c release and subsequent cell death (cell survival of Triacsin c–treated mock- versus ACSL5-transduced SF268 cells; means = 40% and 83%, respectively; difference = 43%, 95% CI = 39% to 47%; P <.001). ACS was also essential to the maintenance of cardiolipin levels. Finally, Triacsin c suppressed growth of xenograft tumors (relative tumor volume on day 21 of Triacsin c–treated versus untreated mice; means = 4.6 and 9.6, respectively; difference = 5.0, 95% CI = 2.1 to 7.9; P = .006). Conclusions: Many p53-defective tumors retain activity of the apoptosome, which is therefore a potential target for cancer chemotherapy. Inhibition of ACS may be a novel strategy to induce the death of p53-defective tumor cells.
Apoptosis is a genetically regulated process with central roles in tissue development and homeostasis ( 1 ) . Apoptosis signals are altered in many human diseases, including cancer. Various types of stress induce apoptosis through the intrinsic pathway, which involves the release of cytochrome c from the mitochondria ( 2 ) . The liberated cytochrome c binds to apoptotic protease activating factor-1 (apaf-1), which subsequently assembles into an oligomer termed the apoptosome. The apoptosome recruits and activates caspase-9, which subsequently activates a proteolytic cascade that ultimately results in cell death. The p53 tumor suppressor plays an essential role in transducing the apoptosis signal. p53 is a transcription factor that regulates the expression of multiple apoptosis-inducing proteins that act on the mitochondria, such as bax, noxa, puma, and p53AIP1 ( 3 ).
In cancer cells, excessive mitotic signals, including oncogene-dependent signals and signals that trigger cell cycle progression, activate the intrinsic pathway ( 4 ) . For example, the expression of both apaf-1 and caspases is transcriptionally upregulated by E2F, a transcription factor that is essential for cell cycle progression that is often upregulated in cancer cells ( 5 , 6 ), and the overexpression of apaf-1 and caspases in tumors has been reported ( 7 , 8 ) . Another cell cycle factor, cyclin D3, also activates caspase-2 ( 9 ) . These observations indicate that the intrinsic apoptosis machinery is active in tumors and that it could be a target for selectively killing cancer cells. Indeed, recent reports have shown that tumor cells, but not normal cells, are preferentially sensitive to agents that directly activate the apoptosome ( 10 ) or target the mitochondria ( 11 ) .
In contrast to the notion that the intrinsic apoptosis pathway is active in cancer cells, proapoptotic signals generated by an oncogene, by DNA damage, or by depletion of survival factors can also act as selection pressures, and, to acquire a survival advantage, cells develop defects in the apoptosis pathway during malignant transformation ( 12 , 13 ) . In fact, the p53 tumor suppressor is inactivated in more than half of human tumors. Recent studies further indicate that defects in the apoptosome can promote oncogenic transformation ( 12 , 14 ) , although animal studies have shown that apaf-1 and caspase-9 are not tumor suppressors in myc-induced lymphomagenesis ( 15 ) . Apoptosome inactivation has been documented in non–small-cell lung carcinoma, melanoma, ovarian carcinoma, and leukemia cell lines ( 12 , 16 ) . Thus, apoptosis pathways are altered in some tumors, but the alteration pattern is still not clear.
In this study, we examined the status of p53, by DNA sequencing and of apoptosome activity, by measuring cytochrome c–dependent caspase activation in both human cancer cell lines and in normal human cells. We studied cancer cells that had lost p53 function but retained apoptosome function and used COMPARE analysis to identify tumor-specific, apoptosome-activating compounds. We further examined the mechanism by which one identified compound, Triacsin c, triggers the apoptosome-mediated pathway by measuring levels of cardiolipin, a phospholipid that is localized in the mitochondria and has been implicated in apoptosis regulation ( 17 ) , and cardiolipin function using 10-N-nonyl-acridine orange (NAO), a small compound that specifically binds to cardiolipin ( 18 ) . We also measured the effects of Triacsin c on the growth of xenograft lung tumors in nude mice.
M ATERIALS AND M ETHODS
Materials
Normal cell lysates were prepared from tissues obtained during surgical resection or purchased from BioChain Institute, Inc. (San Leandro, CA). Written informed consent was obtained from those patients (or their guardians) whose tissue was used in the analysis. Triacsin c was isolated as described previously ( 19 ) or purchased from Sigma (St. Louis, MO). SN-38 was a kind gift of Yakult (Tokyo, Japan). NAO ( 18 ) was purchased from Molecular Probes (Eugene, OR).
Cell Lines, Cell Culture, and Treatment
The cancer cell lines analyzed in this study were all of human origin and were used in anticancer drug screening programs at the Japanese Foundation for Cancer Research (JFCR) ( Table 1 ). In addition, we used the p53 wild-type human cancer cell lines LoVo and LS-174T (colon), NUGC4 (stomach), YMB-1 and Mrk-nu1 (breast), and A172 and KG1C (brain). Cell lines were obtained from the National Cancer Institute (Frederick, MD) ( 20 ) , purchased from the American Type Culture Collection (Manassas, VA), or obtained from the Health Science Research Resources Bank (Osaka, Japan). All cancer cell lines were cultured in RPMI 1640. Normal human adult cell lines TIG108, TIG109, ASF4–1, and CCD33Co were cultured in modified Eagle medium, and the normal human adult cell line TIG114 was cultured in Eagle's basal medium. Human embryonic cell lines 293T and TIG3 were cultured in Dulbecco's modified Eagle medium or RPMI 1640, respectively. Murine fibroblast PA317 cells were grown in Dulbecco's modified Eagle medium. All culture media were supplemented with 10% heat-inactivated fetal bovine serum and 100 μg/mL of kanamycin, and cell lines were cultured in a humidified atmosphere of 5% CO 2 and 95% air at 37 °C.
Apoptosome activity and p53 status in human cancer cells and normal human cells *
| Cells | Apoptosome activity, RFU (95% CI) | p53 status |
|---|---|---|
| Lung cancer | ||
| NCI-H23 | 840 (807 to 873) | Mt(M246I) |
| NCI-H522 | 1900 (1817 to 1983) | Mt(P191del) |
| DMS273 | 88 (79 to 97) | Mt(G245C) |
| DMS114 | 2300 (2192 to 2408) | Mt(R213X) |
| NCI-H460 | 170 (162 to 178) | Wild |
| A549 | 30 (24 to 36) | Wild |
| Colon cancer | ||
| HCC-2998 | 870 (823 to 917) | Mt(R213X) |
| KM-12 | 1700 (1641 to 1759) | Mt(H179R) |
| HT-29 | 860 (805 to 915) | Mt(R273H) |
| HCT-15 | 1700 (1648 to 1752) | Mt(S241F) |
| LoVo | 6.0 (3.1 to 8.9) | Wild |
| LS-174T | 280 (260 to 300) | Wild |
| HCT-116 | 110 (101 to 119) | Wild |
| Stomach cancer | ||
| St-4 | 820 (813 to 827) | Mt(Y205del) |
| MKN-1 | 590 (569 to 611) | Mt(V143A) |
| MKN-7 | 350 (330 to 370) | Mt(I251L) |
| MKN-28 | 25 (1 to 49) | Mt(I251L) |
| MKN-74 | 97 (92 to 102) | Mt(I251L) |
| MKN-45 | 100 (91 to 109) | Wild |
| NUGC4 | 22 (16 to 28) | Wild |
| Brain cancer | ||
| U251 | 1400 (1273 to 1527) | Mt(R273H) |
| SF268 | 1600 (1424 to 1776) | Mt(R273H) |
| SF295 | 1300 (1273 to 1327) | Mt(R248Q) |
| SNB-75 | 450 (433 to 467) | Mt(E258L) |
| SNB-78 | 520 (492 to 548) | Mt(184-5del, P223A) |
| A172 | 270 (269 to 271) | Wild |
| KG1C | 6.2 (6.0 to 6.4) | Wild |
| Breast cancer | ||
| BSY-1 | 110.2 (109.8 to 110.6) | Mt(R248Q) |
| HBC-5 | 430 (415 to 445) | Mt(C242F) |
| HTB-26 | 2300 (2218 to 2382) | Mt(R280L) |
| HBC-4 | 16 (7 to 25) | Wild |
| MCF-7 | 9.3 (9.2 to 9.4) | Wild |
| YMB-1 | 21 (20 to 22) | Wild |
| Mrk-nu1 | 23 (22 to 24) | Wild |
| Normal adult cell lines | ||
| TIG108 | 240.0 (239.4 to 240.6) | n.d. |
| TIG109 | 240 (217 to 263) | n.d. |
| ASF4–1 | 88 (87 to 89) | n.d. |
| CCD33Co | 23 (22 to 24) | n.d. |
| TIG114 | 23 (22 to 24) | n.d. |
| Normal tissue cells | ||
| Lung1 | 1.1 (1.0 to 1.2) | n.d. |
| Lung2 | 1.1 (0.6 to 1.6) | n.d. |
| Lung3 | 0.9 (0.8 to 1.0) | n.d. |
| Colon1 | 9.0 (6.1 to 11.9) | n.d. |
| Colon2 | 38 (0 to 76) | n.d. |
| Colon3 | 3.0 (2.2 to 3.8) | n.d. |
| Stomach1 | 97 (96 to 98) | n.d. |
| Stomach2 | 1.0 (0.97 to 1.03) | n.d. |
| Stomach3 | 13 (9 to 17) | n.d. |
| Embryonic cell lines | ||
| 293T | 1400 (1327 to 1473) | n.d. |
| TIG3 | 890 (807 to 973) | n.d. |
Apoptosome activity = caspase activity, measured as described in Materials and Methods. The apoptosome activity data are the mean value of four independent experiments and are shown as relative fluorescence units (RFU). CI = confidence intervals. p53 status was determined by reverse transcription polymerase chain reaction and DNA sequencing ( 23 ) as in described in Materials and Methods or from previous reports ( 20 , 22 ) . wild = wild-type; Mt = mutant; del = deletion; X = termination codon; n.d. = not determined.
For cell growth assays, cells were seeded at 2 × 10 4 or 5 × 10 4 cells/mL in 96-well plates and cultured overnight before treatment. For other analyses, cells were seeded at 1 × 10 5 or 2 × 10 5 in six-well plates or 100-mm dishes and cultured overnight before treatment. For cell growth assays, cells were treated with vehicle or 4 or 8 μ M Triacsin c for 48 hours; with vehicle or 1, 2, or 4 μ M Triacsin c for 48 hours; or with vehicle or 1 μ M Triacsin c for 40 hours. For assays of caspase activity, cells were treated with vehicle or 8 μ M Triacsin c for 30 hours, and for assays of p53 expression, cells were treated with vehicle or 8 μ M Triacsin c or with 3 μ M topoisomerase I inhibitor SN-38 for 48 hours. Triacsin c and SN-38 were dissolved in dimethyl sulfoxide (vehicle) at stock concentrations of 50 m M and 2 m M , respectively, and stored at −20 °C. The stock solutions were diluted in cell culture medium before being added to cells.
Measurement of Apoptosome Activity and Drug-Activated Caspase Activity
To determine the functional status of the apoptosome-mediated apoptosis pathway in normal and cancer cells, we measured the cytochrome c-induced activation of caspases in cell lysates. Cytosolic extracts were incubated with 10 μ M cytochrome c plus 1 m M dATP for 30 minutes, and caspase activity was measured using acetyl-Asp-Glu-Val-Asp-(4-methyl-coumaryl-7-amide) (DEVD-MCA) as a substrate, as reported previously ( 21 ) . In brief, the cell extracts were incubated with 10 μ M DEVD-MCA at 37 °C for 30 minutes. The release of amino-4-methylcoumarin was monitored with a spectrofluorometer (F-2500; Hitachi, Tokyo, Japan) using an excitation wavelength of 380 nm and an emission wavelength of 460 nm. For drug-treated cells, lysates were prepared in standard buffer (10m M Tris-HCl, pH 8.0, 5m M dithiothreitol [DTT], and 1 m M phenylmethylsulfonyl fluoride [PMSF]) ( 16 ) , and caspase activity was measured as described above.
Assessment of p53 Genetic Status
p53 status of NCI-H23, NCI-H522, NCI-H460, A549, HCC-2998, KM-12, HT-29, HCT-15, LoVo, LS-174T, HCT-116, NUGC4, U251, SF268, SF295, SNB-75, A172, KG1C, HTB-26, MCF-7, YMB-1, and Mrk-nu1 cells has been reported previously ( 20 , 22 ) . We determined the p53 status of DMS273, DMS114, St-4, MKN-1, MKN-7, MKN-28, MKN-45, MKN-74, HBC-4, BSY-1, HBC-5, and SNB-78 cells using the method of Takahashi et al. ( 23 ) . In brief, we amplified p53 cDNA from the cell lines using reverse transcription polymerase chain reaction (RT-PCR) and then cloned it into the pSS16 plasmid vector. The p53 cDNA was sequenced with a Dyedeoxy terminator kit (Perkin-Elmer, Urayasu, Japan) on an ABI 373A automated sequencer (Applied Biosystems, Urayasu, Japan) according to the manufacturer's protocol.
In Silico COMPARE Analysis
The in silico COMPARE analysis was carried out as described by Yamori et al. ( 24 , 25 ) . COMPARE analysis is a calculation method to compare the pattern of enzyme activity or drug sensitivity of a test compound in a set of cancer cell lines with that of known compounds. The pattern of enzyme activity or drug sensitivity is described as a mean graph and is called a fingerprint. We have developed a database of chemosensitivities of cancer cell lines to nearly 2500 compounds, including antitumor agents and inhibitors of signal transduction.
Cell Growth Assays
The sensitivity of cell lines to Triacsin c was evaluated using the 3-( 4 , 5 -dimethylthiazol-2-yl)-5-(3-carboxymethoxyphenyl)-2-(4-sulfophenyl)-2H-tetrazolium (MTS) method ( 16 ) . In brief, we used CellTiter 96AQ ueous One Solution Cell Proliferation Assay Kit (Promega, Tokyo, Japan). Drug-treated cells (100 μL/well in 96-well plates) were treated with 20 μL of MTS in phenazine ethosulfate solution, and the mixture was incubated at 37 °C for 30 to 60 minutes. Optical density at 490 nm was measured. Four independent experiments were performed for each cell line assayed.
Construction of Vectors
Full-length cDNAs for human caspase-9 and acyl-CoA synthetase 5 (ACSL5) were amplified by PCR. A dominant-negative form of caspase-9 (Dncaspase-9) ( 14 ) was generated by mutagenesis ( 21 ) using the QuikChange site-directed mutagenesis kit (Stratagene, La Jolla, CA), according to the manufacturer's instructions. Dncaspase-9 was cloned into the pcDNA3 vector (Invitrogen, San Diego, CA) to generate pcDNA3-Dncaspase-9-FLAG, which encodes a C-terminal FLAG epitope- agged chimeric protein. The ACSL5 gene was cloned into the pFLAG-CMV vector (Kodak, New Haven, CT) to generate pFLAG-CMV-ACSL5, which encodes a C-terminal FLAG epitope-tagged chimeric protein. For retrovirus-mediated gene transfer, Dncaspase-9-FLAG and ACSL5-FLAG were excised from pcDNA3-Dncaspase-9-FLAG and pFLAG-CMV-ACSL5, respectively, and were subcloned into the pHa-IRES-dihydrofolate reductase (DHFR) vector that we constructed previously ( 26 ) . The resulting vectors, pHa-Dncaspase-9-FLAG-IRES-DHFR and pHa-ACSL5-FLAG-IRES-DHFR, encoded C-terminal FLAG epitope-tagged chimeric proteins that included DHFR as a selection marker.
Transient Transfection, Retrovirus-Mediated Gene Transfer, and Inhibition of apaf-1 Expression by Small Interfering (si)RNA
To examine the roles of ACS and caspase-9 in Triacsin c–induced cell death, we first transiently transfected NCI-H23 and HCT15 cells with vectors containing chimeric ACSL5 or Dnacaspase-9 proteins and then used retrovirus-mediated gene transfer of these vectors to SF268 cells to generate stably-expressing cells.
Transient transfection was performed using Lipofectamine2000 (Invitrogen, San Diego, CA), according to the manufacturer's instructions. We co-transfected cells with pcDNA3-Dncaspase-9-FLAG and pcDNA3-enhanced green fluorescent protein (EGFP), pFLAG-CMV-ACSL5 and pcDNA3-EGFP, or their empty vectors (mock) and pcDNA3-EGFP ( 27 ) on day 1. After Triacsin c treatment, on day 2, cell viability was determined by counting EGFP-positive cells in samples from each transfected population.
For retrovirus-mediated gene transfer, PA317 cells were transfected with pHa-Dncaspase-9-FLAG-IRES-DHFR, pHa-ACSL5-FLAG-IRES-DHFR, or pHa-IRES-DHFR (mock), selected with methotrexate (MTX), and the conditioned media of the MTX-resistant PA317 cells was added to SF268 cells, which have high retrovirus infection efficiency, as described previously ( 26 ) . After retrovirus-mediated gene transfer and subsequent MTX selection (100 ng/mL), stably transduced cells were established.
siRNAs were transiently introduced into the cells with Lipofectamine2000, according to the manufacturer's instructions. The siRNA to human apaf-1 (mixture of the following four duplexes: 5′-GGACAAAUGUAUCUUUCUAUU-3′, 5′-GAACUCUGCU GUAAUGUUAUU-3′, 5′-GAACAGGUCAGAUUGAUUAUU-3′, 5′-CGACAGCCAUUUCCUAAUAUU-3′) and a nonspecific control duplex (5′-ACUCUAUCUGCACGCUGACUU-3′) were produced by Dharmacon Inc. (Chicago, IL). Twelve hours after the siRNAs were introduced, cells were reseeded at 2 × 10 4 cells/mL in 96-well plates and were then treated with vehicle or 2 μ M Triacsin c for 48 hours. Sensitivity of cells to the agent was evaluated using the MTS method, as described above.
Measurement of Acyl-CoA Synthetase Activity
Total cell lysates from mock- or ACSL5-transduced SF268 cells (treated with vehicle or 4 μ M Triacsin c for 48 hours) were prepared by homogenizing cells in buffer A (20 m M HEPES-KOH, pH 7.5, 10 m M KCl, 1.5 m M MgCl 2 , 1 m M EDTA, 1 m M DTT, and 0.1 m M PMSF) ( 16 ) , and the acyl-CoA synthetase activity was assayed as described previously ( 28 ) . In brief, the assay mixture contained 1.2 μmol of MgCl 2 , 5 μmol of ATP, 3 μmol of KF, 0.1 μmol of coenzyme A, 3 μmol of 2-mercaptoethanol, and 0.03 μmol of palmitic acid containing 0.1 μCi of [ 14 C]-palmitic acid, in a total volume of 150 μL. The reaction was initiated by adding 100 μL of cell lysate and terminated after 5 minutes at 37 °C by adding 2.25 mL of isopropanol-heptane-1 M H 2 SO 4 (40:10:1 by volume). Then 1.5 mL of heptane and 1 mL of water were added, and the upper layer was discarded. The lower layer was washed twice with 2 mL of heptane containing 8 mg palmitic acid, and 0.1 mL of sample was counted in 1 mL of scintillation cocktail, ACSII (Amersham, Tokyo, Japan).
Measurement of Cardiolipin Levels
Cardiolipin levels were measured according to the method of Hardy et al. ( 29 ) with a slight modification. Mock- or ACSL5-transduced SF268 cells were labeled for 24 hours with [ 32 P]Pi (20 μCi/mL), and lipids were extracted by adding 300 μL of CH 3 OH/CHCl 3 /phosphate-buffered saline (PBS) (10:5:4), 78 μL of CHCl 3 , and 78 μL of CHCl 3 and then by collecting the lower phase. Phospholipids were separated by thin-layer chromatography using silica gel plates K6 (Whatman, Tokyo, Japan), and individual species were identified by comigration of standards (Sigma-Aldrich Corp., St. Louis, MO). The cardiolipin level was determined quantitatively by exposure of autoradiography film to the lipid-separated thin-layer chromatography plates, followed by densitometric scanning of cardiolipin spots.
Isolation of Mitochondria and Estimation of Cytochrome c Release From Mitochondria
Mitochondria were isolated from SF268 cells, and cytochrome c release was examined as described ( 30 ) . In brief, isolated mitochondria (10 μg of protein) were incubated with NAO in a buffer containing 0.3 M mannitol, 10 m M HEPES-KOH, pH 7.4, 1 m M KPB, 0.1 m M EGTA, 0.1 m M EDTA, and 0.5 m M MgCl 2 for 3 hours at 37 °C. The mitochondria were centrifuged (20 000 × g) at 4 °C for 2 minutes. The supernatants were then separated by sodium dodecyl sulfate–polyacrylamide gel electrophoresis (SDS-PAGE) on 15–25% gradient gels, and cytochrome c was detected by Western blotting.
Western Blot Analysis
Monoclonal rat anti–human apaf-1 antibody (used at 1:300 dilution) was purchased from Alexis Biochemicals (San Diego, CA), monoclonal mouse anti–human cytochrome c antibody (used at 1:300 dilution) was purchased from PharMingen (San Diego, CA), monoclonal mouse anti–human tubulin antibody (used at 1:1000 dilution) and monoclonal mouse anti-FLAG antibody (used at 1:300 dilution) were purchased from Sigma, and rabbit polyclonal anti–human p53 antibody (used at 1:300 dilution) was purchased from Santa Cruz Biotechnology, Inc. Western blots were performed as described previously ( 27 ) . In brief, cell lysates were subjected to SDS-PAGE (4–20% or 15–25% gradient gel) and then transferred to a nitrocellulose membrane. Membranes were blocked at room temperature for 1 hour in blocking buffer (5% skim milk and 0.1% Tween-20 in PBS), incubated with the antibodies diluted as described above in blocking buffer at room temperature for 2 hours, washed three times in washing buffer (0.1 % Tween-20 in PBS), and incubated with anti–mouse, anti–rat, or anti–rabbit immunoglobulin peroxidase-conjugated antibodies (1:500 dilution; Amersham, Tokyo, Japan) at room temperature for 1 hour and washed six times with washing buffer. The bands were then visualized using ECL Western Blotting Detection Reagents (Amersham, Tokyo, Japan).
Antitumor Activity Against Xenografts
NCI-H23 cells were implanted subcutaneously in the right flank region of 9-week-old BALB/cAJcl-nu nude mice (n = 10) (Charles River Japan, Inc., Kanagawa, Japan) ( 16 ) . Therapeutic experiments were started approximately 10 days after implanting when tumors reached 50–150 mm 3 as measured with calipers (day 0). Triacsin c was administered by intratumoral injection in 40 μL of saline (30 mg · kg −1 · day −1 ) daily on days 0, 1, and 2. Control mice (n = 5) received the same volume of saline as experimental mice (n = 5). The length (L) and width (W) of the tumor were measured, and the tumor volume (TV) was calculated as TV = (LXWXW)/2. Tumor growth was measured for 21 days. All animal procedures were performed in the animal experiment room of the Japanese Foundation for Cancer Research (JFCR) using protocols approved by the JFCR Animal Care and Use Committee.
Statistical Analysis
All mean values and 95% confidence intervals (CIs) from at least triplicate samples were calculated with Microsoft Excel 98 software (Microsoft, Seattle, WA). Statistical significance of differences between two groups was determined with a two-sided Student t test using StatView software, version 4.5 (SAS Institute Inc., Cary, NC). Statistical significance of differences between two groups was also determined with Mann-Whitney's U test (nonparametric test) using StatView software, version 4.5. We confirmed that all the differences determined as being statistically significant with Student's t test were also statistically significant with Mann-Whitney's U test ( P <.05, data not shown). Additionally, one-way analysis of variance with Fisher's test was also done by use of StatView software to confirm the statistical significance of differences between the apoptosome activity of normal and p53-mutant tumor cells. We calculated the degree of similarity between drug sensitivity (−log [drug concentration resulting in a 50% reduction in cell growth {GI 50 } value of Triacsin c]) and apoptosome activity using Pearson's correlation coefficient using StatView software. For all statistical tests, P values of <.05 were considered statistically significant.
R ESULTS
Apoptosome-Mediated Pathway in p53-Defective Tumors
To determine if the intrinsic pathway of apoptosis was functional in cancer cells, we measured the apoptosome activity (cytochrome c–induced activation of caspases in cell lysates) of 34 human cancer cell lines, as well as in normal human adult tissue–derived cells, human adult cell lines, and human embryonic cell lines ( Table 1 ). Most human tumor cell lines possessed elevated apoptosome activity compared with normal cells, although in some tumor cell lines, low apoptosome activity was observed ( Fig. 1, A ). Tumor cell lines had statistically significantly higher apoptosome activity than did normal tissue-derived cells (mean apoptosome activity of tumor cells versus that of normal tissue–derived cells; means = 626 relative fluorescence units [RFU] versus 18 RFU, respectively; difference = 608 RFU, 95% CI = 120 to 1097; P = .016), which is in agreement with previous reports that show elevated expression of apoptosome components in cancers ( 7 , 8 ) . In contrast with normal adult cells, which showed low apoptosome activity, embryonic cell lines showed high activity ( Table 1 ). This higher activity may reflect the rapid growth of embryonic cells.
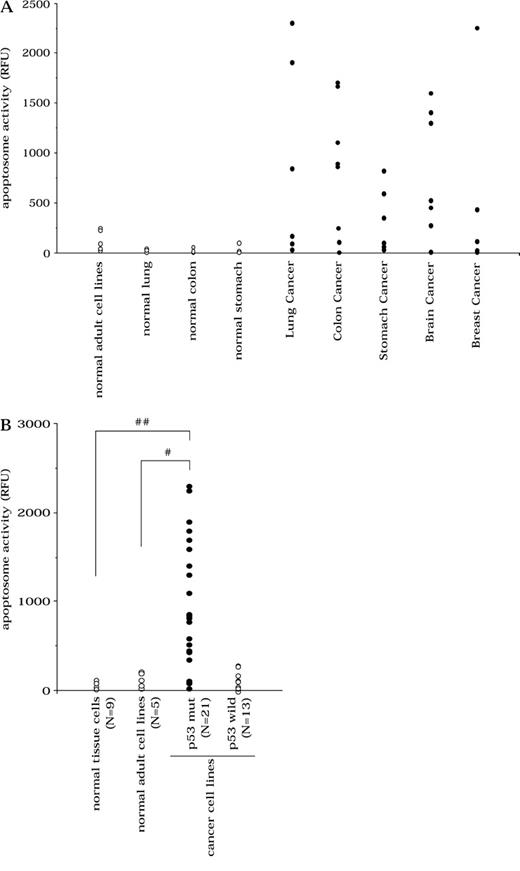
Apoptosome activity in human cancer cells. A ) Apoptosome activity in cancer cell lines compared with normal cell lines. B ) Apoptosome activity in p53-defective tumor cell lines. Cell extracts were incubated with cytochrome c and dATP and then with acetyl-Asp-Glu-Val-Asp-(4-methyl-coumaryl-7-amide) ( 21 ) . The release of amino-4-methylcoumarin was monitored at 460 nm with a spectrofluorometer (F-2500; Hitachi, Tokyo, Japan). Each point represents a cell line; the activity for that line is the mean value of four independent analyses. P values (two-sided) were calculated using the Student t test. RFU = relative fluorescence units; p53 wild = p53-wild-type tumors; p53 mut = p53-mutant tumors; ##, P <.001; # P = .018.
Because recent studies indicate that defective apoptosome component proteins play a role similar to p53 loss in promoting oncogenic transformation ( 12 , 14 ) , we examined the relationship between p53 status and apoptosome activity. We observed that tumor cell lines with defective p53 retained intact downstream apoptosome activity, whereas tumor cell lines with low apoptosome activity possessed intact p53, suggesting that a complementary pattern of p53 mutation and low apoptosome activity existed ( Fig. 1, B ). Tumor cells with mutant p53 retained statistically significantly elevated apoptosome activity as compared with normal tissue–derived cells (apoptosome activity of p53-mutant tumor cells versus normal tissue–derived cells; means = 964 RFU versus 18 RFU, respectively; difference = 946 RFU, 95% CI = 442 to 1450; P <.001) or normal adult cell lines (apoptosome activity of tumor cells versus normal adult cell lines; means = 964 RFU versus 122 RFU, respectively; difference = 842 RFU, 95% CI = 155 to 1528; P = .018).
In Silico COMPARE Analysis to Identify an Agent Targeting Elevated Apoptosome Activity in Tumors
We then used in silico COMPARE analysis to identify apoptosome-directing stimuli ( 24 , 25 ) . We established a human cancer cell line panel and developed a database of their chemosensitivities to nearly 2500 compounds, including antitumor agents and inhibitors of signal transduction. Drugs were profiled according to their fingerprint patterns for differential growth inhibition. Because the drug's mode of action is related to its fingerprint ( 24 ) , the fingerprint database can be used to predict the modes of action of new compounds and to identify compounds that target molecules involved in tumor survival. Using the COMPARE analysis, we can identify compounds in our database whose fingerprints for growth inhibition show a statistical correlation with a fingerprint of another drug or an enzyme activity ( 24 ) .
For this study, we designated apoptosome activity patterns of the cell lines as apoptosome fingerprints and searched for compounds in our database whose fingerprint of growth inhibition correlated well with the apoptosome pattern ( Fig. 2, A ). By mining our database using the COMPARE algorithm ( 24 ) , several candidate compounds were identified. Triacsin c, a specific inhibitor of acyl-CoA synthetase (ACS) ( 19 ) , had the strongest correlation between apoptosome pattern and growth inhibition. ACS catalyzes the formation of acyl-CoA from fatty acid, a reaction that is involved in both the degradation of fatty acid and the synthesis of cellular lipids. Some ACS isozymes are overexpressed in cancers ( 31 , 32 ) , which suggests that they are involved in cancer cell survival, even though their precise roles are unknown. A statistical correlation was found between apoptosome activity and the log (GI 50 of Triacsin c) (Pearson's correlation efficient r = .589, P = .0019, Fig. 2, B ). Moreover, Triacsin c treatment induced a statistically significant increase in cell death of those p53-defective cell lines that had high apoptosome activity [cell survival of Triacsin c–treated versus untreated H23 cells; means = 38% (8 μ M ) or 48% (4 μ M ) versus 100% (untreated), respectively, difference = 62% (untreated − 8 μ M ) or 52% (untreated − 4 μ M ), 95% CI = 60% to 65% (untreated − 8 μ M ) or 45% to 59% (untreated − 4 μ M ), P <.001; cell survival of Triacsin c–treated versus untreated DMS114 cells; means = 38% (8 μ M ) or 38% (4 μ M ) versus 100% (untreated), respectively, difference = 62% (untreated − 8 μ M ) or 62% (untreated − 4 μ M ), 95% CI = 60% to 64% (untreated − 8 μ M ) or 59% to 64% (untreated − 4 μ M ), P <.001; cell survival of Triacsin c–treated versus untreated HCT-15 cells; means = 26% (8 μ M ) or 34% (4 μ M ) versus 100% (untreated), respectively, difference = 74% (untreated − 8 μ M ) or 66% (untreated − 4 μ M ), 95% CI = 68% to 80% (untreated − 8 μ M ) or 60% to 72% (untreated − 4 μ M ), P <.001; cell survival of Triacsin c–treated versus untreated KM-12 cells; means = 53% (8 μ M ) or 61% (4 μ M ) versus 100% (untreated), respectively, difference = 47% (untreated − 8 μ M ) or 39% (untreated − 4 μ M ), 95% CI = 40% to 54% (untreated − 8 μ M ) or 32% to 45% (untreated − 4 μ M ), P <.001; cell survival of Triacsin c–treated versus untreated SF268 cells; means = 48% (8 μ M ) or 57% (4 μ M ) versus 100% (untreated), respectively, difference = 52% (untreated − 8 μ M ) or 43% (untreated − 4 μ M ), 95% CI = 49% to 54% (untreated − 8 μ M ) or 40% to 45% (untreated − 4 μ M ), P <.001; cell survival of Triacsin c–treated versus untreated U251 cells; means = 35% (8 μ M ) or 61% (4 μ M ) versus 100% (untreated), respectively, difference = 65% (untreated − 8 μ M ) or 39% (untreated − 4 μ M ), 95% CI = 62% to 68% (untreated − 8 μ M ) or 35% to 43% (untreated − 4 μ M ), P <.001]. However, at the same dosage, Triacsin c was not cytotoxic to human normal cells with low apoptosome activity ( Fig. 2, C ).
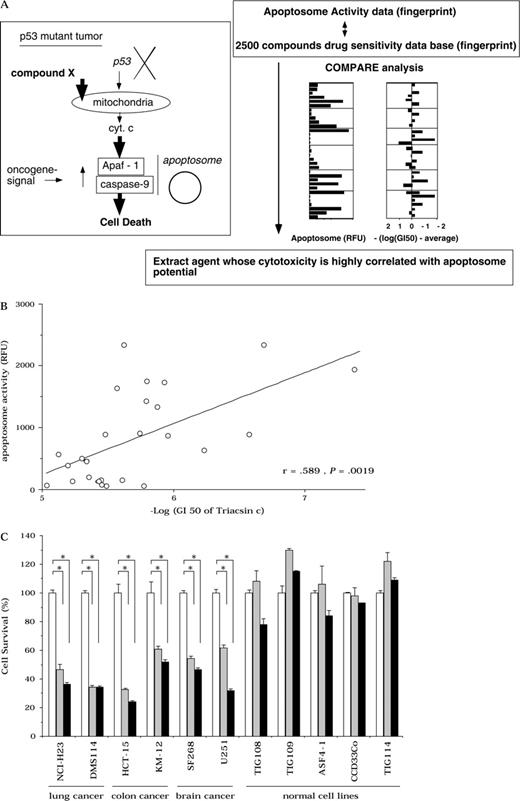
Identification of agents that target cancer cells with high apoptosome activity. A ) Strategy to identify agents that induce apoptosome-dependent death by COMPARE analysis. Cyt c = cytochrome c. B ) Pearson's correlation of apoptosome activity (RFU = relative fluorescence units) and Triacsin c sensitivity in cancer cell lines. C ) Sensitivity to Triacsin c of normal human cell lines with low apoptosome activity compared with that of p53-mutant tumor cell lines. Cells were treated with 0 ( open bars ), 4 ( hatched bars ), and 8 ( solid bars ) μ M Triacsin c for 48 hours. We used CellTiter 96AQ ueous One Solution Cell Proliferation Assay Kit (Promega, Tokyo, Japan). Data shown are the mean value of three independent experiments, and error bars show 95% confidence intervals. P values (two-sided) were calculated using the Student t test. *, P <.001.
We next examined whether Triacsin c activated the apoptosome pathway. Triacsin c induced cytochrome c release from the mitochondria, and caspase activity in treated cells was statistically significantly higher than that of untreated, untransfected NCI-H23, HCT-15, and SF268 cells (caspase activation of Triacsin c–treated versus untreated H23 cells; means = 315% versus 100%, respectively, difference = 215%, 95% CI = 209% to 221%; HCT-15 cells; means of 860% versus 100%, respectively, difference = 760%, 95% CI = 748% to 773%; SF268 cells; means = 1018% versus 100%, respectively, difference = 918%, 95% CI = 895% to 941%; P <.001; Fig. 3, A and B ). Moreover, expression of exogenous dominant negative caspase-9 statistically significantly suppressed Triacsin c–induced cytotoxicity (cell survival of Triacsin c–treated mock- versus dominant negative caspase-9–transfected H23 cells; means = 47% versus 100%, respectively, difference = 53%, 95% CI = 47% to 59%; HCT15 cells; means of 60% versus 101%, respectively, difference = 41%, 95% CI = 24% to 58%; SF268 cells; means = 78% versus 91% [2 μ M Triacsin c] or 48% versus 74% [4 μ M Triacsin c], respectively, difference = 12% or 26%, 95% CI = 11.5% to 13.0% or 24.8% to 26.2%; P <.001; Fig. 3, C ).
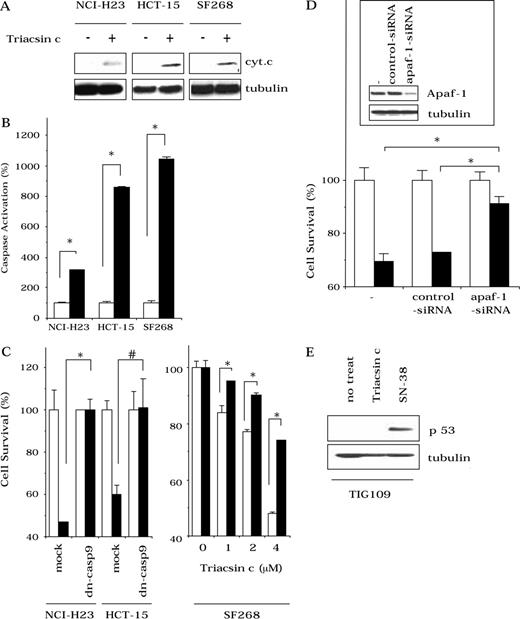
Apoptosome-mediated cell death after treatment with Triacsin c, after transfection with dominant negative caspase-9 (dn-casp9), and after apaf-1 knockdown. For A ) cytochrome c release and B ) caspase activation assays, human lung cancer NCI-H23, human colon cancer HCT-15, and human glioma SF268 cells were treated with 0 μM ( open bars ) or 8 μ M ( solid bars ) Triacsin c for 30 hours. Cytochrome c release was detected by Western blot using a monoclonal mouse anti–human cytochrome c antibody (PharMingen, San Diego, CA). Total protein loading was evaluated by blotting with a monoclonal mouse anti–human tubulin antibody (Sigma, St. Louis, MO). Caspase activity was measured using acetyl-Asp-Glu-Val-Asp-(4-methyl-coumaryl-7-amide) as a substrate. C ) Mock-transfected or dominant negative-caspase 9-transfected NCI-H23 and HCT-15 cells were treated with 0 ( open bars ) μ M or 1 ( solid bars ) μ M Triacsin c for 40 hours. Mock-transfected ( open bars ) or dominant negative-caspase 9-transfected ( solid bars ) SF268 cells were treated with 0, 1, 2, or 4 μ M Triacsin c for 48 hours. Transient transfection of NCI-H23 and HCT-15 cells was performed using Lipofectamine2000 (Invitrogen, San Diego, CA). In SF268 cells, stably transduced cells were established by retrovirus-mediated gene transfer, using retrovirus vectors, pHa-Dncaspase-9-FLAG-IRES-DHFR, or pHa-IRES-DHFR (mock). Sensitivity of cells to Triacsin c was evaluated using the CellTiter 96AQ ueous One Solution Cell Proliferation Assay Kit (Promega, Tokyo, Japan), and optical density at 490 nm was measured. D ) Ninety-six hours after SF268 cells were transfected with small interfering (si) RNA, cytosolic fractions were prepared to examine apaf-1 expression by Western blot using a monoclonal rat anti–human apaf-1 antibody (Alexis Biochemicals, San Diego, CA), or cells were treated with 0 ( open bars ) μ M or 2 ( solid bars ) μ M Triacsin c for 48 hours. Data shown are the mean values of three independent experiments, and error bars show 95% confidence intervals. P values (two-sided) were calculated using the Student t test (*, P <.001; #, P =.0024. E ) p53 expression in normal human TIG109 cells as determined by Western blot with rabbit polyclonal anti–human p53 antibody (Santa Cruz Biotechnology, San Cruz, CA). Total protein loading was evaluated by blotting with a monoclonal mouse anti–human tubulin antibody. Cells were untreated (no treat) or treated with 8 μ M Triacsin c or with 3 μ M topoisomerase I inhibitor SN-38 for 48 hours.
To further determine whether Triacsin c was acting specifically on the apoptosome, we used siRNA to knock down apaf-1, the main apoptosome component. Apaf-1 knockdown statistically significantly inhibited cell death (cell survival of Triacsin c–treated control versus apaf-1 siRNA-transfected cells; means = 70% [untransfected] or 73% [control siRNA-transfected] versus 91%, respectively, difference = 21% or 18%, 95% CI = 17% to 26% or 15% to 21%; P <.001; Fig. 3, D ). In addition, in normal TIG109 cells, Triacsin c did not induce p53 expression, whereas the topoisomerase I inhibitor SN-38 induced p53 accumulation ( Fig. 3, E ).
Involvement of ACS in Tumor Cell Survival and the Maintenance of Cardiolipin Level
To determine the biologic significance of Triacsin c–mediated ACS inhibition in cell death, we expressed ACSL5, a Triacsin c–resistant ACS isozyme ( 33 ) , in NCI-H23, HCT-15, and SF268 cancer cells ( Fig. 4, A ), which restored the ACS activity that decreased with Triacsin c treatment. The expression of ACSL5 statistically significantly inhibited Triacsin c–induced cell death (cell survival of Triacsin c–treated mock- versus ACSL5-transfected H23 cells; means = 51% versus 114%, respectively, difference = 63%, 95% CI = 54% to 71%; HCT15 cells; means = 67% versus 102%, respectively, difference = 35%, 95% CI = 28% to 42%; P <.001; Fig. 4, B , left). Retrovirus-mediated gene transfer confirmed that the stable expression of ACSL5 prevented Triacsin c–induced decreased ACS activity (ACS activity of Triacsin c–treated mock- versus ACSL5-transduced SF268 cells; means = 41% versus 165%, respectively, difference = 124%, 95% CI = 120% to 128%, P <.001; Fig. 4, D ) and strongly inhibited cell death (cell survival of Triacsin c–treated mock- versus ACSL5-transduced SF268 cells; means = 76% versus 91% (2 μ M Triacsin c) or 40% versus 83% (4 μ M Triacsin c), respectively, difference = 15% or 43%, 95% CI = 14% to 16% or 39% to 47%; P <.001; Fig. 4, B , right; Fig. 4, C ). Moreover, the expression of ACSL5 suppressed cytochrome c release and subsequent caspase activation (caspase activation of Triacsin c–treated mock- versus ACSL5-transduced SF268 cells; means = 705% versus 95% (24 hours) or 7780% versus 740% (48 hours), respectively, difference = 610% or 7040%, 95% CI = 587% to 633% or 6900% to 7100%; P <.001; Fig, 4, E and F ).
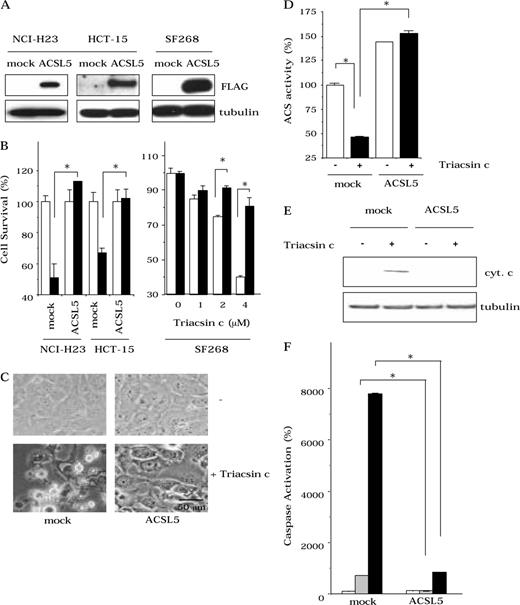
Involvement of acyl-CoA synthetase (ACS) in the retention of cytochrome c in the mitochondria. A ) The expression of FLAG epitope-tagged acyl-CoA synthetase 5 (ACSL5) in transfected cells by Western blot with monoclonal mouse anti-FLAG antibody (Sigma, St. Louis, MO). Total protein loading was evaluated by blotting with a monoclonal mouse anti–human tubulin antibody (Sigma). B ) Cell death after Triacsin c treatment. Mock-transfected or ACSL5-transfected NCI-H23 and HCT-15 cells were treated with 0 ( open bars ) μ M or 1 ( solid bars ) μ M Triacsin c for 40 hours. In SF268 cells, mock-transduced ( open bars ) or ACSL5-transduced ( solid bars ) cells were treated with 0 μ M , 1 μ M , 2 μ M , or 4 μ M Triacsin c for 48 hours. We used CellTiter 96AQ ueous One Solution Cell Proliferation Assay Kit (Promega, Tokyo, Japan), and optical density at 490nm was measured. C ) Apoptotic morphologic changes following Triacsin c treatment in mock-transduced and ACSL5-transduced SF268 cells. D ) ACS activity following Triacsin c treatment in mock-transduced and ACSL5-transduced SF268 cells. The ACS assay was performed as described previously ( 28 ) and as in Materials and Methods. E ) Cytochrome c release as measured by Western blot using a monoclonal mouse anti–human cytochrome c antibody (PharMingen, San Diego, CA). Total protein loading was evaluated by blotting with a monoclonal mouse anti–human tubulin antibody (Sigma, St. Louis, MO) and F ) caspase activation in mock-transduced and ACSL5-transduced SF268 cells. Caspase activity was measured by incubating with 10 μ M acetyl-Asp-Glu-Val-Asp-(4-methyl-coumaryl-7-amide) and measuring the release of amino-4-methylcoumarin at 460 nm using a spectrofluorometer (F-2500; Hitachi, Tokyo, Japan). SF268 cells were untreated or treated with 4 μ M Triacsin c for 36 hours ( C ), for 24 hours ( D,E ) or for 0 ( open bars ), 24( hatched bars ) and 48 ( solid bars ) hours ( F ). Data are the mean values of three independent experiments, and error bars show 95% confidence intervals. P values (two-sided) were calculated using the Student t test (*, P <.001).
Several lines of evidence indicate that cardiolipin, a mitochondrial phospholipid, interacts with cytochrome c and is involved in retaining cytochrome c in the mitochondria ( 17 ) . Because acyl-CoA is required for phospholipid biosynthesis, we examined whether the cardiolipin level could be modified by ACS inhibition. The total phospholipid level in untransfected SF268 cells decreased gradually after ACS inhibition by Triacsin c (total phospholipid level of Triacsin c–treated versus untreated mock-transfected cells; means = 75.5% versus 100%, respectively, difference = 24.5%, 95% CI = 23.7% to 25.3%, P <.001; Fig. 5, A ), and the cardiolipin level decreased statistically significantly. Cardiolipin levels were restored upon ACSL5 expression (cardiolipin level of Triacsin c–treated versus untreated mock-transfected cells; means = 63% versus 100%, respectively, difference = 37%, 95% CI = 24% to 50%, P = .0013 for 24 hours of treatment; means = 36% versus 100%, respectively, difference = 64%, 95% CI = 58% to 70%; P <.001 for 48 hours of treatment; Fig. 5, B ).
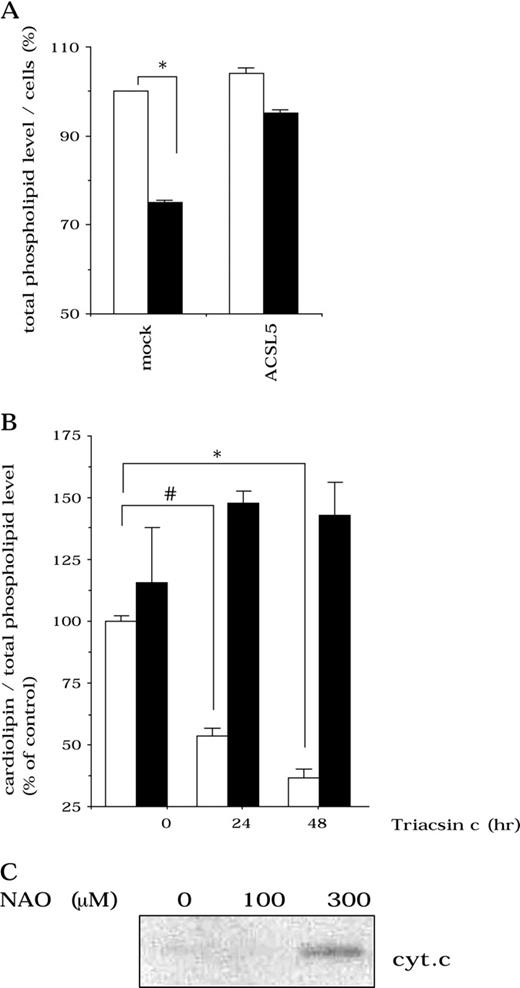
Involvement of cardiolipin in mitochondrial cytochrome c release. A ) Change in total phospholipid level after Triacsin c treatment. Mock-transduced or ACSL5-transduced SF268 cells were left untreated ( open bars ) or treated with 4 μ M Triacsin c ( solid bars ) for 24 hours. Total phospholipid levels were measured as described in Materials and Methods. B ) Change in cardiolipin content per total phospholipid after Triacsin c treatment. Mock-transduced ( open bars ) or ACSL5-transduced ( solid bars ) SF268 cells were left untreated or treated with 4 μ M Triacsin c for 24 and 48 hours. Data shown are the mean value of three independent experiments, and error bars show 95% confidence intervals. P values (two-sided) were calculated using the Student t test. *, P <.001; #, P = .0013. C ) Cytochrome c release from isolated mitochondria following 10-N-nonyl-acridine orange (NAO) treatment. Mitochondria were isolated from SF268 cells as described ( 30 ) and treated as described in Materials and Methods. Cytochrome c was detected by Western blot using a monoclonal mouse anti–human cytochrome c antibody (PharMingen, San Diego, CA).
To determine the link between cardiolipin levels and cytochrome c release, we tested the effect of NAO on mitochondria isolated from untransfected SF268 cells. NAO binds specifically to cardiolipin, preventing it from interacting with its binding proteins ( 18 ) . After treatment with NAO, cytochrome c was released from the mitochondria ( Fig. 5, C ). Thus, cardiolipin is involved in cytochrome c release.
In Vivo Antitumor Activity of Triacsin c Against Human Cancer Xenografts
To evaluate the role of ACS in tumor cell survival in vivo, we inoculated nude mice with NCI-H23 human lung cancer cells. We used this line because the cells have high apoptosome activity and grow stably in nude mice. Once tumors reached 50–150 mm 3 , they were treated with Triacsin c. Triacsin c statistically significantly inhibited the growth of tumor xenografts from day 7 to 21 (relative tumor volume of Triacsin c–treated versus untreated group; means = 1.6 versus 2.2 (day 7), 2.1 versus 3.6 (day 11), 2.8 versus 5.6 (day 14), 3.7 versus 7.9 (day 18), and 4.6 versus 9.6 (day 21), respectively; difference = 0.6 (day 7), 1.5 (day 11), 2.8 (day 14), 4.2 (day 18), and 5.0 (day 21); 95% CI = 0.052 to 1.10 (day 7), 0.32 to 2.6 (day 11), 0.90 to 4.86 (day 14), 1.4 to 6.8 (day 18), and 2.1 to 7.9 (day 21); P = .0359 (day 7), .0207 (day 11), .0118 (day 14), .0098 (day 18), and .0059 (day 21); Fig. 6 , upper panel), compared with tumors in untreated mice. We observed no decrease in body weight of the Triacsin c–treated mice compared with that of untreated mice throughout these experiments ( Fig. 6 , lower panels).
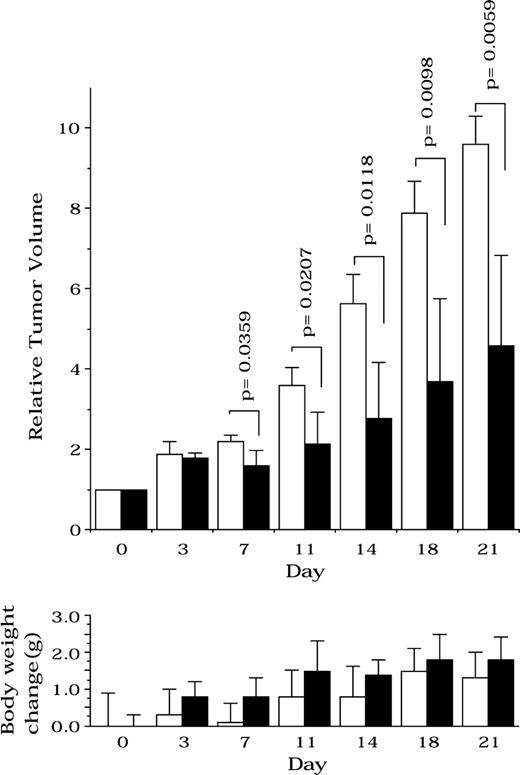
Effect of acyl-CoA synthetase (ACS) inhibitor on tumor growth and body weight change in nude mice bearing human cancer xenografts. Therapeutic experiments were started (day 0) when tumors reached 50–150 mm 3 . Triacsin c was administered by intratumoral injection in 40 μL of solution (30 mg · kg −1 · day −1 ) daily from days 0 to 2. Control mice received the same volume of saline as did experimental mice. The length (L) and width (W) of the tumor were measured, and the tumor volume (TV) was calculated as TV = (LXWXW)/2. The open bars represent the control group, whereas solid bars represent the Triacsin c–treated group. Bars depict the mean values of five mice, and error bars show 95% confidence intervals. P values (two-sided) were calculated using the Student t test.
D ISCUSSION
The activity of the apoptosome-mediated pathway, the intrinsic machinery of apoptosis, was elevated in the majority of tumor cells examined but was low in some tumor cells, compared with normal cells. Moreover, we observed a complementary pattern between p53 loss and low apoptosome activity in human cancer cell lines. Here, we applied an in silico COMPARE approach ( 24 , 25 ) and successfully identified Triacsin c, a specific inhibitor of ACS, as an agent that selectively targets the apoptosome pathway of tumor cells. Restoration of ACS activity by the expression of ACSL5 suppressed Triacsin c–induced cell death, indicating that ACS inhibition was a critical step for the tumor-selective activation of the apoptosome pathway. Moreover, we showed that ACS was involved in the maintenance of levels of cardiolipin, a mitochondrial phospholipid that anchors cytochrome c and that ACS inhibition induced cytochrome c release.
The results in this study agree with data from previous studies that show the complementary role of apoptosome inactivation and p53 loss in tumor growth ( 12 , 14 ) . Scott et al. ( 15 ) report, however, that, unlike loss of p53, loss of apaf-1 alone is not enough to promote oncogene-induced transformation of mouse embryo fibroblasts. One explanation could be that, in the apoptosome-defective cancer cells, additional defects occur that promote malignant transformation.
Our data indicate that most p53-mutated tumors retain apoptosome activity and that it is higher in tumor cells than in normal cells. This finding provides a molecular basis for clinical trials of patients with p53 mutant tumors by wild-type p53 gene transfer or the downstream gene transfer therapy. Furthermore, our data raise the possibility that stimuli that bypass the p53 defect and activate the downstream apoptosome directly could selectively kill p53-mutant tumor cells.
The main limitation of our study is that our results are based on the data from a representative set of human cancer cell lines. Further studies are needed to validate our result in a larger set of cancer cells, including those from tumor samples.
Our results indicate that ACS promotes cancer cell survival by maintaining cardiolipin level and cytochrome c retention in the mitochondria and that ACS inhibition leads to the activation of the apoptosome-mediated pathway. Moreover, NAO, a specific cardiolipin inhibitor, induced cytochrome c release ( Fig. 5, C ), and this finding suggests that lowered cardiolipin level causes cytochrome c release in ACS inhibition–induced cell death ( Fig. 7 ). Previous reports have demonstrated, in liposomes formed from defined lipid mixtures with a composition similar to that of mitochondria of eggs of the amphibian Xenopus laevis , that cardiolipin is also involved in proapoptotic steps by cooperating with Bid and Bax ( 34 ) , although contrasting results were presented from a study using yeast mitochondria ( 35 ) . Thus, further studies are needed to clarify the role of cardiolipin in the apoptosis of human cancer cells.
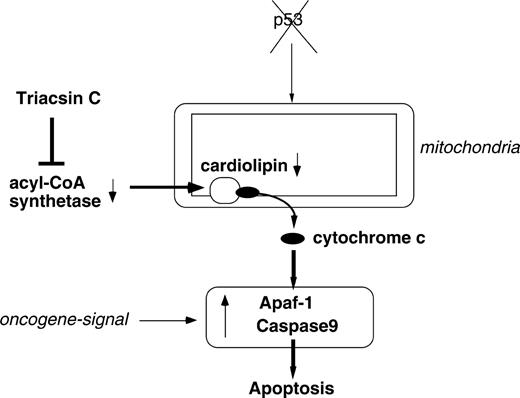
Possible model for the regulation of mitochondrial cardiolipin by acyl-CoA synthetase, inhibition of which leads to preferential apoptosome-mediated tumor cell death.
Our results showed that blocking cardiolipin function is one way to initiate the intrinsic apoptosis pathway. However, alternative mechanisms should also be considered in ACS inhibition–induced apoptosis, because acyl-CoA is involved in multiple biochemical pathways, including adenine nucleotide translocase regulation and beta-oxidation. It has been suggested that adenine nucleotide translocase plays a role in cytochrome c release from the mitochondria during apoptosis ( 36 ) . Because acyl-CoA inhibits adenine nucleotide translocase ( 37 ) , we hypothesize that ACS inhibition could lead to a decrease in intracellular acyl-CoA levels, activation of adenine nucleotide translocase, and, subsequently, to the release of cytochrome c through activated adenine nucleotide translocase. Recent evidence against the involvement of adenine nucleotide translocase in cytochrome c release ( 38 ) could discount this hypothesis, though. Because acyl-CoA also interacts with other mitochondrial proteins ( 39 ) , additional studies are required to define the role of these interactions in apoptosis.
ACS catalyzes the formation of acyl-CoA from fatty acid, a critical step in fatty acid degradation through beta-oxidation, and the inhibition of ACS causes the accumulation of free fatty acid ( 40 ) . Because free fatty acid has the potential to promote the opening of the mitochondrial permeability transition pore ( 41 ) or to cause cytochrome c release ( 42 ) , the accumulation of free fatty acid could be another mechanism to initiate apoptosome pathway by ACS inhibition.
The precise role of ACS in fatty acid biosynthesis is still undefined. However, it is known that ACSL5 localizes mainly to the mitochondria ( 33 ) and is overexpressed in glioma ( 31 ) . Our results indicate that the ACSL5 isozyme plays a dominant role in biosynthesis of mitochondrial cardiolipin and could be involved in cancer cell survival.
In this study, we observed that ACS inhibition preferentially induced apoptosome-mediated death of cancer cells, and we identified Triacsin c as a specific activator of this pathway. Although p53 induces apaf-1 transcription in cancer cells ( 5 ) , in our study, Triacsin c did not induce p53 expression in normal cells, which may explain why the agent is less toxic to normal cells. Triacsin c also suppressed growth of tumor xenografts without any decrease in body weight of the murine host. Taken together with the frequent expression of ACS in human cancers ( 31 , 32 ) , we suggest that ACS may be a good target for chemotherapy. However, further studies are needed to define the specific role of each ACS isozyme in malignant transformation.
This work was supported by a grant-in-aid for cancer research from the Ministry of Education, Culture, Sports, Science and Technology of Japan. We thank Dr. S. Ohyama for assistance in the measurement of apoptosome activity of normal human cells.
References
Budihardjo I, Oliver H, Lutter M, Luo X, Wang X. Biochemical pathways of caspase activation during apoptosis.
Fearnhead HO, Rodriguez J, Govek EE, Guo W, Kobayashi R, Hannon G, et al. Oncogene-dependent apoptosis is mediated by caspase-9.
Moroni MC, Hickman ES, Denchi EL, Caprara G, Colli E, Cecconi F, et al. Apaf-1 is a transcriptional target for E2F and p53.
Nahle Z, Polakoff J, Davuluri RV, McCurrach ME, Jacobson MD, Narita M, et al. Direct coupling of the cell cycle and cell death machinery by E2F.
Vakkala M, Paakko P, Soini Y. Expression of caspases 3, 6 and 8 is increased in parallel with apoptosis and histological aggressiveness of the breast lesion.
Krepela E, Prochazka J, Liul X, Fiala P, Kinkor Z. Increased expression of Apaf-1 and procaspase-3 and the functionality of intrinsic apoptosis apparatus in non–small-cell lung carcinoma.
Mendelsohn AR, Hamer JD, Wang ZB, Brent R. Cyclin D3 activates Caspase 2, connecting cell proliferation with cell death.
Nguyen JT, Wells JA. Direct activation of the apoptosis machinery as a mechanism to target cancer cells.
Fantin VR, Berardi MJ, Scorrano L, Korsmeyer SJ, Leder PA. Novel mitochondriotoxic small molecule that selectively inhibits tumor cell growth.
Johnstone RW, Ruefli AA, Lowe SW. Apoptosis: a link between cancer genetics and chemotherapy.
Tsuruo T, Naito M, Tomida A, Fujita N, Mashima T, Sakamoto H, Haga N. Molecular targeting therapy of cancer: drug resistance, apoptosis and survival signal.
Schmitt CA, Fridman JS, Yang M, Baranov E, Hoffman RM, Lowe SW. Dissecting p53 tumor suppressor functions in vivo.
Scott CL, Schuler M, Marsden VS, Egle A, Pellegrini M, Nesic D, et al. Apaf-1 and caspase-9 do not act as tumor suppressors in myc-induced lymphomagenesis or mouse embryo fibroblast transformation.
Yang L, Mashima T, Sato S, Mochizuki M, Sakamoto H, Yamori T, et al. Predominant suppression of apoptosome by inhibitor of apoptosis protein in non–small-cell lung cancer H460 cells: therapeutic effect of a novel polyarginine-conjugated Smac peptide.
Iverson SL, Orrenius S. The cardiolipin-cytochrome c interaction and the mitochondrial regulation of apoptosis.
Kim TH, Zhao Y, Ding WX, Shin JN, He X, Seo YW, et al. Bid-cardiolipin interaction at mitochondrial contact site contributes to mitochondrial cristae reorganization and cytochrome C release.
Tomoda H, Igarashi K, Omura S. Inhibition of acyl-CoA synthetase by triacsins.
O'Connor PM, Jackman J, Bae I, Myers TG, Fan S, Mutoh M, et al. Characterization of the p53 tumor suppressor pathway in cell lines of the National Cancer Institute anticancer drug screen and correlations with the growth-inhibitory potency of 123 anticancer agents.
Sakamoto H, Mashima T, Yamamoto K, Tsuruo T. Modulation of heat-shock protein 27 (Hsp27) anti-apoptotic activity by methylglyoxal modification.
Jia LQ, Osada M, Ishioka C, Gamo M, Ikawa S, Suzuki T, et al. Screening the p53 status of human cell lines using a yeast functional assay.
Takahashi M, Tonoki H, Tada M, Kashiwazaki H, Furuuchi K, Hamada J, et al. Distinct prognostic values of p53 mutations and loss of estrogen receptor and their cumulative effect in primary breast cancers.
Yamori T. Panel of human cancer cell lines provides valuable database for drug discovery and bioinformatics.
Yamori T, Matsunaga A, Sato S, Yamazaki K, Komi A, Ishizu K, et al. Potent antitumor activity of MS-247, a novel DNA minor groove binder, evaluated by an in vitro and in vivo human cancer cell line panel.
Kage K, Tsukahara S, Sugiyama T, Asada S, Ishikawa E, Tsuruo T, et al. Dominant-negative inhibition of breast cancer resistance protein as drug efflux pump through the inhibition of S-S dependent homodimerization.
Mashima T, Naito M, Tsuruo T. Caspase-mediated cleavage of cytoskeletal actin plays a positive role in the process of morphological apoptosis.
Banis RJ, Tove SB. Solubilization of a long chain fatty acyl-CoA synthetase from chicken adipose tissue microsomes.
Hardy S, El-Assaad W, Przybytkowski E, Joly E, Prentki M, Langelier Y. Saturated fatty acid-induced apoptosis in MDA-MB-231 breast cancer cells. A role for cardiolipin.
Shimizu S, Tsujimoto Y. Proapoptotic BH3-only Bcl-2 family members induce cytochrome c release, but not mitochondrial membrane potential loss, and do not directly modulate voltage-dependent anion channel activity.
Yamashita Y, Kumabe T, Cho YY, Watanabe M, Kawagishi J, Yoshimoto T, et al. Fatty acid induced glioma cell growth is mediated by the acyl-CoA synthetase 5 gene located on chromosome 10q25.1-q25.2, a region frequently deleted in malignant gliomas.
Cao Y, Dave KB, Doan TP, Prescott SM. Fatty acid CoA ligase 4 is up-regulated in colon adenocarcinoma.
Coleman RA, Lewin TM, Van Horn CG, Gonzalez-Baro MR. Do long-chain acyl-CoA synthetases regulate fatty acid entry into synthetic versus degradative pathways?
Kuwana T, Mackey MR, Perkins G, Ellisman MH, Latterich M, Schneiter R, et al. Bid, Bax, and lipids cooperate to form supramolecular openings in the outer mitochondrial membrane.
Iverson SL, Enoksson M, Gogvadze V, Ott M, Orrenius S. Cardiolipin is not required for Bax-mediated cytochrome c release from yeast mitochondria.
Marzo I, Brenner C, Zamzami N, Jurgensmeier JM, Susin SA, Vieira HL, et al. Bax and adenine nucleotide translocator cooperate in the mitochondrial control of apoptosis.
Woldegiorgis G, Yousufzai SY, Shrago E. Studies on the interaction of palmitoyl coenzyme A with the adenine nucleotide translocase.
Kokoszka JE, Waymire KG, Levy SE, Sligh JE, Cai J, Jones DP, et al. The ADP/ATP translocator is not essential for the mitochondrial permeability transition pore.
Woldegiorgis G, Lawrence J, Ruoho A, Duff T, Shrago E. Photoaffinity labeling of mitochondrial proteins with 2-azido [32P]palmitoyl CoA.
Arai T, Kawakami Y, Matsushima T, Okuda Y, Yamashita K. Intracellular fatty acid downregulates ob gene expression in 3T3-L1 adipocytes.
Wieckowski MR, Brdiczka D, Wojtczak L. Long-chain fatty acids promote opening of the reconstituted mitochondrial permeability transition pore.

