


Abstract
Resveratrol (RES), a natural polyphenol phytoalexin, has been reported to attenuate nonalcoholic fatty liver disease (NAFLD). However, its roles on protection of liver from lipotoxicity and underlying mechanism are not fully understood. In this study, we investigated the impacts of RES on alleviating hepatic lipotoxicity and corresponding molecular mechanism. Impacts of RES on oleic acid (OA)-induced lipotoxicity were assessed in L02 cells and C57BL/6J mice, respectively. In L02 cells, lipotoxicity was assessed by detection of apoptosis, mitochondrial function, oxidative stress and ROS-related signaling. In mice, lipotoxicity was evaluated by detecting hepatic function, serum enzyme activity, and reactive oxygen species (ROS) levels. We found that RES reduced OA-induced apoptosis, mitochondrial dysfunction, ROS generation, and DNA damage in L02 cells. RES also decreased expression of cleaved caspase-3 and p53 and increased expression of B-cell lymphoma 2 (Bcl-2). Importantly, RES protected mice from high-fat diet–induced hepatic lipotoxicity, demonstrated by reduced ROS levels and lipid peroxidation. Mechanically, B lymphoma Mo-MLV insertion region 1 (Bmi-1) expression and antioxidative superoxide dismutase were increased after RES treatment. Further mechanistic analysis indicated that protection effects of RES against OA-induced lipotoxicity were abrogated by Bmi-1 small interference RNA (siRNA) in L02 cells.
SIGNIFICANCE STATEMENT Results from clinical studies about the effect of RES on NAFLD are inconsistent and inconclusive. This study confirms the protective role of RES as an anti-ROS agent and its ability to alleviate DNA damage through a pathway involving p53/p21 signaling. Further mechanistic analysis indicated that protection effects of RES were relative with Bmi-1. This is the first study on the role of Bmi-1 in the pathogenesis of NAFLD and the target of resveratrol against NAFLD.
Introduction
Nonalcoholic fatty liver disease (NAFLD) represents a large spectrum of liver injuries, ranging from simple reversible hepatic steatosis (intrahepatic accumulation of triglycerides) and nonalcoholic steatohepatitis (NASH) to more severe lesions including cirrhosis and hepatocellular carcinoma (Farrell and Larter, 2006; Michelotti et al., 2013). Global prevalence of NAFLD is 25.24% and shows an increasing trend (Younossi et al., 2016). Moreover, higher incidence of the NAFLD was reported strongly associated with obesity, type II diabetes, hyperlipidemia, hypertension, and cardiovascular disease (Byrne and Targher, 2015). Hence, seeking appropriate intervention is the pivotal aim of the NAFLD studies.
High-fat diet (HFD)-mediated lipotoxicity and reactive oxygen species (ROS) are critical risk factors for the NAFLD (Nehra et al., 2001). A “two-hit” hypothesis, where the “first hit” consists of adipokine abnormalities and insulin resistance (Polyzos et al., 2009) and the “second hit” is characterized by lipid peroxidation, oxidative stress, and an increase in cytokine production and inflammation (Seki et al., 2002), may explain the progression of simple fatty liver disease to NASH (Day and James, 1998). Aberrant lipid overload in obesity triggers the accumulation of long-chain nonesterified fatty acids, impairs cellular function and then induces injuries in steatohepatitis (Martinez-Rubio et al., 2013). In addition, growing evidence now strongly suggests that oxidative stress originating from mitochondria and metabolic lipid peroxidation plays key roles in the hepatic injury occurring in NAFLD (Spahis et al., 2017). This suggests that antioxidants act against NAFLD induced lipotoxicity and other liver damages.
Resveratrol (RES), an important dietary polyphenol present in grapes and red wine, exhibits antioxidative (Schmatz et al., 2012), anti-inflammatory (Das and Das, 2007), and anticancer (Jang et al., 1997) properties. Both in vitro and in vivo, RES exerts inhibitory effects on the development of NAFLD by functioning against lipid accumulation induced by high-fat diet (Charytoniuk et al., 2017). Moreover, RES scavenges ROS and inhibits the expression of p47 phox and gp91 phox (oxidative stress-related proteins) (Gómez-Zorita et al., 2012; Tang et al., 2012), as well as increases the expression of antioxidant enzyme SOD1 and glutathione peroxidase (Spanier et al., 2009) in the liver. The lipid-lowering and ROS-scavenging effects of RES raise the possibility for the use of RES as an agent to treat NAFLD and study the mechanism of antioxidants against NAFLD. Therefore, it is worthy to reevaluate the effect of RES on NAFLD and determine the mechanism of RES on alleviating oxidative stress and subsequent lipotoxicity. In the present study, we assessed the role of RES on protection of hepatocytes against lipotoxicity and underlying molecular mechanism.
Materials and Methods
Chemical and Reagents
RES (501-36-0, ≥99% purity) was purchased from Zhejiang Great Forest Biomedical Ltd. (Hangzhou, China). Normal chow, HFD, chow and HFD mixed with RES were purchased from Beijing Huafukang Bioscience Technology (Beijing, China). Dulbecco’s modified Eagle’s medium (DMEM) was purchased from Gibco (Invitrogen, Carlsbad, CA). FBS was purchased from Zhejiang Tianhang Biologic Technology Co., Ltd. (Hangzhou, China). All other reagents were obtained from Sigma unless other indicated.
Animals and Hepatic Lipotoxicity Mouse Model
Female C57BL/6J mice (4 weeks old) were purchased from Hubei Provincial Center for Disease Control and Prevention and maintained in Animal Centre of Tongji Medical College affiliated with the Huazhong University of Science and Technology. All mice were housed with diet and water available ad libitum and an alternating 12-hour light/dark cycle. Mice, starting at age 6 weeks, were randomly divided into four groups: low-fat diet (LFD) group (fed on normal chow diet containing 10% calories from fat, n = 11), HFD group (fed on high-fat diet containing 60% calories from fat, n = 12), LFD + RES group (normal chow diet containing 0.4% w/w RES, n = 11), and HFD + RES group (high-fat-diet containing 0.4% w/w RES, n = 12). Normal chow diet (#1025), high-fat diet (#H10060), and customized diet mixed with RES were obtained from Beijing Huafukang Bioscience Technology. Mouse appearances and activities were observed and recorded daily. Mice were weighed every other day. Mouse liver tissues and blood samples were collected for analysis in the end of experiments. All the performed experiments were approved by the Animal Ethics Committee in Huazhong University of Science and Technology and carried out in accordance with the Hubei Province Laboratory Animal Care Guidelines for the use of animals in research.
Biochemical Assays and Lipid Peroxidation Detection
Serum samples were centrifuged at 3000 rpm for 10 minutes and were kept at −80°C until analysis. The serum biochemical levels of alanine aminotransferase (ALT), aspartate aminotransferase (AST), triglyceride (TG), and total cholesterol were analyzed using an automatic biochemical analyzer (Cobas-8000; Roche Diagnostics, Rotkreuz, Switchland) in clinical laboratory of Tongji Hospital. Production of malondialdehyde (MDA, A003-4), lipid peroxidase (LPO, A106-1), superoxide dismutase (SOD, A006-2) and in vitro levels of ALT (C009-1), AST (C010-2), TG (A110-1), and TC (A111-1) were detected with commercial kits from Nanjing Jiancheng Bioengineering Institute (Nanjing, China). All of the procedures were carried out according to the manufacturers’ instructions.
Liver Histology and Immunohistochemical Staining
The isolated liver tissues were fixed in 4% paraformaldehyde and embedded in paraffin serially sectioned at 5 µm and then were stained with hematoxylin-eosin. For the detection of neutral lipid accumulation, liver cryosections were stained with 0.5% Oil Red O (Sigma-Aldrich) for 10 minutes, washed, and counterstained with Mayer’s hematoxylin (Sigma-Aldrich) for 45 seconds. The slides were visualized and photographed with a microscopy (Olympus SZX12, Japan) connected to a PC.
Cell Culture and Treatment
Human nontumor fetal liver cell line L02 was obtained from Shanghai X-Y Biotechnology Co., Ltd. (Shanghai, China). L02 cells were cultured in an atmosphere of 5% CO2 at 37°C in high glucose DMEM supplemented with 10% FBS, penicillin, and streptomycin. M-plasmocin (InvivoGen, San Diego, CA; 2.5 μg/ml) was used to prevent the possible mycoplasma infections. Bmi-1 Smartpool siRNA was purchased from Ribobio Co., Ltd (Guangzhou, China) and used to knock down B lymphoma Mo-MLV insertion region 1 (Bmi-1) in L02 cells. The Bmi-1 siRNA sequences: sense strand 5′-CCA GAC CAC UCC UGA ACA UTT-3′ and antisense strand 5′-AUG UUC AGG AGU GGU CUG GTT-3′ for mice, and for human were sense strand 5′-CCA GAC CAC UAC UGA AUA UAA-3′ and antisense strand 5′-UUA UAU UCA GUA GUG GUC UGG UU-3′. The cells were transfected using the Lipofectamine RNAiMAX (Invitrogen Corp) according to the manufacturer’s instructions. Following transfection, the cells were incubated for 48 hours before treatments. A scrambled pool of siRNA served as the control. Bmi-1 overexpressed vector pGC-FU-GFP-Bmi-1 and pGC-FU-GFP control were purchased from GeneChem (Shanghai, China). Cells were infected with the lentivirus and selected under 1 µg/ml puromycin.
MTT (3-[4,5-dimethylthiazol-2-yl]-2,5 diphenyl tetrazolium bromide) Cell Viability Assay
The cells were plated in triplicate wells in 96-well plates (5 × 10³ cells per well) overnight and incubated with OA (0.8 mM) with/without RES (25 or 50 µM) containing complete DMEM for 24 hours. MTT (5 mg/L; 20 µl) was added to the medium, and cells were incubated for additional 4 hours. After that, media were removed, and 200 µl of DMSO was added to dissolve the blue-purple formazan. Optical density was determined by using the microplate reader (Multiskan MK3, Thermo Fisher Scientific, Atlanta, GA, USA) at 490 nm. Relative percentage of surviving cells was calculated by dividing the absorbance of treated cells by the control in every experiment.
Apoptosis and Cell Cycle Arrest Assay
Cells were seeded in six-well plates (1.5 ×10⁵ cells per well) overnight and then cultured with OA (0.8 mM) with/without 50 µM RES containing complete DMEM for 24 hours. For apoptosis detection by flow cytometry (FACS), cells were trypsinized, collected, and then stained using an Annexin V-FITC Apoptosis Kit (KeyGen Biotechm Nanjing, China). For cell cycle analysis by FACS, cells were harvested by trypsinization and immobilized in 70% ethanol at 4°C overnight. After being washed and resuspended in 200 μl PBS, cells were treated with 5 μl RNase (20 mg/ml) and 20 μl propidium iodide (500 μg/ml, KeyGen Biotech) at 37°C for 30 minutes.
Mitochondrial and Intracellular ROS Levels
L02 cells were seeded in six-well plates (1.5 × 10⁵ cells per well) and then treated with OA and/or RES for 24 hours. The cells were harvested by trypsinization and were stained using a Tetrechloro-tetraethylbenzimidazol carbocyanine iodide (JC-1) mitochondrial transmembrane potential assay kit (Beyotime, China). The FL1 and FL2 fluorescence intensities of each sample were detected on a flow cytometer. For analysis of tissue ROS, mouse livers were frozen in optimum cutting temperature compound, cryosectioned, and incubated with Dihydroergotamine (DHE)-labeled redoxsensitive probes at 37°C for 30 minutes. ROS in cultured cells were measured by incubating 106 cells with 5 μM CM-H2DCFDA (2′,7′-Dichlorodihydrofluorescein diacetate) (E004; Nanjing Jiancheng Bio-technology, Nanjing, China) at 37°C for 30 minutes. DCFDA fluorescence was then detected by FACS (Accuri C6, BD Biosciences, San Diego, CA).
Western Blot Analysis
For protein extraction, freshly isolated mouse livers were homogenized in a lysis buffer. Equal amounts of proteins were separated on a 10% polyacrylamide gel and transferred to a Polyvinylidene Fluoride (PVDF) membrane. The membrane was blocked for 1 hour in 5% skim milk and then incubated with primary antibodies that were specific for Bmi-1, p14Arf, Nrf2, Bax (Cell Signaling Technology, Danvers, MA, USA), p19Arf, γH2AX (Abcam, Cambridge, UK), and p53, p21, p16INK4A, caspase3, Bcl2, cyclin A2, cyclin B1, cyclin D1, and cyclin E1 (Proteintech, Wuhan, China) overnight. After being washed in tris-buffered saline with 0.1% Tween 20 three times, the membranes were incubated with the appropriate secondary antibodies for 1 hour. Then the membrane was washed three times and visualized using an enhanced chemiluminescence system according to the manufacturer’s instructions (Perkin Elmer, Waltham, MA).
Statistical Analysis
Data are presented as mean ± S.E.M. For statistical analyses, we used GraphPad Prism software version 6.03. Multiple groups were compared by one-way ANOVA followed by Dunnett’s post-test. P values of less than 0.05 were considered significant.
Results
RES Protected L02 Hepatocytes from OA-Induced Cell Death
We first investigated the protective role of RES on fat-induced cell death. We treated L02 cells with a series of concentrations of OA with or without RES and then evaluated the cell viability using MTT assay. OA treatment of 24 hours reduced the number of L02 cells in a dose-dependent manner, with an IC50 of 0.7 mM (Fig. 1A). However, the OA-induced reduction in cell numbers was attenuated by cotreatment with 25 or 50 μM RES (Fig. 1A). Treatment with 25 or 50 μM RES increased the survival of L02 cells treated with 1.0 mM OA from 18% to 25% and 35%, respectively (Fig. 1A). In addition, RES treatment alone (<60 μM) did not show a killing effect in those cells. This result indicates that OA induced lipotoxicity in cells and RES protected cell from lipotoxicity-induced cell death. For following experiments, we treated the L02 cells with 0.8 mM (slightly higher than IC50) OA with or without 50 μM RES to ensure that OA kills partial cells and RES demonstrates efficient protective effects.

RES protected against OA-induced cell death in L02 cells. (A) Cell viability of L02 cells treated with OA (0–1.0 mM) for 24 hours with or without RES (25 and 50 μM). Survival of cells was measured using an MTT assay. (B) Cell morphology of L02 cells. L02 cells were treated with OA (0.8 mM) for 24 hours with or without RES cotreatment (50 μM). (C) Apotosis of L02 cells treated with OA (0.8 mM) for 24 hours with or without RES (50 μM). Apoptotic cells were analyzed with a flow cytometry using Annexin-V/PI (Propidium iodide) staining. (D) Apoptosis-associated proteins assessed through Western blotting. Data represent mean ± S.E.M. (n = 3). *P < 0.05, **P < 0.01, and ***P < 0.001.
It is reported that OA induces cell death through apoptosis (Healy et al., 2003). We thus examined whether RES could mitigate the apoptosis induced by OA. Compared with the vehicle, OA suppressed the growth of L02 cells, and the cells were less stretched and partially detached from the dishes. In contrast, cotreatment with RES rescued the survival of the majority of the cells (Fig. 1B). Flow cytometry analysis showed that OA induced apoptosis in 41.7% L02 cells and RES cotreatment mitigated the OA-induced apoptosis to 29.2% (Fig. 1C). To verify whether OA-induced cell death is universal, we detected cell death in HepG2 and Hep3B cells after OA treatment. We found that OA suppressed the growth of HepG2 (Supplemental Fig. 1, A and B) and Hep3B cells as well (Supplemental Fig. 2, A and B). Consistently, cleaved caspase-3 and Bax were increased by OA treatment but inhibited by RES cotreatment (Fig. 1D). Antiapoptosis gene Bcl-2 was downregulated by OA but maintained by RES (Fig. 1D). In addition, OA significantly increased p53 level, whereas RES reduced OA-induced p53 expression (Fig. 1D). Together, these results indicate that RES protected L02 cells from OA-induced cellular apoptosis.
RES Attenuated OA-Induced Cell Cycle Arrest in L02 Cells
Cell cycle arrest can lead to cellular apoptosis (Schmitt et al., 1996). We then examined the effects of OA and RES on cell cycle progression of L02 cells. Cell cycle analysis by FACS showed that L02 cells treated with OA were arrested in the G2 phase, whereas RES reduced G2 phase arrest (Fig. 2A). Moreover, OA augmented the expression of G2 phase–related cyclin A and cyclin B1, whereas RES maintained their expression (Fig. 2B). Correspondingly, G1 phase–related cyclin E1 was decreased in OA-treated cells, whereas RES cotreatment reversed this effect. These results indicate that RES protected hepatocytes from lipotoxicity-induced apoptosis.

RES attenuated OA-induced G2 cycle arrest in L02 cells. L02 cells were treated with 0.8 mM OA for 24 hours with or without 50 μM RES cotreatment. (A) Distribution histograms of L02 cells in various cell cycle phases. (B) The levels of cell cycle–related proteins in L02 cells induced by OA with or without RES. Data represent mean ± S.E.M. (n = 3). *P < 0.05, **P < 0.01, and ***P < 0.001.
RES attenuated OA-Induced Lipid Accumulation and Cellular Injury in L02 Cells
We then explored the role of RES on preventing lipid accumulation in OA-treated L02 cells. The results showed that OA induced lipid accumulation in L02 cells, which was confirmed by Oil Red O Staining (Fig. 3A). Meanwhile, there were significantly fewer intracellular lipid droplets in RES-cotreated L02 cells (Fig. 3A). We next measured the intracellular TG levels using a kit. The TG content was decreased from 24.2 mg/mg protein in OA-treated cells to 11.6 mg/mg protein in OA plus RES–treated cells (Fig. 3B). In addition, ALT and AST levels were significantly increased by OA treatment but lowered significantly after addition of RES (Fig. 3, C and D). These results suggest that RES attenuated OA-induced lipid accumulation and cellular injury in L02 cells.

RES attenuated OA-induced intracellular steatosis in L02 cells. L02 cells were treated with 0.8 mM OA for 24 hours with and without 50 μM RES cotreatment. (A) Representative staining images showing intracellular lipid accumulation in L02 cells stained with Oil Red O (magnification = 200×). Cellular TG content (B), supernatant ALT level (C), and AST level (D) were measured using commercial detection kits. Data represent mean ± S.E.M. (n = 3). *P < 0.05 and **P < 0.01.
RES Inhibited OA-Induced Oxidative Stress and DNA Injury in L02 Cells
It is reported that increased ROS levels contribute to cellular lipotoxicity together with genetic aberration (Vesterdal et al., 2014). Hence, we assayed the effect of RES on OA-induced cellular ROS in L02 cells via FACS-based quantification of fluorescent CM-H2DCFDA. Treatment with 0.8 mM OA for 24 hours led to marked cellular ROS accumulation in L02 cells, whereas RES treatment decreased cellular ROS accumulation (Fig. 4A). Moreover, RES blocked the increased fluorescence intensity of ROS induced by OA (Fig. 4B). Additionally, OA increased the expression of prooxidation-related protein Hypoxia Inducible Factor 1 Subunit Alpha (Hif1α), but decreased the level of antioxidation-related protein Nuclear factor erythroid 2-related factor 2 (Nrf2) (Fig. 4C). As expected, these alterations were reversed by RES administration (Fig. 4C).

RES attenuated OA-induced oxidative stress and DNA injury in L02 cells. L02 cells were treated with 0.8 mM OA for 24 hours with or without 50 μM RES. (A) Detection of intracellular ROS with CM-H2DCFDA via a flow cytometry. (B) ROS levels measured with a microplate reader. (C) Hif1α and Nrf2 levels measured through Western blot and normalized against tubulin. (D) MMP detection in L02 cells by flow cytometry after 24 hours of RES treatment. (E) ATP levels in OA-buffered L02 cells with or without RES for 24 hours. (F) Levels of γH2AX and 8-oxoguanine level in the indicated groups and normalized against tubulin. Data represent mean ± S.E.M. (n = 3). *P < 0.05, **P < 0.01, and ***P < 0.001.
Increased ROS could lead to the decreased mitochondrial membrane potential (MMP) and lowered ATP levels. Therefore, we determined the effect of OA or RES on the MMP using a JC-1 kit. In the mitochondria, JC-1 aggregates when the MMP decreases. The results showed that OA treatment produced JC-1 aggregates in 26.4% cells, whereas RES treatment significantly decreased the cells with JC-1 aggregates to 13.5%. (Fig. 4D). RES treatment also reduced the leakage of mitochondrial ATP (Fig. 4E). We then examined the effect of RES treatment on DNA damage and repair. We found that γH2AX and 8-oxoguanine were increased following OA treatment in L02 cells, whereas RES cotreatment reversed this effect (Fig. 4F). We also found that OA increased γH2AX and 8-oxoguanine expression in HepG2 (Supplemental Fig. 1C) and Hep3B cells (Supplemental Fig. 2C). These results reveal that RES mitigates the oxidative stress and genotoxic effects of lipid accumulation.
RES Exerted Its Protective Effect by Upregulating Bmi-1 Expression in L02 Cells
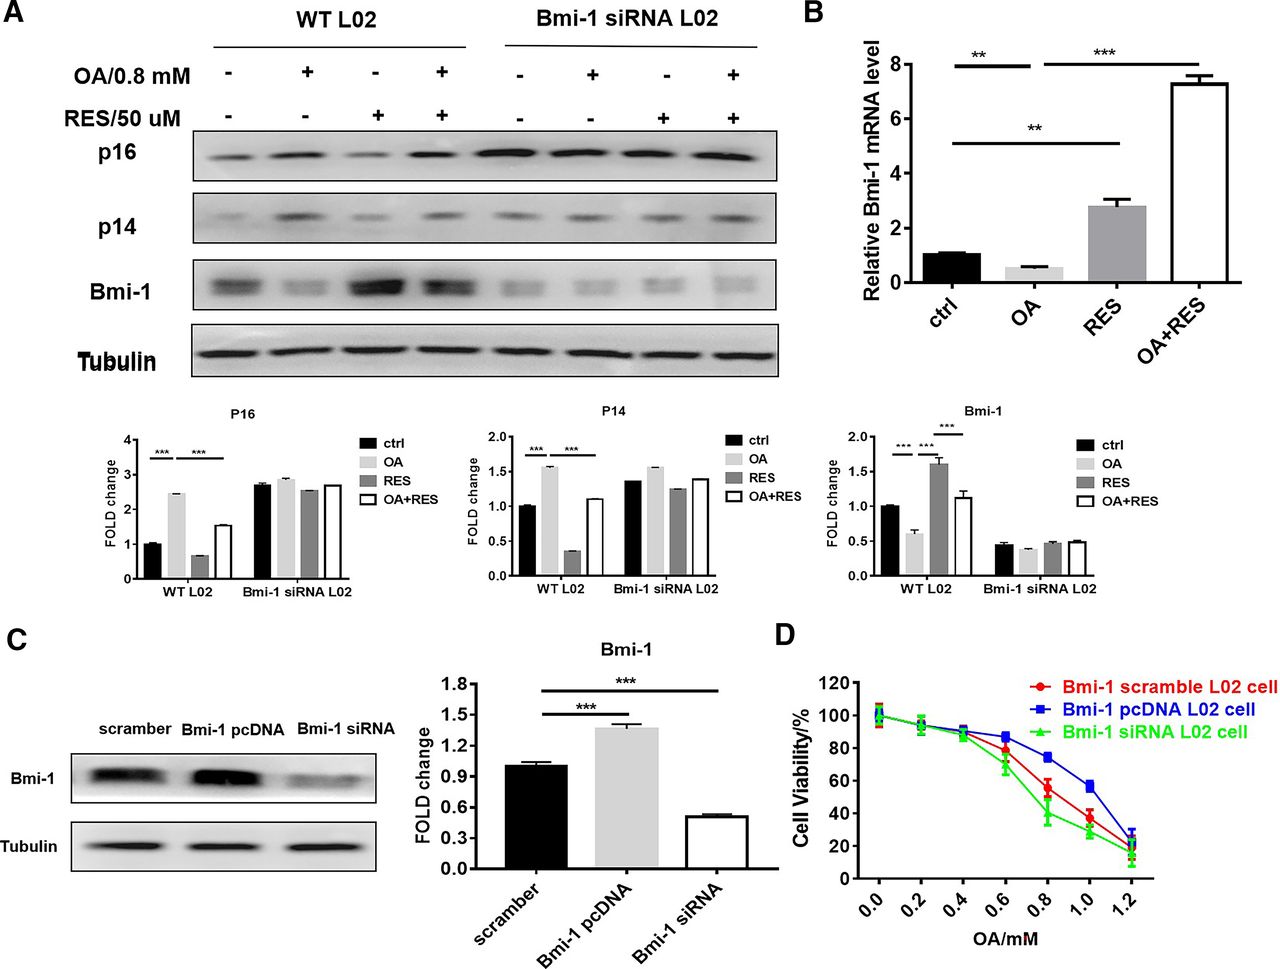
Bmi-1 has a crucial role in the response to mitochondrial function, DNA damage, and oxidative stress (Liu et al., 2009). We thus determined the effects of OA or RES on Bmi-1 expression levels in L02 cells. In L02 cells, OA alone decreased Bmi-1 and prominently raised the expression of the Bmi-1–targeting proteins, p16INK4a and p14Arf (Fig. 5A). RES cotreatment suppressed the increased p16Ink4a and p14Arf expression and restored Bmi-1 expression (Fig. 5A). Real-time quantitative reverse transcription PCR (qRT-PCR) analysis confirmed Bmi-1 gene expression results (Fig. 5B). To determine whether Bmi-1 is involved in the protective effects of RES in OA-treated L02 cells, we used Bmi-1 siRNA to knockdown Bmi-1 and used Bmi-1/pCDNA to overexpress Bmi-1. MTT assay showed that when treated with OA, Bmi-1 Smartpool siRNA group cells have much lower IC50 than siControl group cells, whereas Bmi-1 pcDNA group cells have much higher IC50 than siControl group cells (Fig. 5, C and D). Thus, upregulation of Bmi-1 expression accounted for the protective effects of RES against OA-induced hepatotoxicity in L02 cells.

RES upregulated Bmi-1 expression in L02 cells. (A) Bmi-1, p16Ink4a, and p14Arf levels detected by Western blot. L02 cells were treated with OA (0.8 mM) for 24 hours with or without 50 μM RES. (B) Bmi-1 mRNA levels in the indicated groups. (C) Western blots of Bmi-1. L02 cells were transfected with scrambled siRNA (siCon), Bmi-1 Smartpool siRNA, or Bmi-1/pcDNA for 48 hours. (D) Cell viability of L02 cells. The cells were treated with different concentrations of OA (0–1.0 mM) for 24 hours and the cell survival was measured using an MTT assay. Data represent mean ± S.E.M. (n = 3). **P < 0.01 and ***P < 0.001.
RES Attenuated HFD-Induced Hepatotoxicity in Mice
The general appearance of mice in all four groups was observed daily after the HFD treatment. Mice fed with HFD appeared oily and obese. When fed with HFD, RES-treated mice showed reduced body weight compared with HFD-group mice (Fig. 6A). To detect the effects of RES on hepatic steatosis, we conducted hematoxylin/eosin and Oil Red O staining (Fig. 6B). The results showed that hepatocytes of HFD-fed mice were expanded with evident lipid droplet accumulation, whereas RES treatment reduced lipid droplets (Fig. 6B). In addition, Terminal deoxynucleotidyl transferase (TdT) dUTP nick-end labeling (TUNEL) assay showed that RES decreased apoptosis in the livers of HFD-fed mice (Fig. 6B). Immune cell infiltration was reduced by RES treatment in HFD-fed mice (Fig. 6C).

RES attenuated HFD-induced hepatotoxicity in mice. (A) Body weights of mice fed with LFD (n = 11), HFD (n = 12), LFD + RES (n = 11), or HFD + RES (n = 12) for 20 weeks. (B) Apoptosis-associated proteins levels assessed through Western blot. Tubulin served as loading control. (C) Representative microphotographs of hematoxylin and eosin (H&E)- and Oil Red O- and TUNEL- stained liver section from mice fed with LFD, HFD, LFD + RES, or HFD + RES. (D) Glucose, total cholestrol (T-CHOL), TG, ALT, AST, ALP levels in serum of the indicated groups. LFD (n = 7), HFD (n = 6), LFD + RES (n = 9), or HFD + RES (n = 8). Data represent mean ± S.E.M. (n = 10). *P < 0.05 and **P < 0.01.
In accordance with these findings, serum glucose, serum triacylglycerol, serum cholesterol, and markers of lipid metabolism disorder were significantly increased (P < 0.01) in the HFD group compared with the control and the RES alone treatment groups (Fig. 6D). Similarly, serum ALT, AST, and ALP were also significantly increased in HFD-treated mice (Fig. 6D). By contrast, these markers or indexes were significantly decreased in the RES + HFD-group mice compared with the HFD-group mice (Fig. 6D). Taken together, these results indicate that RES significantly attenuated HFD-induced hepatotoxicity.
RES Reduced HFD-Induced Oxidative Stress and Upregulated Bmi-1 Expression in Mice
ROS is involved in the pathogenesis of HFD-induced hepatotoxicity (Seki et al., 2002). Therefore, we measured intracellular O2•− production via DHE staining using frozen mouse liver sections. DHE fluorescence was more intense in the HFD-treated livers, whereas RES cotreatment attenuated the fluorescence to control levels (Fig. 7A). Moreover, ROS-induced DNA damage was reduced by RES treatment in liver tissues, as demonstrated with γH2AX staining (Fig. 7A). To elucidate the mechanisms of RES on lipid antioxidative, we examined lipid peroxidation, SOD, MDA, and LPO activities in serum. The results showed that both MDA (16.3 mM; P < 0.01) and LPO contents (8.5 µM; P < 0.001) were markedly increased in the HFD-group mice compared with those in LFD-group mice (Fig. 7B). By contrast, RES treatment reduced MDA activity (13.1 mM; P < 0.05) and LPO activity (6.7 µM; P < 0.01). SOD activity was significantly downregulated in the HFD-group mice compared with that in LFD-group mice. RES treatment significantly increased SOD levels (+29%; P < 0.05) in comparison with HFD treatment (Fig. 7B). These results demonstrate that RES reduces oxidative stress caused by HFD treatment.

RES reduced HFD-induced oxidative stress and DNA damage in mice. (A) Oxidative stress and DNA damage in liver sections. These micrographs are representative images of DHE-stained liver sections from LFD, HFD, LFD + RES, or HFD + RES mice. The relative fluorescence changes are shown in the adjacent panel. (B) MDA, SOD, and LPO activity in the serum. n = 6 in each group. (C) Western blot of Bmi-1 in mouse liver tissues. Data are calculated as ratios of target protein levels to those of tubulin. Protein level in control group was normalized to 1. n = 3 in each group. (D) Bmi-1 mRNA levels in mouse livers. n = 3 per group. Data are presented as mean ± S.E.M. *P < 0.05, **P < 0.01, and ***P < 0.001.
We then assessed Bmi-1 levels in mouse liver tissues via Western blot and qRT-PCR. Western blot results indicated that Bmi-1 level was decreased by HFD treatment whereas RES increased Bmi-1 expression in liver tissues (Fig. 7C). Similar results were obtained through qRT-PCR analysis (Fig. 7D). Together with our observation in cell culture, these results suggest that RES reduces the oxidative stress by increasing Bmi-1 expression.
Discussion
This study confirmed the effects of RES in protecting oleic acid–induced lipotoxicity both in vitro and in vivo. Our study indicates that the protective effect of RES depends on Bmi-1. Therefore, this study illustrates the role of RES in protection of liver function from lipid-induced damage and uncovers a novel role of Bmi-1–mediating oxidative stress response.
Our study confirms the protective role of RES as an anti-ROS agent and its ability potentially to mitigate NAFLD progression. Hepatocytes eliminate ROS by activating the antioxidant enzymes such as heme oxygenase 1, NADPH:quinone oxidoreductase 1, and SOD. Over the past decades, a large number of antioxidants have been investigated to prevent or treat NAFLD (Arroyave-Ospina et al., 2021). Among them, RES reportedly has inhibitory effects on the development of NAFLD (Andrade et al., 2014). Many studies report a decrease in hepatic triglyceride accumulation, liver weight, and a general improvement in histology of fatty livers (Heeboll et al., 2014). However, our previous meta-analysis of clinical trials indicated that RES treatment has negligible effects on attenuating NAFLD (Zhang et al., 2016). In this study, we focused on the protective role of RES in reducing hepatic lipotoxicity. The result showed that RES potently attenuated HFD-induced oxidative stress in C57BL/6J mice, as evidenced by the suppression of ROS production, reduction in MDA and LPO concentration, and renovation of SOD activity. Therefore, our study suggests that antioxidants can help reserve liver function even it may not block NAFLD progress.
Our study also revealed the protective role of Bmi-1 in reducing DNA damage and cell death caused by ROS accumulation. DNA damage causes liver damage in NAFLD livers via p53/p21 signaling and mitochondrial ROS generation (Seki et al., 2002; Tomita et al., 2012). Hepatic p53 levels and apoptosis are increased in human and mouse NASH tissues (Panasiuk et al., 2006; Farrell et al., 2009). Once activated by oxidative stress, p53 shifts to the nucleus and induces the expression of genes that restrain cell division and cause apoptosis (Sax et al., 2002). p53 overexpression also inhibits glutathione S-transferase α1, NADPH, and cystine/glutamate transporter expression and hampers the antioxidant defenses activated by Nrf2 (Faraonio et al., 2006). Likewise, p21, a transcriptional target of p53 (el-Deiry et al., 1993), is also involved in the oxidative stress response (Rodriguez and Meuth, 2006). However, loss of p21 in L02 cells still leads to free fatty acids (FFA)-induced ROS generation and lipotoxicity (Wang et al., 2014), suggesting that additional p53/p21-independent pathways are involved in lipid induced liver damage.
Bmi-1 is a polycomb group (PcG) protein and plays an important role in the self-renewal of stem cells and oncogenesis (Park et al., 2003; Park et al., 2004; Xu et al., 2009; Li et al., 2020). Canonically, Bmi-1 negatively regulates p16Ink4a and p14 Arf/p19Arf to maintain stem cell renewal or promote carcinogenesis (Molofsky et al., 2005). In addition to its oncogenic role, Bmi-1 regulates antioxidant defenses in neurons by inhibiting p53 (Chatoo et al., 2009). By directly regulating the expression of genes related to ROS generation, Bmi-1 also regulates mitochondrial function (Liu et al., 2009). Moreover, Bmi-1 confers resistance to oxidative stress onto hematopoietic stem cells (Nakamura et al., 2012). In line with these observations, we found that RES augmented Bmi-1 expression in L02 cells and mouse liver tissues, and subsequently inhibited the expression of p16Ink4a and p19Arf. In addition, ROS signaling activates p38-mitogen activated protein kinase, and subsequently transcriptionally represses p16Ink4a and p19Arf (Molofsky et al., 2005). Thus, upregulation of Bmi-1 and subsequent repression of p16Ink4a and p19Arf may explain RES-induced suppression of mitochondrial disorders and ROS generation.
Our study also revealed a protective role of Bmi-1 in mediating RES-alleviated DNA damage. Bmi-1 can accumulate at DNA double-stand breakage foci and promote their repair through homologous recombination (Ismail et al., 2010). Sustained localization of Bmi1 to damage sites is dependent on intact ATM and ATR and requires H2AX phosphorylation and recruitment of RNF8 (Ginjala et al., 2011). Loss of BMI1 leads to impaired repair of DNA double-strand breaks and the accumulation of cells in G2/M. Likewise, Bmi1 was also reportedly involved in DNA repair in prostate cancer and glioblastoma (Facchino et al., 2010; Nacerddine et al., 2012). In this study, we showed that OA induced DNA damage and cell apoptosis, but RES treatment increased Bmi-1 expression and reduced DNA damage. Conversely, knockdown of Bmi-1 attenuated the protective role of RES in cell survival. Therefore, upregulation of Bmi-1 may be involved in RES-promoted DNA repair.
In conclusion, our study reveals the protective effects of RES in attenuation of lipid accumulation, oxidative stress, and DNA damage. Bmi-1 mediates the beneficial effects of RES in reducing liver lipotoxicity. These findings offer new insights into the hepatoprotective role of RES and underlying mechanism.
Authorship Contributions
Participated in research design: Xu, Ye.
Conducted experiments: Yuan, Zhang, Wang, B. Li.
Performed data analysis: Yuan, Zhang, Wang, L. Li.
Wrote or contributed to the writing of the manuscript: Yuan, Xu.
Footnotes
- Received November 14, 2021.
- Accepted February 7, 2022.
This work was supported by the National Science Foundation of China [Grants 81300251, 82073091, 81872253, and 80811621].
↵1W.Y., M.Z., and C.W. contributed equally to this study.
↵
 This article has supplemental material available at jpet.aspetjournals.org.

Abbreviations
- ALT
- alanine aminotransferase
- AST
- aspartate aminotransferase
- DMEM
- Dulbecco’s modified Eagle’s medium
- HFD
- high-fat diet
- LPO
- lipid peroxidase
- MDA
- malondialdehyde
- MMP
- mitochondrial membrane potential
- NAFLD
- nonalcoholic fatty liver disease
- NASH
- nonalcoholic steatohepatitis
- OA
- oleic acid
- RES
- resveratrol
- ROS
- reactive oxygen species
- SOD
- superoxide dismutase
- TG
- triglyceride
- Copyright © 2022 by The Author(s)
This is an open access article distributed under the CC BY-NC Attribution 4.0 International license.


