


Abstract
Bosentan, a well–known cholestatic agent, was not identified as cholestatic at concentrations up to 200 µM based on the drug-induced cholestasis (DIC) index value, determined in a sandwich-cultured human hepatocyte (SCHH)–based DIC assay. To obtain further quantitative insights into the effects of bosentan on cellular bile salt handling by human hepatocytes, the present study determined the effect of 2.5–25 µM bosentan on endogenous bile salt levels and on the disposition of 10 µM chenodeoxycholic acid (CDCA) added to the medium in SCHHs. Bosentan reduced intracellular as well as extracellular concentrations of both endogenous glycochenodeoxycholic acid (GCDCA) and glycocholic acid in a concentration-dependent manner. When exposed to 10 µM CDCA, bosentan caused a shift from canalicular efflux to sinusoidal efflux of GCDCA. CDCA levels were not affected. Our mechanistic model confirmed the inhibitory effect of bosentan on canalicular GCDCA clearance. Moreover, our results in SCHHs also indicated reduced GCDCA formation. We confirmed the direct inhibitory effect of bosentan on CDCA conjugation with glycine in incubations with liver S9 fraction.
SIGNIFICANCE STATEMENT Bosentan was evaluated at therapeutically relevant concentrations (2.5–25 µM) in sandwich-cultured human hepatocytes. It altered bile salt disposition and inhibited canalicular secretion of glycochenodeoxycholic acid (GCDCA). Within 24 hours, bosentan caused a shift from canalicular to sinusoidal efflux of GCDCA. These results also indicated reduced GCDCA formation. This study confirmed a direct effect of bosentan on chenodeoxycholic acid conjugation with glycine in liver S9 fraction.
Introduction
Pulmonary arterial hypertension is a rare and progressive disease characterized by an elevated pressure in the pulmonary arteries. Endothelin receptor antagonists such as bosentan block binding of endothelin-1 to its receptor, thereby preventing vasoconstriction (Humbert et al., 2004; Gabbay et al., 2007). During a European postmarketing surveillance study, it was documented that bosentan caused dose-dependent and reversible liver injury in 10.1% of the patients. For 3.2% of the patients, discontinuation of the therapy was necessary (Humbert et al., 2007). Consistently, elevations in liver function markers (liver aminotransferases and bilirubin) were already shown in 16.8% of the patients during clinical studies (Fattinger et al., 2001). For this reason, bosentan received a black box warning, which requires regular monitoring of the liver function markers during treatment.
Bosentan has been shown to cause cholestatic liver injury. Inhibition of bile salt transport and inhibition of bile salt secretion in particular has been attributed as one of the primary mechanisms of bosentan-induced cholestasis in several in vitro and in vivo studies (Fattinger et al., 2001; Kemp et al., 2005; Hartman et al., 2010; Xu et al., 2015). For instance, it was observed that bosentan inhibited the bile salt export pump (BSEP) function in BSEP-overexpressing membrane vesicles (Fattinger et al., 2001; Mano et al., 2007). Mano et al. (2007) reported that bosentan was able to inhibit human BSEP (IC50 = 77 µM) with comparable potency as rat BSEP (IC50 = 101 µM), whereas bosentan did not cause hepatotoxicity in rats (Fattinger et al., 2001). However, bosentan led to a stimulation of bile salt independent bile flow, rather than a reduction of the bile flow in rats (Fouassier et al., 2002). These results indicate that BSEP inhibition is not the sole determinant of bosentan-induced alterations of bile salt handling. Species-specific pathways or differences in bile salt pool may alleviate the cholestatic effects of bosentan due to BSEP inhibition in the rat, whereas this would not be the case, or would happen to a lesser extent, in humans. Both hypotheses have been postulated by Leslie et al. (2007) who proposed an explanation for this species difference in toxicity. They demonstrated that bosentan is a more potent inhibitor of rat sodium taurocholate cotransporting polypeptide (NTCP) as compared with human NTCP (Leslie et al., 2007). Moreover, next to BSEP and NTCP, bosentan can interact with several other transporters involved in bile salt homeostasis, as illustrated in Fig. 1. Bosentan is both an inhibitor and a substrate of the organic anion-transporting polypeptide (OATP) 1B1 and OATP1B3 (Treiber et al., 2007). In addition, bosentan was able to inhibit both multidrug resistance-associated proteins 3 and 4 in transporter-overexpressing membrane vesicles (Morgan et al., 2013). The unbound partition coefficient (Kpu,u) value of 34.9 for the liver estimated by Li et al. (2018) indicates that intracellular concentrations of bosentan are also relevant for inhibition of efflux transporters. To summarize, the interference of bosentan with bile salt homeostasis is likely not caused only by BSEP inhibition. The exact mechanisms playing a role in the effect of bosentan on bile salt handling remain poorly understood.

Interaction of bosentan with hepatic transporters and metabolic enzymes involved in bile salt homeostasis. Green arrows indicate that bosentan is a substrate for that particular transport protein or enzyme, and red inhibition signs illustrate the inhibitory effect of bosentan. BCRP, breast cancer resistance protein; MDR, multidrug resistance protein; MRP, multidrug resistance-associated protein. (A) Treiber et al. (2007). (B) Lepist et al. (2014). (C) Leslie et al. (2007). (D) Morgan et al. (2010); Dawson et al. (2012). (E) Mano et al. (2007). (F) Morgan et al. (2013). (G) Fouassier et al. (2002). (H) Matuszewski et al. (2003).
Previously, Rodrigues et al. (2018) demonstrated that bosentan was able to alter bile salt levels and inhibit BSEP function in human hepatoma HepaRG cell cultures. Of note, the effects observed in these in vitro experiments were typically obtained upon exposure to supratherapeutic bosentan concentrations (20–250 µM). Therefore, we presently examined the influence of clinically relevant bosentan concentrations (2.5–25 µM) (Dingemanse and van Giersbergen, 2004; Nakau et al., 2016; Berger et al., 2017). This approach was undertaken in an attempt to reveal previously unidentified mechanisms involved in bosentan-mediated alterations of bile salt handling in sandwich-cultured human hepatocytes (SCHHs). SCHHs were applied as a “gold standard” tool, as they preserve all enzymes as well as uptake and efflux transporters responsible for the hepatic drug disposition (De Bruyn et al., 2013). The regulating effects of nuclear receptors, which are expected to play an important role during long-term incubations, are also maintained in sandwich culture (Su and Waxman, 2004; Swift et al., 2010; Parmentier et al., 2018). Cellular pathways related to drug-induced cholestasis, such as mitochondrial toxicity and oxidative stress, have been demonstrated in sandwich-cultured hepatocytes (Yerushalmi et al., 2001; Sokol et al., 2005).
Materials and Methods
Sandwich-Cultured Human Hepatocytes
Cryopreserved human hepatocytes, kindly provided by KaLy-Cell (Plobsheim, France), were thawed as described previously (Almeida et al., 2002). See Supplemental Material for more details. The demographics and characteristics of the human batches used in this study are shown in Supplemental Table 1.
Hepatobiliary Disposition of Carboxydichlorofluorescein in SCHHs
Before the start of the experiments, the biliary secretory function in SCHHs was qualitatively evaluated, as described previously (Oorts et al., 2016). Biliary networks were visualized by 5-(6)-carboxy-2′,7′-dichlorofluorescein via fluorescence microscopy (excitation wavelength: 490 nm; emission wavelength: 520 nm).
Determination of Endogenous Bile Salts in Presence of Bosentan in SCHHs
SCHHs at day 5 of culture time were incubated with either DMSO (0.2%) in culture medium or bosentan (25 μM; 0.2% DMSO) dissolved in culture medium for 0.5, 4, or 24 hours. After each incubation time, culture medium samples were taken. Then, in case of the 0.5- and 4-hour time points, cells were washed twice with culture medium. Next, the cells were incubated for 23.5 and 20 hours, respectively, with culture medium (supplemented with 0.2% DMSO). This recovery period was included in the incubation design to investigate the reversibility of the possible effects of bosentan on the endogenous bile salt disposition. After 24 hours, culture medium samples were again taken, after which cells were washed three times with cold standard buffer. Finally, cells were lysed with 250 μl of 100% methanol (MeOH) containing internal standard [200 nM cholic acid-2,2,4,4-d4 (CA-d4)]. A schematic representation of the incubation protocol is shown in Fig. 2A.

Scheme illustrating the incubations performed in SCHHs. (A) Incubation protocol to investigate the effect of bosentan on the endogenous bile salts. (B) Representation of the accumulation study in the presence of 10 µM CDCA. Samples (indicated by arrows) were taken four times, namely, culture medium present on the hepatocytes (1), culture medium at time 0 (2), culture medium after the loading phase (3), and cell lysates (4). (C) Representation of the efflux study in the presence of 10 µM CDCA. In this setup, samples were taken five times: culture medium present on the hepatocytes (1), culture medium at time 0 (2), culture medium after the loading phase (3), buffer samples after efflux phase (4), and cell lysates (5).
Determination of Chenodeoxycholic Acid Disposition in Presence of Bosentan in SCHHs
SCHHs at day 5 of culture time were incubated with chenodeoxycholic acid (CDCA) in presence and absence of various concentrations of bosentan to determine the influence of bosentan on the overall CDCA disposition. A schematic representation of the protocols is provided in Fig. 2, including an accumulation study (Fig. 2B) and an efflux study (Fig. 2C).
During the accumulation study, the culture medium that was applied on the SCHHs at day 4 of culture time was sampled to determine the endogenous bile salt levels in SCHHs. Then, a loading phase was initiated by incubating the cells with 10 µM CDCA in presence and absence of bosentan at two different clinically relevant concentrations (Dingemanse and van Giersbergen, 2004; Nakau et al., 2016; Berger et al., 2017), namely, 7.5 or 25 μM (one and three times total Cmax, respectively; 0.2% final DMSO concentration; 250 μl/well) for different incubation times (0.5, 1, 4, 12, and 24 hours). A sample of culture medium from each well was taken at time 0 and after each loading time. Afterward, cells were washed three times with 250 µl per well ice-cold standard buffer and were subsequently lysed with 250 μl 100% MeOH containing internal standard (200 nM CA-d4) for 45 minutes.
During the efflux study, three different concentrations of bosentan, namely, 2.5, 7.5, and 25 μM (final DMSO concentration: 0.2%), were incubated together with 10 μM CDCA for different incubation times: 0.5, 1, 4, 12, and 24 hours. A culture medium sample of each well was taken at time 0, and after each loading time, another culture medium sample was collected. Afterward, the cells were washed two times with either ice-cold standard buffer or ice-cold Ca2+/Mg2+-free buffer (Ca2+/Mg2+-free Hanks’ balanced salt solution containing 1 mM EGTA, 10 mM HEPES and adjusted to pH 7.4) (250 μl/well). Subsequently, the SCHHs were incubated with prewarmed either standard or Ca2+/Mg2+-free buffer for 15 minutes. The amounts of CDCA and its conjugates taurochenodeoxycholic acid and glycochenodeoxycholic acid (GCDCA) found in the standard buffer represent the amounts that were effluxed across the sinusoidal membrane. The amounts of bile salts found in the Ca2+/Mg2+-free buffer represent the amounts of bile salts effluxed across both the sinusoidal and canalicular membrane. Depletion of Ca2+ and Mg2+ in the extracellular medium results in opening of tight junctions leading to the release of canalicular contents into the buffer (Liu et al., 1999). After 15 minutes, buffer samples in each well were collected, and cells were rinsed three times with ice-cold standard buffer. Finally, cells were lysed with 250 μl 100% MeOH containing internal standard (200 nM CA-d4) for 45 minutes. Medium samples taken at time 0 were diluted with four volumes of 100% MeOH containing internal standard (200 nM CA-d4), whereas all other medium and buffer samples were diluted with one volume of 100% MeOH containing internal standard. All samples were stored at −20°C prior to the day of analysis.
Glycine Conjugation of CDCA in Human Liver S9 Fraction
The conjugation reaction was performed as described previously (Thakare et al., 2018). In brief, the liver S9 fractions was incubated at a final concentration of 1 mg protein per milliliter in 100 mM potassium phosphate buffer containing 5 mM MgCl2 at pH 7.4. After preincubation for 10 minutes at 37°C with 10 µM or 50 µM CDCA in the presence and absence of 25, 85, and 250 µM bosentan, the prewarmed cofactor mixture was added to initiate the reaction. The cofactor mixture of consisted of 5 mM taurine, 5 mM glycine, 0.4 mM coenzyme A, 1 mM MgATP, 1 mM NADPH, and 3 mM glucose-6-phospate (final concentrations). The reaction mixture was incubated at 37°C for 60 minutes. Subsequently, the reaction was quenched by adding 100 µl of the reaction mixture to 100 µl ice-cold MeOH and vortexing. Samples were stored at −80°C until analysis.
Sample Preparation for Determination of Bile Salts
Samples taken from the culture medium at time 0 were further diluted with one volume of MeOH containing internal standard, whereas all other samples were processed undiluted. Next, medium, buffer, and lysate samples were centrifuged at 20,816g for 15 minutes at 4°C. Then, samples were evaporated until dryness using a rotary vacuum evaporator (Martin Christ Gefriertrocknungsanlagen GmbH, Osterode am Harz, Germany) and reconstituted in a mixture of 50:50 MeOH:ammonium acetate buffer with acetic acid (5 mM; adjusted to pH 3.5). Samples were vortexed for 1 minute and stored at −20°C. At the day of analysis, samples were centrifuged again at 20,816g for 15 minutes at 4°C and transferred into micro-inserts for liquid chromatography–tandem mass spectrometry analysis.
Bioanalysis of Bile Salts
Bile salt analysis was performed with an Accela U-HPLC system (Thermo Fisher, Breda, The Netherlands) coupled to a TSQ Quantum Access triple quadrupole mass spectrometer, equipped with an electrospray ionization source. Data acquisition and peak integration were performed with the XcaliburR 2.0.7 and LCquanR 2.5.6 software packages, respectively. A Kinetex XB-C18 column (2.6 μm, 100 Å, 50 × 2.1 mm) with an in-line KrudKatcher ultra HPLC filter (Phenomenex, Utrecht, The Netherlands) was used for optimal separation. The total run time was 12 minutes, and the injection volume was 25 μl (full loop mode). The column oven and sample tray temperatures were set at 30 and 15°C, respectively. The flow rate was 450 μl/min. The bile salts were eluted using a gradient (Supplemental Table 2).
Analysis was performed using negative electrospray ionization mode with the following parameters: capillary temperature 275°C, vaporizer temperature 300°C, sheath gas (N2) pressure 40 (arbitrary units), auxiliary gas (N2) pressure 45 (arbitrary units), ion sweep pressure 20 (arbitrary units), spray voltage 3,500 V, and collision gas (Ar) 1.5 mTorr. Parent and daughter m/z ratios together with collision energies are shown in Supplemental Table 3. Three groups of bile salts show identical masses and daughter ions, for which they were separated using liquid chromatography. Quality control concentrations were 50, 500, and 2,000 nM. Intra- and interday precision of these quality control samples were below 15% for the high and middle high concentration and below 20% for the low concentration. The calibration curves were linear in a range between 9.8 and 5,000 nM.
Data Analysis
During the efflux study, cells were incubated either with standard buffer to determine sinusoidal efflux only or with Ca2+/Mg2+-free buffer to determine sinusoidal and canalicular efflux simultaneously (“total efflux”). Canalicular efflux was calculated by subtracting the amount of bile salts obtained in standard buffer from the amount of bile salts obtained in Ca2+/Mg2+-free buffer. After the efflux phase, the cells were lysed. Lysates of cells that had been treated with standard buffer represent the residual amounts in the cells plus canaliculi, whereas lysates of cells treated with Ca2+/Mg2+-free buffer represent the residual amounts in cells only.
The intracellular concentration after loading was calculated by taking the sum of the amount of bile salts in standard buffer after efflux (i.e., the sinusoidal efflux) and the lysates from the conditions that were treated with Ca2+/Mg2+-free buffer after efflux (cells only). Intracellular bile salt concentrations were calculated based on the ratio of the intracellular amounts of bile salts and the total hepatocyte volume of 1.37 µl per 200,000 cells. This volume was based on the mean value of 6.85 pl per cell for human hepatocytes (Matsui et al., 1996; Morales-Navarrete et al., 2015). A total of 250,000 cells were seeded per well, and an 80% attachment rate was assumed.
The sinusoidal efflux clearance (nL/min) was calculated according to the following equation:


For both equations, the area under the curve (AUC) value was calculated using the PKNCA package in R version 3.6.2. The intracellular AUC was calculated from the mean decrease in intracellular bile salts during an efflux phase of 15 minutes, initiated after each loading phase.
To elucidate differences between disposition profiles of CDCA and its conjugate GCDCA in the absence or presence of bosentan, mean AUC (± S.D.) values were calculated, using the PKNCA package in R version 3.6.2. To test whether the AUCs differed statistically significantly from the control, Dunnett’s test was applied. In addition, this statistical test was also used to compare the conditions with bosentan and control conditions. A two-tailed unpaired t test was applied to evaluate difference between two groups. P values were considered to be statistically significant when P was smaller than 0.05.
Mechanistic Modeling of Bile Salt Disposition
Mechanistic modeling was performed in NONMEM version 7.4 (ICON Development Solutions, Gaithersburg, MD) using first-order conditional estimation with interaction to estimate the parameters. ADVAN13 was selected as differential equation solver. The structural model was based on the experimental design and previously established models (Fig. 3A) (Pfeifer et al., 2013; Yang et al., 2015; Guo et al., 2016; Keemink et al., 2018). The amount of CDCA administered to compartment 1 was calculated based on the mean measured amount of CDCA in the culture medium at time 0 for all conditions. Since the amounts of CDCA in the canaliculi were negligible at all time points and almost no CDCA is found in human bile (Matsson et al., 2009), no biliary compartment of CDCA was included in the structural model. Vmed was defined as the incubation volume (250 μl). The total intracellular volume (Vcell) was fixed to 1.37 μl based on the mean of two literature values (Matsui et al., 1996; Morales-Navarrete et al., 2015). Only unbound intracellular concentrations of CDCA and GCDCA (fucell,CDCA and fucell,GCDCA, respectively) were considered to be available for clearance processes. kflux represents the first-order rate constant for the release of canalicular contents due to periodical canalicular contractions (Guo et al., 2016). The parameters were estimated in a stepwise approach. First, CDCA uptake and clearance were explored in the absence of bosentan with GCDCA amounts in all compartments combined (Supplemental Fig. 1A). Linear as well as Michaelis-Menten kinetics were evaluated. Second, the GCDCA disposition was investigated with CDCA parameters fixed to the values obtained in the previous step (Supplemental Fig. 1B). Finally, all parameters were estimated simultaneously, and bosentan was examined as a categorical covariate on the biliary clearance of GCDCA (CLbile,GCDCA), the efflux clearance of GCDCA (CLeff,GCDCA), and the metabolic clearance of CDCA (CLmet,CDCA). Models were evaluated based on drop in the objective function value (OFV) (α = 0.05) and the following diagnostic plots: observations versus population predictions (PRED), conditional weighted residuals (CWRES) versus PRED, and CWRES versus time. All error was included as residual variability. Several residual error models were tested, of which three were retained. Because the amounts in compartments 3 and 4 were calculated based on independent measurements, multiple imputation was performed with 5,000 out of 3.43 × 10143 possible combinations using the bootstrap function of Pearl-speaks-NONMEM. This allowed evaluation of the robustness of the parameter estimates. In addition, the error model with the most successful runs was considered the best model. The median parameter estimates of the best model were used to simulate the amount of CDCA and GCDCA in each compartment for 10,000 in vitro experiments per bosentan concentration. The AUC in each compartment was computed based on these simulations using the PKNCA package in R version 3.6.2.

Mechanistic model used to describe the data. (A) Predetermined structural model used to estimate the parameters involved in CDCA and GCDCA disposition. CDCAmed and CDCAcell represent the amounts of CDCA in medium and cell, respectively. GCDCAmed, GCDCAcell, and GCDCAbile represent the amounts of GCDCA in medium, cell, and bile, respectively. Vmed and Vcell were defined as the incubation volume (250 μL) and total intracellular cell volume (1.37 μL), respectively. Km,up,CDCA and Vmax,up,CDCA represent the Michaelis-Menten constant and maximum uptake velocity of CDCA, respectively. CLmet,CDCA was defined as the metabolic clearance of CDCA, CLbile,GCDCA as the biliary clearance of GCDCA, CLeff,GCDCA as the efflux clearance of GCDCA and CLup,GCDCA as the uptake clearance of GCDCA into the hepatocytes. Kflux represents the first order rate constant for the release of canalicular contents due to periodical canalicular contractions. (B) Observed and simulated amounts of CDCA and GCDCA in each compartment for different bosentan concentrations. The solid black line indicates the mean amounts. The gray lines indicate the 95% prediction interval. For compartments 3 and 4, all possible calculated amounts for the imputation procedure are depicted.
Results
The Influence of Bosentan on Endogenous Bile Salts in SCHHs
Endogenous Bile Salts in SCHHs at Day 5 of Culture Time
Endogenous bile salts were detected in the culture medium of SCHHs at day 5 of culture time. The culture medium was replaced daily (every 24 hours). Bile salts that were measured in the medium were thus newly synthesized or already present inside the cells and effluxed during the 24-hour time window. GCDCA and glycocholic acid (GCA) were the main bile salts present in the culture medium. Others could not be detected (Supplemental Table 3). Supplemental Fig. 2 shows the concentration of both bile salts in the culture medium. GCA levels were 11.6-fold higher than GCDCA levels.
The Influence of Bosentan on Endogenous Bile Salts in the Culture Medium of SCHHs
The amount of GCDCA in the culture medium significantly increased with 40.4, 45.5, and 43.4% as compared with the control when SCHHs were incubated with 25 µM bosentan for 0.5, 4, and 24 hours, respectively (Fig. 4A). Bosentan increased the amount of GCA with 20.3 and 10.4% as compared with the control in the culture medium after a 0.5-hour and 4-hour incubation, respectively, whereas a significant decrease of GCA accumulation (33.7%) was observed after 24 hours (Fig. 4B). After incubation times of 0.5 and 4 hours, culture medium without bosentan was added to evaluate whether the cells would be able to (partially) recover from the effects of bosentan on bile salt disposition. As shown in Fig. 4, C and D, the relative amounts of GCDCA and GCA were similar to the controls (no bosentan exposure) after a 0.5-hour treatment of bosentan followed by a 23.5-hour recovery period, whereas GCA decreased with 16.9% after a 4-hour treatment of bosentan followed by a recovery of 20 hours when compared with the control condition.
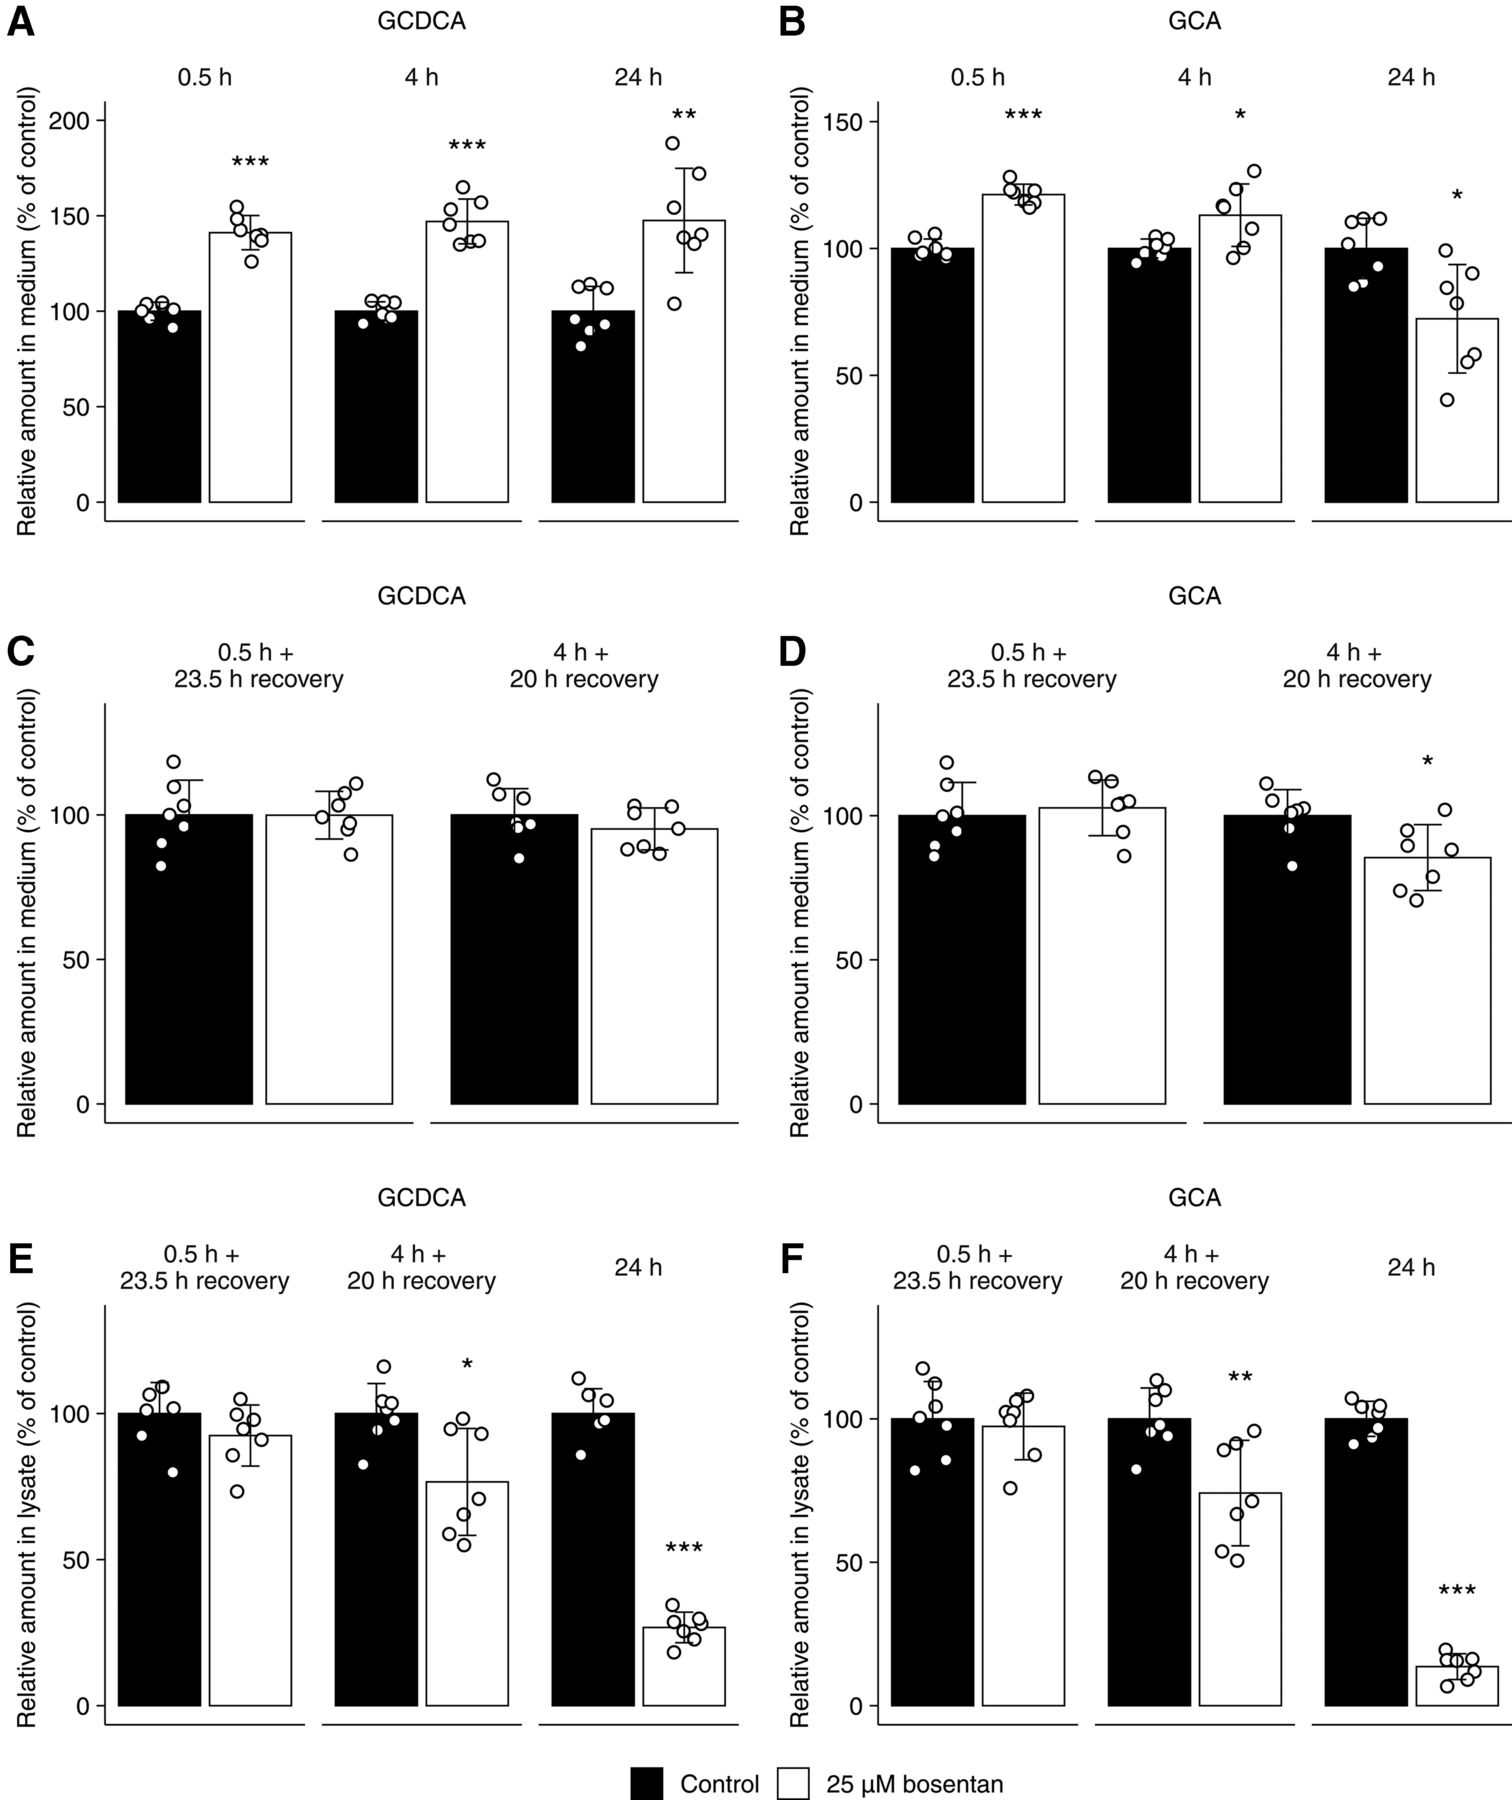
The relative amount (percentage of control) of the endogenous bile salts GCDCA and GCA present in the culture medium (A–D) or in the lysate of cells and canaliculi combined (E, F) of SCHHs. Samples were taken at day 6 of culture time in absence (0.2% DMSO, black) or presence of bosentan (25 μM, white). (A, B) Exposure periods were 0.5, 4, and 24 hours. Other bile salts were not detected in the medium as analyzed by liquid chromatography coupled to tandem mass spectrometry (lower limit of quantification = 9.8 nM). (C, D) Exposure periods were 0.5 hours followed by a recovery phase of 23.5 hours and 4 hours followed by a recovery phase of 20 hours (total incubation time of 24 hours). (E, F) Exposure periods were 0.5 hours followed by a recovery phase of 23.5 hours, 4 hours followed by a recovery phase of 20 hours, and 24 hours. Bars represent means (± S.D.) of the amount (pmol) of GCDCA and GCA in two batches of human hepatocytes (three and four replicates from donor numbers 1 and 2, respectively). Conditions were compared with the control condition using a two-tailed unpaired t test. *P < 0.05; **P < 0.01; ***P < 0.001.
The Influence of Bosentan on the Intracellular Endogenous Bile Salts in SCHHs
Figure 4, E and F shows that bosentan did not alter the intracellular accumulation of GCDCA and GCA after a 0.5-hour treatment, followed by a recovery period of 23.5 hours. The intracellular accumulation of both bile salts was significantly decreased in the SCHHs treated with bosentan for 4 hours followed by a recovery period of 20 hours and after 24-hour treatment with bosentan. The reductions after 4 hours followed by a recovery period of 20 hours amounted to 22.3 and 24.2% for GCDCA and GCA, respectively. After 24 hours, the presence of bosentan resulted in a 73.5 and 86.9% reduction in accumulated levels of GCDCA and GCA, respectively.
The Influence of Bosentan on CDCA Disposition in Day 5 SCHHs
The Influence of Bosentan on CDCA Disposition Was First Assessed Over 24 Hours by Quantifying CDCA and GCDCA in Medium and Cultures in Function of Time
The mean amount (± S.D.) of CDCA measured in the culture medium of all conditions at time 0 (immediately after addition of the dosing solution with nominal concentration of 10 µM) comprised 2,574 ± 296 pmol (equal to 10.3 ± 1.2 μM). This concentration of CDCA was chosen, based on our previous investigations on the toxicity of CDCA in SCHHs, by measuring the capacity of the hepatocytes to produce urea. Indeed, in exposed SCHHs, CDCA caused no decrease in urea production up to 200 µM. During the incubation with CDCA, hepatocytes are able to support glycine or taurine conjugation. Consistent with earlier findings (Marion et al., 2012), only GCDCA, but not taurochenodeoxycholic acid, was detected in SCHHs exposed to CDCA.
The disappearance profiles for CDCA in the medium are shown in Supplemental Fig. 3, suggesting saturable uptake. The corresponding AUCs of CDCA are depicted in Supplemental Table 4. The presence of bosentan (2.5–25 µM) did not affect the CDCA disappearance profile and corresponding AUCs. After 24 hours, CDCA was no longer detected in the culture medium. Within 24 hours, the hepatocytes conjugated virtually all CDCA to GCDCA, followed by the efflux of GCDCA back into the medium. A time-dependent increase in the amount of GCDCA in the culture medium was observed in all conditions tested.
The accumulated amounts after loading the cells with CDCA comprise the total amount in both cells and canaliculi (Fig. 5). A time-dependent decrease in CDCA levels was observed, whereas the accumulated GCDCA levels initially increased, reaching steady state after 4 hours of incubation time. After 24 hours, accumulated levels of CDCA were below the quantification limit. Bosentan (7.5–25 µM) appeared to decrease steady-state levels of GCDCA from 12 hours onward, resulting in a significantly reduced AUC as compared with the control (Fig. 5B and Table 1).
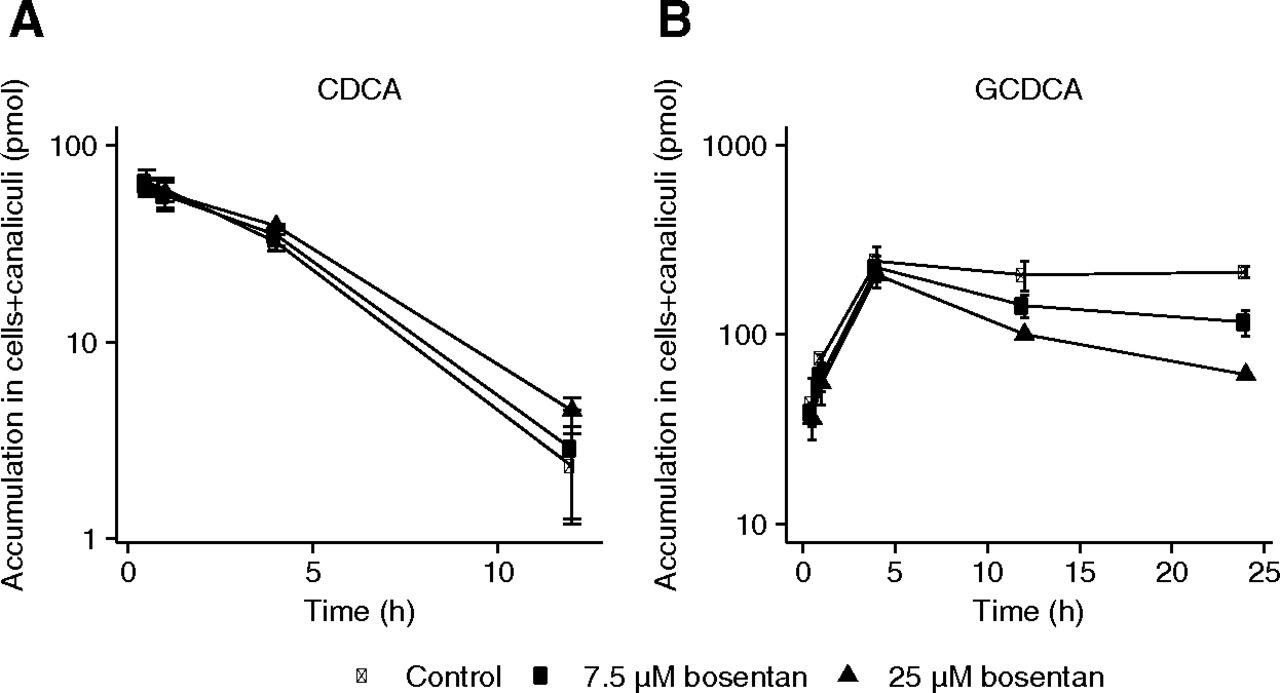
Time-dependent accumulation of CDCA (10 μM) (A) and GCDCA (B) in cells and canaliculi of SCHHs after various exposure periods (0.5, 1, 4, 12, and 24 hours) with 10 µM CDCA in absence (closed circles) or in presence of bosentan (7.5 μM: open circles and 25 μM: triangles). Each point represents mean (± S.D.) accumulation of bile salts obtained from triplicate measurements in one batch of SCHHs (donor number 3). Conditions were compared with the control condition (i.e., closed circles). *P < 0.05; **P < 0.01; ***P < 0.001.
AUC values representing accumulation of CDCA and GCDCA in cells and canaliculi of SCHHs in absence or presence of bosentan, based on measurements obtained after various loading periods (0.5, 1, 4, 12, and 24 hours) with 10 µM CDCA.
The Influence of Bosentan on In Vitro Biliary Secretion of GCDCA Based on an Efflux Incubation Design
After exposure of SCCH for predetermined incubation times, 15-minute efflux experiments with standard and Ca2+/Mg2+-free buffers in parallel were conducted to indirectly determine secretion to canalicular compartments. For CDCA, very limited secretion was observed due to extensive intracellular metabolism (Supplemental Fig. 4). The corresponding AUC values for CDCA efflux indicated that bosentan did not influence the CDCA efflux as a function of time (data not shown). GCDCA showed comparable efflux rates across the sinusoidal and canalicular membranes (control conditions; Fig. 6A). Importantly, in the presence of bosentan, GCDCA efflux rates gradually decreased. This was also reflected by significantly decreased AUC values as compared with the control condition (Table 2).
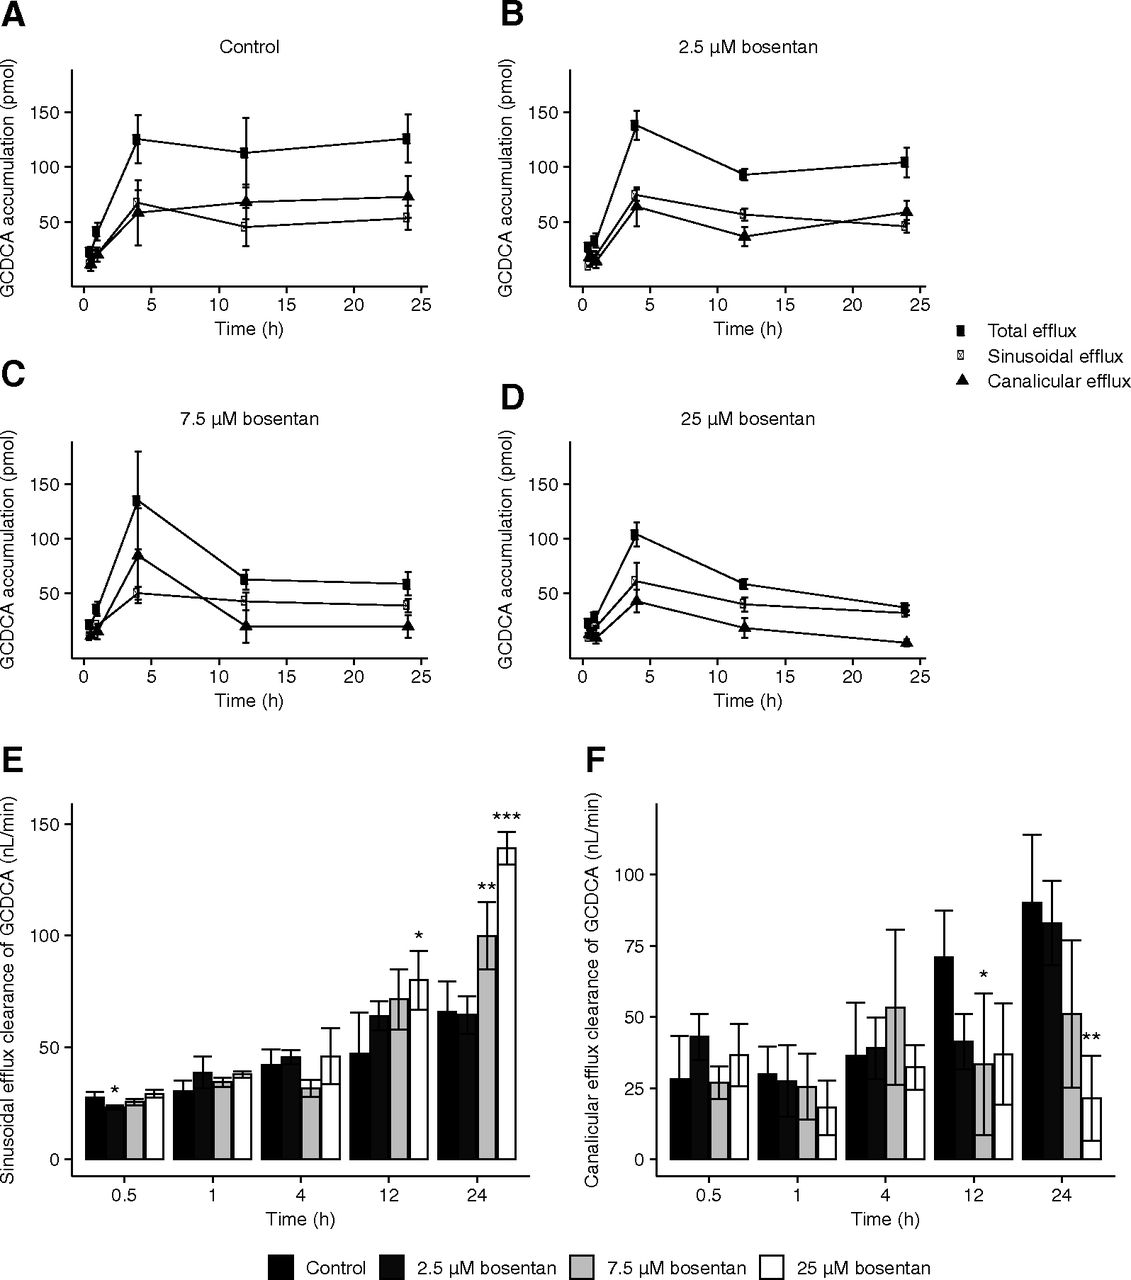
Efflux and efflux clearances of GCDCA observed in SCHHs in absence and presence of bosentan. (A), (B), (C), (D) Efflux of GCDCA from SCHHs as measured over a 15-minute efflux experiment after various loading periods (0.5, 1, 4, 12, and 24 hours) with 10 µM CDCA in absence [control: (A)] or presence of bosentan [2.5 μM: (B), 7.5 μM: (C), 25 μM: (D)]. After each loading time, a 15-minute efflux phase was initiated with either standard (sinusoidal efflux: closed circles) or Ca2+/Mg2+-free buffer (total efflux: open circles) and buffer samples were analyzed. Data obtained in standard buffer were subtracted from data obtained in Ca2+/Mg2+-free buffer to account for canalicular efflux (triangles). Each point represents mean (± S.D.) accumulation in buffers of bile salts obtained from four measurements in one batch of SCHHs (donor number 3). Sinusoidal (E) and canalicular (F) efflux clearance (nL/min) of GCDCA observed in SCHHs in absence or presence of bosentan (7.5 and 25 μM) and an efflux phase for 15 minutes. Sinusoidal and canalicular efflux clearances are calculated as described in Materials and Methods. Bars represent mean (± S.D.) efflux clearance values of GCDCA in one batch of SCHHs (donor number 3) with quadruplicate measurements. Conditions were compared with the control condition. *P < 0.05; **P < 0.01; ***P < 0.001.
AUC values representing sinusoidal, canalicular and total efflux of GCDCA by SCHHs, measured over 15 minutes after various loading periods (0.5, 1, 4, 12, and 24 hours) with 10 µM CDCA in absence or presence of bosentan.
Bosentan was able to reduce the residual intracellular amounts of GCDCA after loading followed by an efflux phase of 15 minutes (Supplemental Fig. 5). Over time, the amount of GCDCA in the cells and cells plus canaliculi increased linearly up to 4 hours of incubation. After 4 hours, a decrease of GCDCA was observed, suggesting secretion of GCDCA. This decrease was less pronounced in the cells plus canaliculi as compared with cells only, implying that GCDCA is effluxed both across the sinusoidal and canalicular membranes. The bosentan-induced alterations of the accumulated amounts of GCDCA in cells or cells plus canaliculi in function of time are also reflected by decreases in the corresponding AUC values as the bosentan concentration increases (Supplemental Table 5). The residual intracellular amounts of CDCA were not altered by bosentan (Supplemental Fig. 6).
The Influence of Bosentan on the Sinusoidal and Canalicular Efflux Clearances of CDCA and GCDCA in SCHHs
The sinusoidal and canalicular efflux clearances for GCDCA are represented in Fig. 6, E and F. A time-dependent increase in sinusoidal efflux clearance was observed in the control conditions. Bosentan did not affect the clearance up to 12 hours. After 24 hours, the presence of bosentan increased the sinusoidal efflux clearance of GCDCA (Fig. 6E). Similarly, a time-dependent increase in canalicular efflux clearance was observed in the control conditions (Fig. 6F). In presence of bosentan, the canalicular efflux clearance was decreased after 24 hours, suggesting that bosentan was able to inhibit the canalicular efflux pathways of GCDCA (e.g., via BSEP).
Determination of Unbound Fractions
Unbound fractions of CDCA and GCDCA in presence of human hepatocytes were determined using equilibrium dialysis. Values for unbound fractions of CDCA (fucell,CDCA) and GCDCA (fucell,GCDCA) were 0.654 ± 0.073 and 0.805 ± 0.280, respectively.
Mechanistic Modeling for Further Elucidation of the Effects of Bosentan on CDCA and GCDCA Hepatobiliary Disposition in SCHHs
The structural model developed for CDCA and GCDCA disposition in SCHHs is shown in Fig. 3A. Saturable uptake and linear metabolism were implemented for CDCA. All GCDCA-related clearances were linear. Covariate testing showed that the effect of bosentan exposure was the most pronounced on CLbile,GCDCA by means of a drop in OFV (Table 3). In addition, the individual predictions showed better agreement with the observed values. The diagnostic plots of the final model do not show a clear trend, although there is some deviation in the CWRES versus PRED and CWRES versus time plots (Supplemental Fig. 7). The predicted amounts are in good agreement with the observed values (Supplemental Fig. 8). Inclusion of bosentan as a covariate on CLeff,GCDCA especially improved the predictions in compartment 4. The amounts in compartment 2 (cellular amount of CDCA) were not completely captured. Incorporation of additional parameters, for example, an extra clearance parameter for CDCA (linear and nonlinear), did not result in improved predictions of intracellular CDCA amounts.
Effect of bosentan as a categorical covariate on different model parameters.
The design of the experiments necessitated the performance of prior calculations to determine the amounts in compartments 3 and 4. For initial model development, the values were subtracted from each other based on the replicate number. Because these values were obtained from different wells, a multiple imputation sensitivity analysis was performed in the final model. We selected the best error model based on the most successful runs and used the resulting median parameter estimates for simulations. The best model resulted in 4,495 of 5,000 (89.9%) successful minimizations. In this model, residual variability was implemented as combined proportional error for compartments 1 and 5, combined proportional error for compartments 2 and 3, and additive error for both compartments 2, 3 and 4 separately. Median parameter estimates and residual error with 95% confidence interval (CI) are represented in Table 4. The simulated amounts of CDCA or GCDCA in each compartment are depicted in Fig. 3B.
Median population estimates and residual error with 95% CI after 4,495 successful imputations.
The parameter estimates show that bosentan significantly alters the biliary clearance of GCDCA. The simulated intracellular CDCA and GCDCA amounts over time (compartments 2 and 3, respectively) are quasi-unaltered by increasing bosentan concentrations.
Bosentan Inhibits Glycine Conjugation of CDCA in Liver S9 Fraction
Because bosentan reduced intracellular GCDCA amounts of both endogenous and exogenous bile salts, we further investigated the effect of bosentan on glycine conjugation of CDCA in liver S9 fraction. The previously reported liver Kpu,u value for bosentan of about 35 illustrates significant accumulation of bosentan in hepatocytes relative to plasma (Li et al., 2018). Based on this, bosentan concentrations of 25 µM (three times total Cmax), 85 and 250 µM were selected for the in vitro incubations with liver S9 fraction. Bosentan at 85 and 250 µM significantly reduced glycine conjugation with respect to the control when incubated with both 10 and 50 µM CDCA (Fig. 7).

Effect of several bosentan concentrations on the glycine conjugation of CDCA to GCDCA in liver S9 fraction. Bosentan reduced GCDCA formation in the presence of 85 µM and 250 µM bosentan when incubated for 60 minutes with both 10 µM and 50 µM CDCA. Conditions were compared with the control condition. *P < 0.05; **P < 0.01; ***P < 0.001.
Discussion
We previously introduced a holistic in vitro screening assay to investigate the cholestatic propensity of a given compound. In this assay, bosentan was not identified as cholestatic at concentrations up to 200 µM (Chatterjee et al., 2014b; Oorts et al., 2016; Van Brantegem et al., 2020). To explain this result, the present study aimed to explore the mechanisms governing the bosentan-induced disturbance in bile salt homeostasis in SCHHs. Bile salt disposition profiling in SCHHs was considered to be highly valuable. Measuring intra- and extracellular bile salt levels could provide an earlier and more sensitive marker for a drug-induced cholestasis (DIC) signature.
The anticipated effects of bosentan (25 μM) on bile salt homeostasis were first evaluated by profiling endogenous bile salts in SCHHs. Bosentan caused substantial alterations of the in vitro hepatic disposition of endogenous GCDCA and GCA. These findings are consistent with a mechanistic hypothesis of bosentan-mediated inhibition of formation of glycine conjugates, along with inhibition of transporter-mediated reuptake of glycine-conjugated bile salts. This reuptake inhibition is in accordance with the early masking of overall inhibition of bile salt synthesis. As illustrated in Fig. 1, both OATP and NTCP are known to mediate bile salt uptake, and both transporters are inhibited by bosentan (Hartman et al., 2010; Lepist et al., 2014). In addition, inhibition of biliary secretion of GCDCA and GCA by bosentan may also explain the effect on medium levels at later time points. Indeed, bile canaliculi in SCHHs are known to contract with certain intervals, thereby releasing intracanalicular contents in the medium (Oshio and Phillips, 1981; Phillips et al., 1982). Bile salts that are already present in these canaliculi may increase medium levels in the first hours after start of the incubation. However, at later time points, these canaliculi will also be depleted of GCA and GCDCA, contributing to decreased medium levels. Another mechanism possibly explaining the increased medium levels is a shift from canalicular to sinusoidal clearance of bile salts. Based on the results for endogenous bile salts, we hypothesized that bosentan inhibits both de novo synthesis of bile salts and the conjugation of unconjugated bile salts. In this case, the cells were not able to fully reestablish the bile salt levels during the recovery phase due to the potentially inhibited synthesis or conjugation. Overall, these findings are in accordance with Lepist et al. (2014) who showed that bosentan at concentrations of 10 and 100 μM were able to decrease the amount of GCA and GCDCA in the cells, whereas only in case of GCA a decrease was seen in the culture medium after 24 hours.
In a second phase of this research, we challenged the SCHHs with an intermediate, yet non-cytotoxic, concentration of exogenously added CDCA (10 µM) to evaluate the bile salt processing capacity of the hepatocytes in presence of different bosentan concentrations (2.5–25 µM). CDCA and its metabolite GCDCA have been used as prototypic bile salts of interest for the following reasons: 1) The levels of both bile salts comprise more than 40% of the total serum bile salt pool in human plasma (Gnewuch et al., 2009; Scherer et al., 2009; Xiang et al., 2010). 2) Both bile salts play an important role in the onset of bile salt–induced toxicity, eventually leading to cholestasis (Lepist et al., 2014). 3) Finally, hepatocytes have the capability to convert CDCA to GCDCA. Another strength of the present experimental design over previously performed studies is the use of clinically relevant bosentan concentrations, i.e., 2.5, 7.5, and 25 μM, in a protein-containing medium (Dingemanse and van Giersbergen, 2004; Dawson et al., 2012). In contrast, most previously conducted in vitro studies showed the effects of bosentan using very high concentrations up to 300 μM (Rodrigues et al., 2018).
Sinusoidal efflux of bile salts becomes more important with increasing levels of bile salts in the blood (or in the culture medium in vitro) as a result (Soroka et al., 2001; Boyer et al., 2006; Chatterjee et al., 2014a). In addition, bosentan was expected to block reuptake of conjugated bile salts by inhibition of NTCP and OATP1B1 and 1B3 (Leslie et al., 2007; Treiber et al., 2007). However, the unaltered levels of CDCA and GCDCA in the medium contradict this (Supplemental Fig. 3). Augmented intracellular bosentan concentrations as compared with the concentrations in the medium might contribute to this effect. Recently, it has been predicted that the in vitro Kpu,u value of bosentan is 34.9 (95% CI 4.2–50) (Li et al., 2018), resulting in an accumulation of bosentan in the liver, depletion in the medium, and the reduced ability to inhibit uptake transporters. Moreover, bosentan is also extensively metabolized by CYP2C9 and CYP3A4, and the role of its metabolites has not been fully elucidated yet (Markova et al., 2013).
The significant effect of bosentan as covariate on CLbile,GCDCA in the final model is consistent with the current hypothesis that BSEP inhibition plays a role in bosentan-induced cholestasis. Bosentan is a known BSEP inhibitor with a reported IC50 value of 42.1 µM (Lepist et al., 2014). Paradoxically, we observed a reduced intracellular GCDCA accumulation. However, we confirmed the inhibitory effect of bosentan on glycine conjugation of CDCA, which at least partially explains this observation. Reduced glycine conjugation of CDCA (and deoxycholic acid) has also been observed for other cholestatic agents such as troglitazone (Ogimura et al., 2017). The apparent absence of an effect on the intracellular CDCA accumulation could be caused by a reduced CDCA synthesis as a result of inhibition of the conversion of CDCA to GCDCA. Initial short-term increased CDCA levels might have activated a feedback mechanism, preventing de novo CDCA synthesis.
Adding bosentan as a covariate on CLeff,GCDCA did not result in a significant drop in OFV when additionally added to the model with bosentan as covariate on CLbile,GCDCA. Nevertheless, we expect increased sinusoidal efflux to be an important compensatory mechanism for DIC. In addition, the effect of bosentan on CLmet,CDCA was not significant. The relatively large variability of the data in compartments 3 and 4 (Fig. 3B) might contribute to the absence of this effect, potentially masking alterations of CLmet,CDCA induced by bosentan. A clear trend toward lower intracellular GCDCA levels (compartment 3) can be observed, as is also evident from Supplemental Fig. 5. In line with the unaltered CDCA and GCDCA levels in the medium (Supplemental Fig. 3), the simulations did not show an effect of bosentan on CDCA uptake. Nevertheless, the concentrations of CDCA in compartment 1 (medium) for all bosentan concentrations are slightly overpredicted, which might indicate initial inhibition of CDCA uptake by bosentan. The model provided insight in the concentration-dependent effect of bosentan on the disposition of CDCA and GCDCA. Subsequent implementation in a physiologically-based pharmacokinetic model will enable studying the effect of bosentan on bile salt disposition in a mathematically more complex but mechanistically more relevant system. This will shed more light on the bile salt alterations in an in vivo environment in which enterohepatic circulation of bile salts also takes place. Ultimately, this might lead to the identification of a novel biomarker for DIC.
It must be noted that we explored the effect of bosentan on the disposition of a single bile salt. Nevertheless, in vivo, a complex bile salt pool (and not a single bile salt) serves to maintain a healthy environment for the hepatocytes (Woolbright and Jaeschke, 2015). The effects of a drug on bile salt homeostasis cannot be attributed solely to a single bile salt, and this should be considered when interpreting the current results. The metabolites of bosentan might also have an effect. For instance, Fattinger et al. (2001) have shown that the metabolite Ro 47-8634 (O-demethylation of the phenolic methyl ether of bosentan by CYP3A4) appeared to inhibit BSEP more potently than its parent. Whether other metabolites are also responsible for the disturbance of bile salt homeostasis and to what extent could serve as an interesting hypothesis for further studies. In addition, it would be extremely valuable to evaluate other endothelin receptor antagonists, like macitentan, sitaxentan, and ambrisentan, for their ability to disturb bile salt homeostasis in vitro. This may support further validation of this in vitro assay in terms of predicting a cholestatic risk in vivo.
In conclusion, the current data provided unique insight into the overall interference of clinically relevant bosentan concentrations with bile salt disposition in SCHHs. Bosentan altered both the endo- and exogenous bile salt handling. Mechanistic modeling revealed inhibition of the biliary clearance of GCDCA as predominant mechanism. Moreover, our data also indicated reduced GCDCA formation. We confirmed that this resulted from a direct effect of bosentan on CDCA conjugation with glycine. The reduction in biliary GCDCA output seemed to result in an initial shift toward sinusoidal efflux but also in reduced GCDCA formation. The metabolites of bosentan may be involved in additional mechanisms of cholestasis observed in the presence of bosentan.
Authorship Contributions
Participated in research design: Oorts, Van Brantegem, Deferm, Chatterjee, Cooreman, Vinken, Richert, Annaert.
Conducted experiments: Oorts, Van Brantegem, Deferm.
Performed data analysis: Oorts, Van Brantegem, Dreesen, Annaert.
Wrote or contributed to the writing of the manuscript: Oorts, Van Brantegem, Deferm, Chatterjee, Dreesen, Cooreman, Vinken, Richert, Annaert.
Footnotes
- Received April 25, 2021.
- Accepted July 28, 2021.
↵1 M.O. and P.V.B. contributed equally to this work as first authors.
This research was supported by a research grant of the Research Foundation Flanders [Grant G012318N]. E.D. is a postdoctoral research fellow of the Research Foundation Flanders (FWO), Belgium [Grant 12X9420N].
↵
 This article has supplemental material available at jpet.aspetjournals.org.

Abbreviations
- AUC
- area under the curve
- BSEP
- bile salt export pump
- CA-d4
- cholic acid-2,2,4,4-d4
- CDCA
- chenodeoxycholic acid
- CI
- confidence interval
- CLbile,GCDCA
- biliary clearance of GCDCA
- CLeff,GCDCA
- efflux clearance of GCDCA
- CLmet,CDCA
- metabolic clearance of CDCA
- CWRES
- conditional weighted residuals
- DIC
- drug-induced cholestasis
- GCA
- glycocholic acid
- GCDCA
- glycochenodeoxycholic acid
- MeOH
- methanol
- NTCP
- sodium taurocholate cotransporting polypeptide
- OATP
- organic anion-transporting polypeptide
- OFV
- objective function value
- PRED
- population predictions
- SCHH
- sandwich-cultured human hepatocyte
- Copyright © 2021 by The American Society for Pharmacology and Experimental Therapeutics


