


Abstract
Mitochondrial damage is considered a hallmark of drug-induced liver injury (DILI). However, despite the common molecular etiology, the evolution of the injury is usually unpredictable, with some cases that are mild and reversible upon discontinuation of the treatment and others characterized by irreversible acute liver failure. This suggests that additional mechanisms of damage play a role in determining the progression of the initial insult. To uncover novel pathways potentially involved in DILI, we investigated in vitro the metabolic perturbations associated with nefazodone, an antidepressant associated with acute liver failure. Several pathways associated with ATP production, including gluconeogenesis, anaerobic glycolysis, and oxidative phosphorylation, were altered in human hepatocellular carcinoma–derived (Huh7) cells after 2-hour exposure to a 50 μM extracellular concentration of nefazodone. In the presence or absence of glucose, ATP production of Huh7 cells was glycolysis- and oxidative phosphorylation–dependent, respectively. In glucose-containing medium, nefazodone-induced ATP depletion from Huh7 cells was biphasic. Huh7 cells in glucose-free medium were more sensitive to nefazodone than those in glucose-containing medium, losing the biphasic inhibition. Nefazodone-induced ATP depletion in primary cultured mouse hepatocytes, mainly dependent on oxidative phosphorylation, was monophasic. At lower extracellular concentrations, nefazodone inhibited the oxygen consumption of Huh7 cells, whereas at higher extracellular concentrations, it also inhibited the extracellular acidification. ATP content was rescued by increasing the extracellular concentration of glucose. In conclusion, nefazodone has a dual inhibitory effect on mitochondrial-dependent and mitochondrial-independent ATP production.
SIGNIFICANCE STATEMENT Mitochondrial damage is a hallmark of drug-induced liver injury, yet other collateral alterations might contribute to the severity and evolution of the injury. Our in vitro study supports previous results arguing that a deficit in hepatic glucose metabolism, concomitant to the mitochondrial injury, might be cardinal in the prognosis of the initial insult to the liver. From a drug development standpoint, coupling anaerobic glycolysis and mitochondrial function assessment might increase the drug-induced liver injury preclinical screening performance.
Introduction
Drug-induced liver injury (DILI) is a potentially fatal adverse drug event (Larrey and Pageaux, 2005; Weiler et al., 2015; Kullak-Ublick et al., 2017). DILI can be intrinsic or idiosyncratic. Intrinsic DILI is the result of a well characterized dose-dependent toxic effect of the drug on hepatocytesand it can be anticipated, as the dose is predictive of toxicity. The typical example of intrinsic DILI is that associated with acetaminophen overdose, which causes necrosis, severe hepatic damage, and acute liver failure (Kullak-Ublick et al., 2017; Andrade et al., 2019). Unlike intrinsic DILI, idiosyncratic DILI is rare and unpredictable; it can be the consequence of the direct toxic effect of the drug or its metabolite(s) on hepatocytes (e.g., valproic acid, amiodarone, nefazodone), or it results from a T-cell response against the drug, which is triggered by presentation of the drug itself or of a haptenized conjugate by human leukocyte antigen molecules to the T cells (e.g., amoxicillin-clavulanic acid). In idiosyncratic DILI, the risk of a toxic reaction very much depends on genetic predisposition encompassing hyperreactive human leukocyte antigens, increased uptake, reduced efflux, and abnormal metabolism that lead to uncommonly high intrahepatic levels of the parental drug or its reactive metabolite(s) (Visentin et al., 2018; European Association for the Study of the Liver, 2019).
Anticipation of idiosyncratic DILI and its prognosis in drug development is challenging, if not impossible, with the current knowledge on the cellular biology and biochemistry underlying drug-induced hepatotoxicity. Although in preclinical safety several in vitro assays are used to study the molecular mechanisms underlying DILI, none has any predictive or prognostic value. Likewise, during premarketing registration trials, signals of hepatotoxicity are rarely observed because of the relatively small size of the clinical studies and the lack of patient heterogeneity (Kullak-Ublick et al., 2017; Andrade et al., 2019). The result is that DILI is a growing public health concern, being the most frequent cause of acute liver failure in Western countries (Suk and Kim, 2012; Shen et al., 2019) and the major cause of market withdrawal of approved drugs (Lee, 2003; Regev, 2014). Implementation of predictive as well as prognostic test arsenals would represent a game changer from public health, industry, and regulatory perspectives.
DILI is often characterized by injury to mitochondria, which often originates from the inhibition of the electron transport chain, four multi-subunit proteins that span the inner mitochondrial membrane and catalyze sequential redox reactions to generate the inward proton gradient across the inner membrane that drives ATP synthesis. Several drugs, including acetaminophen’s reactive metabolite, N-acetyl-para-benzo-quinone imine, amiodarone, and nefazodone, have been shown to inhibit complex I of the electron transport chain, which—together with complex II—is considered the major site of reactive oxygen species production (Dykens et al., 2008; Serviddio et al., 2011; Kullak-Ublick et al., 2017; Andrade et al., 2019; Chrøis et al., 2020). In spite of the common molecular etiology, the evolution of the injury is difficult to predict, with some cases that are reversible upon discontinuation of the treatment and others characterized by irreversible acute liver failure, suggesting that other mechanisms of damage, in addition to mitochondrial dysfunction, contribute to the evolution of the initial liver injury.
In this study, we dissected the metabolome of human hepatocellular carcinoma-derived cells (Huh7 cells) upon short exposure to nefazodone, an antidepressant associated with hepatotoxicity and acute liver failure. We found that nefazodone is not only an inhibitor of cellular oxygen consumption but also impairs the glycolytic flux, the only mitochondrial-independent source of ATP in cells.
Materials and Methods
Reagents.
Nefazodone hydrochloride, 2-deoxy-d-glucose, oligomycin, insulin, and dexamethasone were provided by Sigma-Aldrich (St. Louis, MO). Radiolabeled d-[6-3H(N)] glucose ([3H]-d-glucose, specific activity 45.9 Ci/mmol) was purchased from PerkinElmer (Boston, MA). Regular and glucose-free RPMI 1640 media, Williams’ medium E (without phenol red, without l-glutamine), penicillin, streptomycin, and trypsin/EDTA were purchased from Gibco (Parsley, UK). Biowest FBS was provided by VWR (Dietikon, CH). XF RPMI medium was purchased from Agilent Seahorse XF (Santa Clara, CA).
Culture of Huh7 Cells.
Huh7 cells were maintained in regular RPMI 1640 medium supplemented by fetal bovine serum (10% v/v), penicillin (100 U/ml), and streptomycin (100 μg/ml). Cells were incubated in a humidified cell culture incubator with air containing 5% CO2 at 37°C. The day before the experiments, the cells were collected by trypsinization, counted, and seeded at assay-specific conditions.
Isolation and Culture of Primary Mouse Hepatocytes.
Hepatocyte isolation from mice was approved by the Cantonal Veterinary Office (ZH247/15). Primary mouse hepatocytes were isolated from female C57/BJ mice anesthetized by 2.5 mg phenobarbital (500 μl of 5 mg/ml in 0.9% NaCl) (Sigma-Aldrich) intraperitoneally injected. A midline incision from the abdominal area up to the lung area was made. A sterile cannula was inserted into the portal vein, preperfused at 37°C with a preperfusion buffer (0.5 mM EGTA, 20 mM HEPES in Hank’s balanced salt solution, pH 7.4) for 10 minutes at 8 ml/min, and then perfused for another 10–12 minutes with perfusion buffer (20 mM NaHCO3, 0.75 mg/ml bovine serum albumin, 6.7 mM CaCl2, 100 U/ml type 2 collagenase in Hank’s balanced salt solution, pH 7.4). The perfused liver was excised and gently swung in an ice-cold WME-a medium (Williams’ medium E with 10% fetal bovine serum, 2 mM l-glutamine, 100 units/ml penicillin, 100 μg/ml streptomycin, 25 U/ml insulin, and 1 μM dexamethasone) to release the hepatocytes. The isolated cell suspension was then filtered twice, firstly through 280 μm, 50 mesh and next through 190 μm, 80 mesh size filters. The filtered cells were washed in ice-cold WME-a and then centrifuged for 2 minutes at 4°C and 20gav. This step was repeated twice. The final pellet was re-suspended in ice-cold WME-a and viability determined by Trypan Blue exclusion assay using a Neubauer chamber. Primary mouse hepatocytes were seeded on Collagen R (SERVA Electrophoresis GmbH, Heidelberg, Germany)–coated plates (1-hour incubation with a 12.5 µg/ml collagen solution in 0.9% NaCl and subsequent washing prior to cell plating).
Cell Viability Assays.
Huh7 cells were seeded at a density of 10,000 cells in 100 μl media per well into 96-well plates and incubated at 37°C in a humidified atmosphere with 5% CO2. After 24 hours, medium was aspirated and replaced with fresh medium containing the indicated drugs. The onset of apoptosis and necrosis was assessed simultaneously using the Real Time-Glo Annexin V Apoptosis and Necrosis reagent to the medium (Promega, Madison, WI) followed by the measurement of the luminescent (apoptosis) and fluorescent (necrosis, λex = 475 nm, λem = 525 nm) signals, respectively. Apoptosis was detected by binding of an Annexin V–luciferase fusion protein to the phosphatidylserine exposed on the outer leaflet of the cell membrane, whereas necrosis was assessed by using a fluorescent membrane–impermeable DNA stain. ATP content was determined by measuring the luminescent signal after lysis with CellTiter-GLO reagent (Promega). All measurements were performed using GloMax Discover Microplate Reader (Promega).
Untargeted Metabolomics.
Huh7 cells were seeded on 10-cm dishes at the density of 1 × 10⁶ cells per dish. Twenty-four hours later, cells were treated for 2 hours with nefazodone at the extracellular concentration of 50 μM or an equal volume of DMSO. The treatment was stopped by washing the cells with ice-cold PBS. The cells were harvested by gentle scraping with prewarmed (70°C) 80% (v/v) methanol. The cells were homogenized with 10 strokes in a Dounce homogenizer kept on ice. After 1-minute incubation on ice, the homogenization step was repeated. The homogenate was incubated on ice for 15 minutes and then spun down at 15,000gav for 3 minutes at 4°C. The supernatant was collected and resolved by hydrophilic interaction liquid chromatography in negative mode using a Q-Exactive Hybrid Quadrupole-Orbitrap Mass Spectrometer (ThermoFischer Scientific, Waltham, MA). Metabolite data sets were processed by Progenesis QI (Nonlinear Dynamics), which aligns the ion intensity maps based on a reference data set, followed by a peak picking on an aggregated ion intensity map. Compound ions were detected after the retention time alignment of observed m/z signals. For all the samples, relative quantification of the detected compounds was calculated. The detected ions were further identified based on accurate mass, detected adduct patterns, and isotope patterns by comparison with the metabolites listed in the Human Metabolome Database (Wishart et al., 2018). The metabolites were scanned in a range from 50 up to 1200 Da. A mass accuracy tolerance of 5 mDa was set for the data base searches. A reference mixture of 29 selected compounds (amino acids, nucleotides, and metabolic intermediates) was analyzed along with the samples for quality control assessment. The coefficients of variation for the biologic and technical replicates of all the compounds were near or below 20%. A statistical analysis based on “Between Group” analysis was made with R, using the Bioconductor package made4 (Culhane et al., 2005). Pathway analyses were carried out using Metaboanalyst software (Chong et al., 2019).
Measurement of Oxygen Consumption and Extracellular Acidification.
The oxygen consumption rate (OCR) and extracellular acidification rate (ECAR) were determined using a bioenergetics assay Seahorse XFe24 analyzer (Seahorse XFe24 Analyzer; Agilent Technologies) according to the manufacturer’s instructions. Huh7 cells were seeded onto a Seahorse XFe 24-well microplate at the density of 3 × 10⁴ cells per well the day before the experiment. The regular RPMI 1640 medium was replaced with XF RPMI medium (without phenol red) and incubated at 37°C in a non-CO2 atmosphere 1 hour before the experiment, for temperature and pH equilibration. OCR and ECAR were measured under basal conditions, then after injection of various substrates.
Glucose Transport Assay.
Uptake of d-glucose was measured using a protocol designed for the quantification of uptake in intact cells (Visentin et al., 2015, 2017). Huh7 cells were seeded in 3.5-cm dishes at a density of 2.5 × 10⁵ cells per dish. Seventy-two hours after the seeding, the medium was aspirated, and cells were rinsed twice with prewarmed transport buffer (136 mM NaCl, 5.3 mM KCl, 1.1 mM KH2PO4, 1.8 mM CaCl2, 0.8 mM MgSO4, 11 mM d-glucose, and 10 mM Hepes/Tris, pH 7.4). Cells were equilibrated in transport buffer at 37°C, and then the buffer was aspirated, and the transport buffer, spiked with 0.5 µCi of [3H]-d-glucose per ml of transport buffer, was added. For measurement of non–carrier-mediated signal, the experiment was carried as described above, on ice. Uptake was stopped after 1 minute by quick aspiration of the labeled cocktail followed by extensive washing with ice-cold transport buffer. Cells were digested with 1 ml of 1% (w/v) Triton X-100 for at least 30 minutes. Lysate (500 μl) was mixed with 3 ml of Scintillation Liquid (Ultima Gold; PerkinElmer) and assessed for intracellular radioactivity in a Packard Tri-Carb 2250 CA liquid scintillation counter (Canberra Packard). A 25-μl aliquot was used for protein determination by the bicinchoninic acid protein assay (Interchim, Montluçon, France). Carrier-mediated transport was defined by subtracting the signal measured when the assay was carried at 4°C to that measured at 37°C. Uptake is expressed as picomoles of glucose per milligram of protein.
Statistical Analysis.
Comparisons at the indicated concentrations and time points were performed via a t test or one-way ANOVA with Tukey’s post hoc analysis. Statistical analyses were performed using Graph Pad Prism software (version 8.0.1).
Results
Effect of Nefazodone on the Cellular Metabolome of Huh7 Cells.
To evaluate the effect of nefazodone on the cellular metabolome, Huh7 cells were exposed to an extracellular concentration of nefazodone of 50 µM for 2 hours. Figure 1 shows that the viability of Huh7 cells exposed for 2 hours to an extracellular concentration of nefazodone as high as 200 µM was only slightly affected, with no increase in the apoptotic nor the necrotic index. Moreover, the short time of exposure ensures minor, if any, protein expression level changes. It is conceivable that any metabolomics alteration observed in this setting is the result of nefazodone-induced biochemical perturbation. It can be seen that the metabolomes of Huh7 cells exposed to nefazodone clustered together, showing a clear deviation from the metabolomes of the Huh7 cells exposed to the vehicle (DMSO) (Fig. 2A). Inspecting the metabolomes, we found that the intracellular levels of 192 out of 420 metabolites were changed (≥30%) after the exposure to nefazodone (Fig. 2B). Fifty-nine out of 192 metabolites were not identified. The quantitative pathway analysis on the identified metabolites (133) revealed that 30 pathways were significantly affected by the 2-hour exposure to nefazodone, nine of those associated with ATP production (Fig. 2, C and D).

Cell viability in the presence of nefazodone. Huh7 cells were exposed to nefazodone at the indicated extracellular concentrations, and then apoptosis (A) and cellular necrosis (B) were monitored in real time. Data are expressed in arbitrary units (A.U.) and presented as means ± S.D. from at least three independent experiments and analyzed by unpaired t test. Digitonin (40 µM) was used as a positive control.

Intracellular metabolome profile after nefazodone exposure. Huh7 cells were exposed to a vehicle (DMSO) or nefazodone at the extracellular concentration of 50 μM for 2 hours. (A) Partial least squares discriminant analysis. Each data point represents one technical replicate from one experiment. (B) Fold-change (FC) analysis, expressed as a nefazodone-to-DMSO ratio, calculated for each metabolite from the mean of five technical replicates. The changes ≥30% are shown in the color purple. (C) Quantitative pathway analysis of differentially expressed metabolites. The pathway impact refers to the Small Molecule Pathway Database. (D) Significantly altered pathways related to ATP synthesis and their impact.
Effect of Nefazodone on the ATP Content of Huh7 Cells and Primary Mouse Hepatocytes.
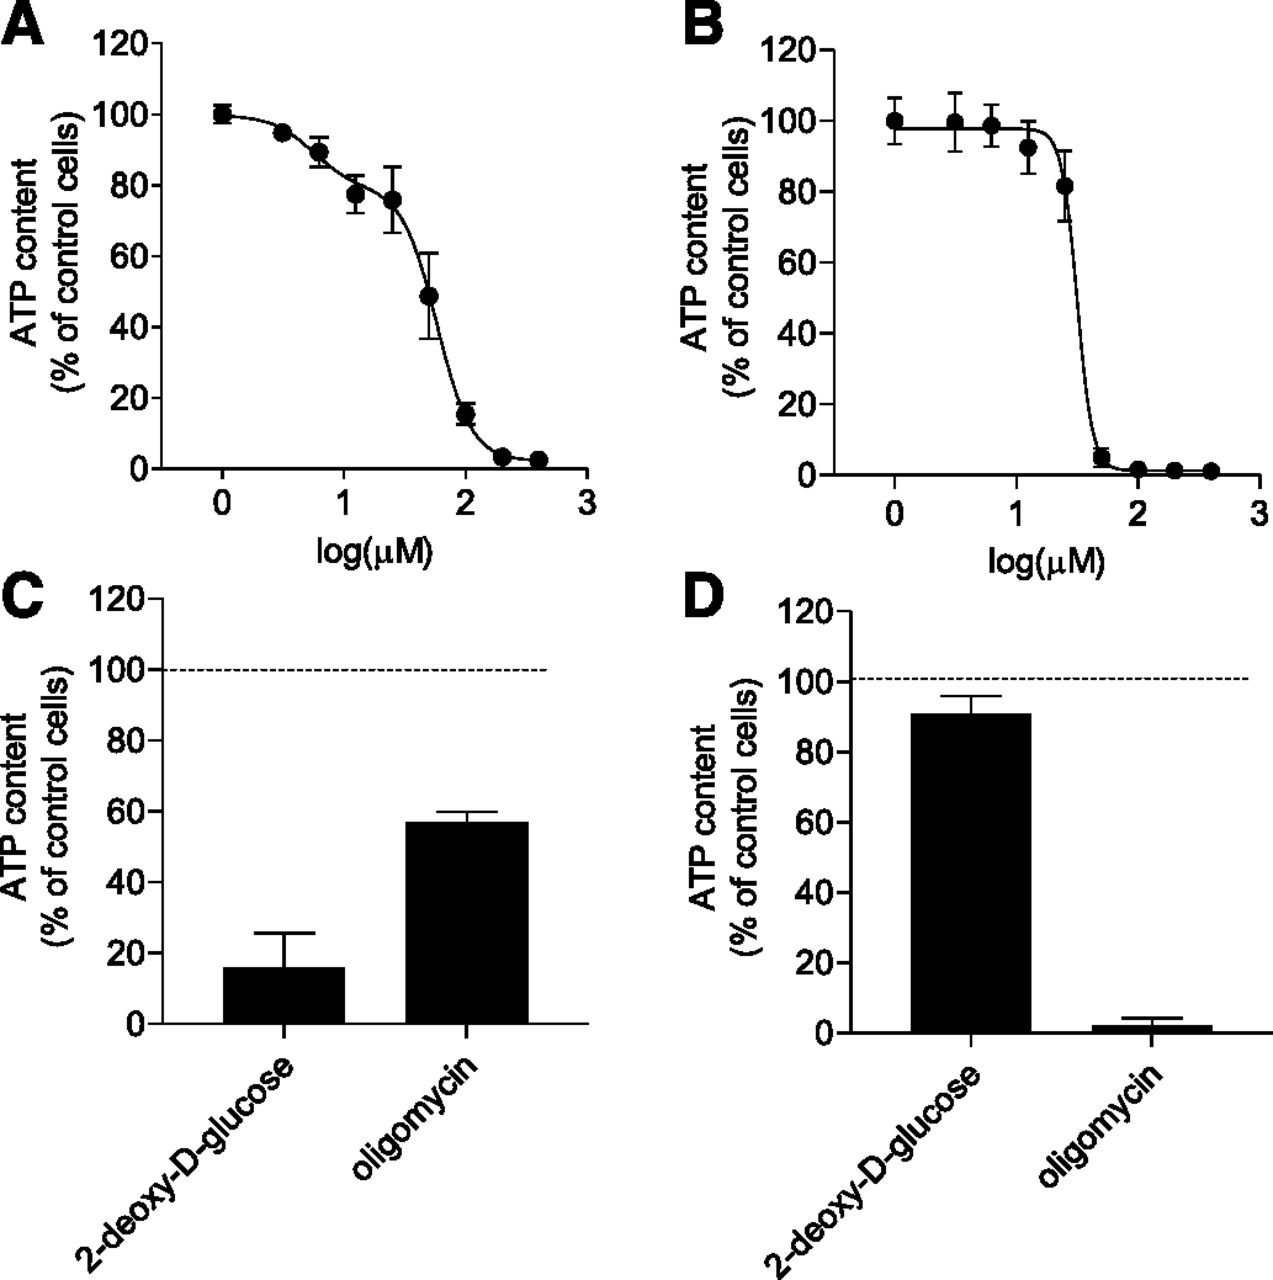
To assess the impact of nefazodone on ATP content, Huh7 cells and primary mouse hepatocytes were exposed for 2 hours to increasing extracellular concentrations of nefazodone and then lysed to assess the intracellular ATP content. Figure 3A shows that the effect of nefazodone on the ATP content was dose-dependent and biphasic with calculated IC50 values of 5.6 µM [95% confidence interval (CI) = 3.19–8.51] and 58.2 µM (95% CI = 53.2–64.8). Conversely, in primary cells, one IC50 could be calculated (31.6 μM, 95% CI = 29.5–33.8) (Fig. 3B). In this experiment, 2-deoxy-d-glucose and oligomycin, inhibitors of anaerobic glycolysis and oxidative phosphorylation, respectively, were used as positive controls (Fig. 3, C and D). Notably, Huh7 cells and primary mouse hepatocytes showed a different degree of sensitivity to 2-deoxy-d-glucose and oligomycin. It can be seen that 2-hour exposure to 2-deoxy-d-glucose reduced ATP content by ∼70% in Huh7 cells but less than 10% of that of primary mouse hepatocytes. Conversely, 2-hour exposure to oligomycin had a dramatic impact on the ATP content of primary mouse hepatocytes and a minor effect on that of Huh7 cells (∼30%–40%). Taken together, the data indicate that primary mouse hepatocytes rely primarily on mitochondria to synthesize ATP. In contrast, ATP production in Huh7 cells has a promiscuous nature and involves both oxidative phosphorylation and anaerobic glycolysis. Nefazodone seems to alter the ATP balance to the point of exhaustion of the ATP cellular reserve. Hence, the ability of nefazodone to fully deplete ATP content in Huh7 cells can be explained only partly by the previously shown inhibitory effect of nefazodone on the complex I (IC50 = 14 μM) of the electron transport chain (Dykens et al., 2008).

ATP content of Huh7 cells and primary mouse hepatocytes after drug treatment. Intracellular ATP levels in Huh7 cells (A) and primary mouse hepatocytes (B) after 2-hour exposure to increasing concentrations of nefazodone. Data are expressed as the percentage of the values measured in the respective DMSO-treated cells (control cells) and presented as means ± S.D. from three independent experiments. Curves were modeled using a biphasic (A) and a log(Inhibitor) vs. normalized response-variable slope (B) dose response curves. Intracellular ATP levels in Huh7 cells (C) and primary mouse hepatocytes (D) after 2-hour exposure to 2-deoxy-d-glucose (50 mM) or oligomycin (0.1 µM). Data are expressed as a percentage of the values measured in the respective DMSO-treated cells (control cells) and presented as means ± S.D. from one representative of two independent experiments, each performed in triplicate.
Role of Glucose on Nefazodone-Induced ATP Depletion.
It has been previously shown that cultured HeLa cells grow at a similar rate when the sugar source is either glucose, galactose, or fructose. However, glucose, but not fructose or galactose, was a substrate of anaerobic glycolysis, indicating that galactose and fructose passed through the pentose phosphate pathway to sustain cell proliferation, with no energy derived. It was demonstrated that, in the absence of glucose, cultured HeLa cells use glutamine as a primary source of ATP, which implies a switch from anaerobic to aerobic energy metabolism (Reitzer et al., 1979). The modulating effect of glucose on cultured cells energy metabolism has been exploited here to understand whether nefazodone inhibits ATP synthesis in Huh7 cells. Because of the short-exposure experimental setting (≤2 hours), no alternative carbon source (galactose or fructose) needed to be added to the medium. Figure 4 shows the modulating effect of glucose on the metabolic activity of Huh7 cells. It can be seen that in glucose-free medium, Huh7 cells displayed an increased oxygen consumption rate and a reduced extracellular acidification rate, as compared with the Huh7 cells maintained in glucose-containing medium (Fig. 4, A and B). Consistently, ATP depletion in the presence of oligomycin was significantly more pronounced when the incubation was performed in the absence of glucose (Fig. 4C). In Figure 4D, it can be seen that Huh7 cells were more sensitive to nefazodone when the incubation was performed in glucose-free medium, with a single computed IC50 (8.44 µM; 95% CI = 8.01–8.90), losing the biphasic effect observed in glucose-containing medium. The data suggest that nefazodone inhibits ATP synthesis at two different levels. At lower concentrations, it inhibits the mitochondria-dependent ATP synthesis, likely through inhibition of complex I as previously shown (Dykens et al., 2008), and at higher extracellular concentrations, nefazodone inhibits the mitochondria-independent ATP production.

Metabolic activity of Huh7 cells in presence or absence of glucose. OCR (A) and ECAR (B) measured in the presence and absence of glucose at the extracellular concentration of 2 g/l. Intracellular ATP content after 2-hour incubation with oligomycin at the extracellular concentration of 0.1 µM in medium with or without glucose (2 g/l) (C). Data are presented as means ± S.D. from three independent experiments, analyzed by unpaired t test (C). ATP content in Huh7 cells exposed to increasing extracellular concentrations of nefazodone in glucose-containing or glucose-free medium (2 g/l). ATP depletion curves in glucose and glucose-free media were modeled using a biphasic and log(Inhibitor) vs. normalized response-variable slope dose response curves (D).
Effect of Nefazodone on Oxygen Consumption and Extracellular Acidification of Huh7 Cells.
The dual effect of nefazodone on oxidative phosphorylation and anaerobic glycolysis was further investigated by monitoring OCR and ECAR in the presence or absence of nefazodone at two extracellular concentrations. At the lowest extracellular concentration (25 μM), nefazodone almost completely inhibited OCR, with no effect on ECAR (Fig. 5, A and C). At the highest concentration of nefazodone (100 µM), ECAR was also significantly reduced (Fig. 5). As expected, 2-deoxy-d-glucose only affected ECAR, confirming that the extracellular acidification has a glycolytic nature. Figure 5, B and D, illustrates the rate of oxygen consumption and extracellular acidification, respectively, after 2-hour exposure to nefazodone. Moreover, the data indicate that in Huh7 cells, the contribution of oxygen consumption to extracellular acidification secondary to the substantial production of CO2, rapidly hydrated to H2CO3 and then dissociated to HCO3− + H+ in the medium, is negligible (Mookerjee et al., 2015).

OCR and ECAR in Huh7 cells treated with nefazodone. Huh7 cells were treated with 2-deoxy-d-glucose or nefazodone; then OCR (A) and ECAR (C) were monitored before and after the injection of the drug into the medium. OCR (B) and ECAR (D) values after 2-hour exposure to nefazodone or 2-deoxy-d-glucose. Data are presented as means ± S.D. from three independent experiments and analyzed by one-way ANOVA and Tukey’s multiple comparison test.
Effect of Nefazodone on Glucose Uptake in Huh7 Cells.
To understand whether the inhibition of the glycolytic flux was secondary to a reduced transport of glucose across the plasma membrane, the uptake of glucose was assessed in the presence or absence of nefazodone. The transport was measured over a relatively short interval (1 minute) to minimize effects secondary to the rapid ATP depletion induced by nefazodone. In Figure 6A, it can be seen that glucose uptake in Huh7 cells was temperature-dependent, indicating that the transport of glucose in Huh7 cells is primarily carrier-mediated, hence inhibitable. However, when glucose uptake was measured in the presence of nefazodone at an extracellular concentration sufficient to inhibit the glycolytic flux, no inhibitory effect was observed (Fig. 6B). Taken together, the data indicate that the inhibitory effect of nefazodone on anaerobic glycolysis is not secondary to a reduced glucose uptake but rather the result of the inhibition of one or more enzymatic reactions within the glycolytic pathway.

Glucose uptake in Huh7 cells in the presence of nefazodone. Huh7 cells were exposed to d-glucose at the extracellular concentration of 1 g/l, spiked with [3H]d-glucose, for 1 minute at the indicated temperatures (A), or at 37°C in the presence of increasing extracellular concentrations of nefazodone (B). Data are presented as means ± S.D. from three independent experiments.
Effect of Glucose on Nefazodone-Induced ATP Depletion.
To investigate the possible protective role of glucose supplementation on nefazodone-induced toxicity, Huh7 cells were coexposed to nefazodone and increasing extracellular concentrations of d-glucose. Glucose transport in the liver is a low-affinity, high-capacity process, ensuring a linear uptake over a broad range of extracellular concentrations of glucose (Navale and Paranjape, 2016). As expected, the intracellular level of d-glucose in Huh7 cells increased linearly as the extracellular concentration of d-glucose increased (Fig. 7A), offering the possibility to investigate the effect of increasing concentrations of substrate on nefazodone-induced inhibition of anaerobic glycolysis. Figure 7B shows that higher extracellular concentrations of d-glucose did not affect the intracellular ATP content in untreated cells. Conversely, in the cells exposed to nefazodone at the extracellular concentration of 200 μM, at which anaerobic glycolysis should be completely inhibited, there was a dose-dependent rescue of the intracellular ATP content by glucose supplementation. Whereas at the lowest extracellular concentration of d-glucose, nefazodone reduced ATP by ∼90%, at the highest extracellular concentration of d-glucose, nefazodone reduced ATP content by only 50%.

Intracellular level of d-glucose and ATP in Huh7 cells as a function of the extracellular concentration of d-glucose. (A) Huh7 cells were exposed to d-glucose at the indicated extracellular concentration of d-glucose spiked with [3H]d-glucose for 1 minute. (B) ATP levels in Huh7 cells after 2-hour exposure to increasing concentrations of glucose and in the presence or absence of nefazodone at the extracellular concentration of 200 μM. Data are expressed as the percentage of the ATP values measured in the DMSO-treated cells (control cells) in 2 g/l d-glucose. All data are presented as means ± S.D. from three independent experiments and analyzed by one-way ANOVA and Tukey’s multiple comparison test.
Discussion
Nefazodone was withdrawn from the market due to several cases of acute liver failure, the mechanism of which has remained poorly investigated. Here we observed that nefazodone impairs oxygen consumption at extracellular concentrations that are compatible with the previously reported inhibition of the complex I of the electron transport chain (IC50 = 14 μM) (Dykens et al., 2008). Additionally, at higher extracellular concentrations, nefazodone could also inhibit anaerobic glycolysis. The inhibition of the anaerobic glycolysis represents a novel mechanism of nefazodone-induced toxicity in addition to the previously reported inhibition of the complex I of the electron transport chain and of the bile salt efflux pump (BSEP, ABCB11) (Kostrubsky et al., 2006; Dykens et al., 2008). The rapid inhibitory effect (5 minutes) of nefazodone on the OCR and ECAR of Huh7 cells, which display poor drug metabolizing activity (Choi et al., 2009), and the relatively slow metabolism of nefazodone previously measured in liver microsomes (Rotzinger and Baker, 2002), suggest that the perpetrator of the inhibition of the oxidative phosphorylation and the anaerobic glycolysis is the parent drug. Our findings are in line with a previous work showing that the unmetabolized nefazodone, and not the products of bioactivation, is responsible for hepatotoxicity (Kostrubsky et al., 2006).
In healthy hepatocytes, dietary glucose is phosphorylated by the glucokinase to glucose-6-phosphate, which is a substrate 1) of the phosphoglucomutase in the first committed step of glycogenesis, 2) of the glucose-6-phosphate dehydrogenase to enter the pentose phosphate pathway, and 3) of the glucose-6-phosphate isomerase to feed the glycolytic pathway with the primary scope of generating intermediates for amino acid, fatty acid, and pentose synthesis. In hypoglycemic conditions, hepatocytes obtain glucose from the breakdown of glycogen to sustain their metabolic activity and to supply the peripheral tissues with free glucose. When glycogen is exhausted, hepatocytes produce glucose from noncarbohydrate precursors such as lactate and glycerol in a series of reactions known as gluconeogenesis (Han et al., 2016). Although anaerobic glycolysis is pivotal in hepatic glucose metabolism, its role as an ATP source in healthy hepatocytes is probably not relevant. Conversely, there is growing evidence linking the loss in capacity to perform anaerobic glycolysis to failing hepatocytes. It has been recently shown that energy production remains intact in hepatocytes of patients in early stages of chronic liver injury despite the fact that the number of mitochondria is reduced because cells are able to switch from oxidative phosphorylation to anaerobic glycolysis. This ATP salvage pathway does not function in hepatocytes of patients in later stages of chronic liver injury and is associated with hepatic failure (Nishikawa et al., 2014). The metabolic plasticity of injured hepatocytes might also be critical in DILI progression. A potential role of glucose metabolism in acetaminophen-induced hepatotoxicity was shown in studies in rodents, where acetaminophen overdose, besides impairing the mitochondrial electron transport chain (complex I and II), stimulated glycogenolysis, depriving the liver of ready-to-use glucose to sustain the anaerobic production of ATP. In line with this, rat liver slices in fructose-containing baths had limited acetaminophen-induced damage in comparison with the extent of the injury caused by acetaminophen in control slices (Mourelle et al., 1991). These results are consistent with the evidence that fasting individuals are more susceptible than fed ones in experiencing severe toxicity upon acetaminophen ingestion (McClain et al., 1999). One could speculate that fasting individuals have reduced glycogen content or that dietary glucose can compensate for acetaminophen-induced hyperglycogenolysis. Finally, it is interesting to notice that case reports have associated nefazodone to hypoglycemia (Khoza and Barner, 2011).
Death of liver cells may occur through oncotic necrosis or apoptosis, both characterized by mitochondrial dysfunction. It is conceivable that the cell death modality (apoptosis or necrosis) underlies the severity and prognosis of the injury, encompassing from manageable and reversible to irreversible cases, which result in acute liver failure and transplantation. Oncotic necrosis rather than apoptosis seems to be predominant in drug-induced acute liver failure (Malhi et al., 2006). The prevalence of one or the other is likely to depend on the extent of ATP loss. Although anaerobic glycolysis is not considered a relevant pathway of ATP production in healthy liver cells, it is also the only ATP synthetic pathway that hepatocytes can rely on in the presence of a vast loss of mitochondria (Rosser and Gores, 1995; Russmann et al., 2009). When the level of ATP falls below the amount required to preserve minimal cell functions, provided enough ATP is still available, the apoptotic process begins. If there is a more severe drop in cellular ATP, the apoptotic process ceases, and oncotic necrosis takes place (Richter et al., 1996). Hence, the severity of the damage depends, ultimately, on the ability of the insulted hepatocytes to activate protective mechanisms such as apoptosis to reduce the inflammatory response that worsens the ongoing hepatic injury. It has been previously shown that acute inhibition of the mitochondrial respiratory chain induces apoptosis in cells carrying normal mitochondria, but not in p0 mutants, which maintain their ATP levels solely by anaerobic glycolysis, suggesting that the ATP content in cells with impaired mitochondrial energy metabolism but functional anaerobic glycolysis does not fall below the energy threshold which triggers apoptosis (Wolvetang et al., 1994). Consistently, nefazodone does not induce cell death at low extracellular concentrations, at which anaerobic glycolysis is spared. Higher extracellular concentrations of nefazodone, when anaerobic glycolysis is also impaired, trigger oncotic necrosis but not apoptosis.
Mitochondrial toxicity is a hallmark of drug-induced liver injury to the point that, during preclinical development, all new molecular entities are screened for possible mitochondrial damage by measuring ATP content and mitochondrial membrane potential in primary culture of human hepatocytes. In light of our findings, we argue that, in parallel to mitochondrial function, monitoring the effect of new molecular entities on anaerobic glycolysis might increase the DILI preclinical screening sensitivity. A simple ATP assay in the presence or absence of glucose would rapidly warn about possible toxicity and, if so, provide information about the primary target of toxicity of the compound under investigation. It is important to point out that such assays must be performed in the shortest time frame possible to be able to discern direct from indirect drug-induced ATP depletion. Indeed, long incubation times (≥24 hours) make more complicated to pinpoint direct metabolic impairments induced by the exposure to the drug, because the ATP depletion after long incubations with the drug might simply be the result of cell death or cell proliferation inhibition due to unrelated cytotoxic/cytostatic events. For instance, Dykens et al. (2008) found that nefazodone is mitochondrial toxic using HepG2 cells. Very much like we did, they measured ATP content, in the presence or absence of glucose, as a function of the extracellular concentration of nefazodone. However, the long exposure time to nefazodone (24 hours) in their study is likely to have complicated hypothesizing an effect of nefazodone on the mitochondria-independent ATP production for the authors. Assays conducted as shown here in immortalized or hepatocarcinoma cell lines, in addition to those with primary hepatocytes currently mandated, can deliver a more comprehensive view on mechanistic drug safety and should be routinely added to the arsenal of preclinical safety screenings in the assessment of potential DILI-causing agents.
Authorship Contributions
Participated in research design: Krajnc, Visentin, Gai, Stieger, Kullak-Ublick.
Conducted experiments: Krajnc, Visentin, Häusler.
Performed data analysis: Krajnc, Visentin.
Wrote or contributed to the writing of the manuscript: Krajnc, Visentin, Gai, Samodelov, Kullak-Ublick.
Footnotes
- Received May 21, 2020.
- Accepted August 10, 2020.
This work was supported by the Swiss National Science Foundation [Grant 310030_175639 to G.A.K.-U.].
This work is part of the following published dissertation: Krajnc E (2020) Pathomechanisms of Drug-Induced Liver Injury: (i) An In Vitro Model of Nefazodone-Induced Cytotoxicity, and (ii) An In Vivo Model of Valproic Acid-Induced Hepatic Steatosis and Effects of Treatment with an FXR Ligand. Ph.D. thesis, ETH Zurich, Zurich, Switzerland.
Abbreviations
- CI
- confidence interval
- DILI
- drug-induced liver injury
- ECAR
- extracellular acidification rate
- OCR
- oxygen consumption rate
- Copyright © 2020 by The American Society for Pharmacology and Experimental Therapeutics


