


Abstract
PF06821497 has been identified as an orally available small-molecule enhancer of zeste homolog 2 inhibitor. The objectives of the present study were to characterize pharmacokinetic-pharmacodynamic-disease relationships of PF06821497 in xenograft mouse models with diffuse large B-cell lymphoma (Karpas422). An indirect-response model reasonably fit dose-dependent pharmacodynamic responses [histone H3 on lysine 27 (H3K27) me3 inhibition] with an unbound EC50 of 76 nM, whereas a signal-transduction model sufficiently fit dose-dependent disease responses (tumor growth inhibition) with an unbound tumor stasis concentration (Tsc) of 168 nM. Thus, effective concentration for 70% of maximal effect (EC70) for H3K27me3 inhibition was roughly comparable to Tsc, suggesting that 70% H3K27me3 inhibition could be required for tumor stasis. Consistently, an integrated pharmacokinetic-pharmacodynamic-disease model adequately describing tumor growth inhibition also suggested that ∼70% H3K27me3 inhibition was associated with tumor stasis. Based on these results, we would propose that an EC70 estimate for H3K27me3 inhibition corresponding to tumor stasis could be considered a minimum target efficacious concentration of PF06821497 in cancer patients.
SIGNIFICANCE STATEMENT Using a mathematical modeling approach, the quantitative relationships of an orally available anticancer small-molecule enhancer of zeste homolog 2 inhibitor, PF06821497, were characterized among pharmacokinetics, pharmacodynamic biomarker inhibition, and disease responses in nonclinical xenograft models with diffuse large B-cell lymphoma. The modeling results suggest that >70% histone H3 on lysine 27 (H3K27) me3 inhibition would be required for tumor stasis (i.e., 100% tumor growth inhibition). Accordingly, we would propose that an effective concentration for 70% of maximal effect estimate for H3K27me3 inhibition could be considered a minimum target efficacious concentration of PF06821497 in cancer patients.
Introduction
Oncogenesis is a complicated process involved in a variety of genetic and epigenetic defects that can modulate transcriptional programs. The most well-characterized alteration of epigenetic aberrations is DNA methyltransferase–driven CpG-island DNA hypermethylation, which largely contributes to loss of tumor suppressor pathways through epigenetic silencing (Jones and Baylin, 2007; Esteller, 2008; Tsang and Cheng, 2011). In addition to DNA methylation, recent growing evidence suggests that alternations in histone modifications and chromatin-modifying enzymes are associated with cancer development (Marks et al., 2001; Esteller, 2007; Jones and Baylin, 2007). Epigenetic protein families modifying DNA and histones regulate chromatin structure as well as spacing of nucleosomes along DNA. In mammalian cells, two families of multiprotein complexes identified as polycomb repressive complexes, PRC1 and PRC2, compact chromatin and promote transcriptional silencing (Simon and Kingston, 2009; Eckert et al., 2011). Enhancer of zeste homolog 2 (EZH2) is a subunit of PRC2, which catalyzes monomethylation, dimethylation, and trimethylation of histone H3 on lysine 27 (H3K27). Gain-of-function driver mutations in the active site of EZH2 have been identified in non-Hodgkin lymphomas, such as diffuse large B-cell lymphoma (DLBCL) and follicular lymphoma (Trievel et al., 2002; Herz et al., 2013). EZH2 is also frequently overexpressed in various types of solid tumors, such as in breast, bladder, lung, endometrial, and prostate cancer (Esteller, 2008; Italiano, 2016). In general, PRC2 with wild-type EZH2 exhibits the highest methylation activity on unmethylated H3K27 substrates with decreasing efficiency toward higher H3K27 methylation states (i.e., H3K27 > H3K27me > H3K27me2), whereas those harboring mutant EZH2 show the opposite pattern of methylation activity toward H3K27 methylation states: H3K27me2 > H3K27me > H3K27 (Morin et al., 2010; Sneeringer et al., 2010; Yap et al., 2011). Recent emerging evidence suggests that increased EZH2 activity causes elevated H3K27me3 levels and acts as an oncogene via repression of tumor suppressor and cell differentiation genes, leading to tumor development, growth, and progression (Tsang and Cheng, 2011; Völkel et al., 2015; Italiano, 2016). Thus, targeting EZH2 can offer an opportunity for treatments of various human cancers (Kondo, 2014; Kim and Roberts, 2016; Yamagishi and Uchimaru, 2017). There are currently at least three potent small-molecule EZH2 inhibitors in clinical trials with promising responses by tazemetostat in patients with non-Hodgkin lymphomas (Keilhack and Smith, 2015; Soumyanarayanan and Dymock, 2016; Stazi et al., 2017). However, few detailed relationships among drug exposures, pharmacodynamic biomarkers, and disease responses in nonclinical tumor models have been published to date. Reported relationships have largely been limited to demonstrations of dose-dependent inhibition of H3K27me3 levels and/or tumor growth inhibition in human tumor xenograft models (McCabe et al., 2012; Knutson et al., 2014; Vaswani et al., 2016).
Mathematical modeling and simulation approach are powerful dynamic tools linking drug exposures to pharmacodynamic biomarker responses, such as target modulation [i.e., pharmacokinetic (PK)-pharmacodynamic (PD) (PKPD) relationships], and disease responses, such as antitumor efficacy [i.e., pharmacokinetic-disease (PKDZ) relationships] (Chien et al., 2005; Danhof et al., 2008; Yamazaki et al., 2016). The modeling results can provide a quantitative assessment of in vivo drug potency with mechanistic insight of drug action. Therefore, dynamic-modeling approach is increasingly being used in every stage of drug discovery and development, within which it is critical to establish exposure-response relationships of new molecular entities, particularly molecularly targeted agents, by characterizing the quantitative PKPD/PKDZ relationships. The understanding of these relationships in nonclinical models with clinical knowledge of efficacy and safety profiles could maximize the likelihood of success in clinical development of new molecular entities, with the ultimate goal being to achieve proof of mechanism and proof of concept in clinical trials.
PF06821497, (R)-5,8-dichloro-7-(methoxy(oxetan-3-yl)methyl)-2-((4-methoxy-6-methyl-2-oxo-1,2-dihydropyridin-3-yl)methyl)-3,4-dihydroisoquinolin-1(2H)-one, has been identified as an orally available small-molecule EZH2 inhibitor (Kung et al., 2018). PF06821497 is currently being tested in clinical trials with cancer patients. PF06821497 is a highly potent EZH2 inhibitor displaying strong H3K27me3 inhibition and antiproliferation in DLBCL cell lines expressing EZH2 mutant Y641N (Karpas422), with in vitro EC50 estimates of approximately 5 nM (Kung et al., 2018). Furthermore, PF06821497 exhibited significant in vivo H3K27me3 inhibition and antitumor efficacy in DLBCL xenograft models with Karpas422. The objectives of the present study were to characterize the PKPD and PKDZ relationships (i.e., plasma concentrations of PF06821497 to H3K27me3 inhibition in tumors and tumor growth inhibition) in DLBCL xenograft mouse models. In addition, we predicted an efficacious concentration of PF06821497 in patients based on the quantitatively characterized exposure-response relationships in xenograft models. Characterization of PKPD and PKDZ relationships of PF06821497 in nonclinical models can be valuable to predict and/or understand clinical PKPD and PKDZ relationships to maintain therapeutic efficacy and safety.
Materials and Methods
Chemicals
PF06821497 (chemical purity >99%) and a structurally related in-house compound (internal standard for analysis) were synthesized by Pfizer Worldwide Research and Development (San Diego, CA) (Kung et al., 2018). All other reagents and solvents were commercially available and were of either analytical or high-performance liquid chromatography grade.
In Vivo PKPD Study
The experimental designs and methods of the in vitro and in vivo PKPD studies were previously reported (Kung et al., 2018). Briefly, two separate repeated-dose studies of PF06821497 were conducted with PF06821497 in female scid-beige mice implanted with DLBCL Karpas422 xenografts subcutaneously. In the first study, PF06821497 was orally administered to animals (n = 9/group) twice daily, 7 hours apart, at the doses of 100, 200, and 400 mg/kg per dose in a suspension formulation (0.5% methylcellulose solution with 0.1% Tween 80) for up to 44 days. In the second study, PF06821497 was orally administered to animals (n = 10/group) twice daily, 7 hours apart, at the doses of 100 and 300 mg/kg per dose in a wet-milled nanosuspension formulation (2.5% polyvinyl pyrrolidone and 0.5% Macrogol 15 hydroxystearate in deionized water, w/v) for up to 70 days. In the same study, PF06821497 was also subcutaneously administered to animals once daily at the dose of 100 mg/kg in a wet-milled nanosuspension formulation for 42 days. The first and second studies are henceforth referred to as studies 1 and 2, respectively, and the formulations used are referred to as formulations 1 and 2, respectively. To determine plasma concentrations of PF06821497, blood samples (n = 3 to 4/time point) were collected at 1, 2, 4, 7, and 24 hours postdose with an additional time point of 8 hours postdose for oral-dose groups either from the tail vein or via cardiac puncture at the time of euthanasia. To determine H3K27me3 inhibition in tumors, a subset of mice (n = 3 to 4/group) was humanely euthanized at 4 hours postdose on day 44 in study 1 and day 9 in study 2. Resected tumors were snap frozen and pulverized using liquid nitrogen–cooled cryomortar. Tumor lysates were generated to determine the ratios of H3K27me3 to total histone H3 levels using an ELISA method. Tumor volume was measured during the treatment period by electronic Vernier calipers and was calculated as the product of its length × width2 × 0.4. Tumor growth inhibition in each treatment group was calculated as 100 × (1 − ∆T/∆C), in which ∆T and ∆C are the differences in tumor volumes between the 1st day and treatment days in the treatment and vehicle control groups, respectively. Tumor regression was calculated as 100 × (∆T/Tinitial), in which Tinitial is the tumor volume on the 1st day. All procedures were conducted in accordance with the Institute for Laboratory Animal Research Guide for the Care and Use of Laboratory Animals and with Pfizer Animal Care and Use Committee guidelines.
In Vitro Plasma Protein Binding
An unbound fraction of PF06821497 in mouse plasma was determined using an equilibrium dialysis technique as previously reported (Yamazaki et al., 2008). Briefly, the experiment was carried out in a 96-well Teflon dialysis chamber (HTDialysis LLC, Gales Ferry, CT) using a semipermeable membrane (Spectra/Por4; Spectrum, Laguna Hills, CA) with a 12,000–14,000 Da molecular mass cutoff. After the incubation at 37°C for 6 hours, aliquots of plasma and buffer samples were extracted with aliquots of acetonitrile/methanol mixture (1:1, v/v) containing the internal standard and analyzed by a liquid chromatography tandem mass spectrometry (LC-MS/MS) method as described below. An unbound fraction of PF06821497 in plasma (fu) was calculated by the following equation: (1)in which Cbuffer and Cplasma denote the concentrations of PF06821497 in buffer and plasma, respectively, after the incubation.
PF06821497 Analysis
Plasma concentrations of PF06821497 were determined by an LC-MS/MS method after protein precipitation of plasma samples with methanol/acetonitrile (1:1, v/v). The LC-MS/MS system consisted of a Shimadzu LC-20AD LC pump (Columbia, MD) and an API 4000 triple-stage quadrupole mass spectrometer with Analyst 1.6.3 software (Applied Biosystems, Foster City, CA). Chromatographic separation of the analytes was achieved first by diluting protein precipitation supernatant 10-fold with methanol/water (1:1, v/v, with 0.1% formic acid) and then injecting 3 µl onto a reverse-phase column (2.6 μ C18 100 Å, 30 × 3 mm; Kinetex) at a flow rate of 0.7 ml/min. A binary mobile phase consisted of 5 mM ammonium acetate in water with 0.05% formic acid (A) and acetonitrile with 0.1% formic acid (B). The gradient started at 15% B for 0.4 minutes, increased to 95% B over 0.9 minutes, and was then held at 95% B for 0.7 minutes. The gradient was returned to the initial condition of 5% B in 0.01 minutes and equilibrated at 5% B for 0.9 minutes before the next injection. The mass spectrometer was operated in the positive ionization mode using multiple reaction monitoring at specific precursor ion → product ion transition, with mass-to-charge ratio 467.1→151.7 for PF06821497 and mass-to-charge ratio 472.4→436.4 for the internal standard. The standard calibration curve was constructed using a weighted linear regression (1/χ2) with Watson LIMS 7.5 (Thermo Scientific, Waltham, MA). The calibration curve range was 1–2000 ng/ml with curves in replicate at eight concentrations. The back-calculated calibration standard concentrations were within ±12% of their theoretical concentrations, and the calculated concentrations of all quality control samples were within ±15%.
Mathematical Modeling and Simulation
Our modeling and simulation approaches were mainly divided into three tiers as summarized in Fig. 1: 1) modeled PKPD relationships for H3K27me3 inhibition in tumor, 2) modeled PKDZ relationships for antitumor efficacy (tumor growth inhibition and regression), and, lastly, 3) modeled pharmacodynamic-disease (PDDZ) relationships for antitumor efficacy through H3K27me3 inhibition (i.e., integrated PK-PDDZ modeling). The PDDZ relationships characterized by the integrated models were subsequently compared with the PKPD and PKDZ modeling results executed in parallel (e.g., the comparison of established exposure-response curves between these modeling results).

Schematic summary of characterization of pharmacokinetic-pharmacodynamic, pharmacokinetic-disease, and pharmacokinetic-pharmacodynamic-disease relationships by quantitative mathematical modeling.
PK Modeling.
A naïve-pooled PK analysis was employed to determine PK parameters of PF06821497 in studies 1 and 2. Namely, individual plasma concentrations from a subset of mice (n = 3/time points) at each dose were pooled together as if they were obtained from a single individual animal (Sheiner, 1984). PK analysis was performed with a standard two-compartment model (subroutine ADVAN4 with TRANS4) as implemented in NONMEM version 7.4 (University of California at San Francisco, San Francisco, CA) (Beal and Sheiner, 1992). Since the time to reach maximal plasma concentrations (tmax) in most of animals was observed at an initial time point (e.g., 1 hour), an absorption rate constant (ka) was fixed at 1 hour−1 to determine PK parameters, such as apparent clearance (CL/F) (liters per hour per kilogram), intercompartmental clearance (Q/F) (liters per hour per kilogram), central volume of distribution (V1/F) (liters per kilogram), and peripheral volume of distribution (V2/F) (liters per kilogram). Fraction of the dose absorbed (Fa) was fixed at unity at the lowest dose of 100 mg/kg to estimate the relative Fa at the other doses (i.e., 200 and 400 mg/kg in study 1 and 300 mg/kg in study 2).
PKPD Modeling.
The PKPD relationships for H3K27me3 inhibition (expressed as the ratio to vehicle control animal data) to plasma concentrations of PF06821497 were first modeled by an indirect-response model. The indirect-response model assumed that the baseline levels of H3K27me3 were maintained by the balance of formation and degradation rates (Dayneka et al., 1993; Jusko and Ko, 1994). The addition of PF06821497 was assumed to inhibit the formation rate because of its competitive inhibition mechanism on EZH2 methyltransferase activity for S-adenosyl methionine cofactor. The following differential equation was therefore used to estimate EC50 required for the H3K27me3 inhibition (E): (2)in which kin is the zero-order formation rate constant (h−1), Emax is maximum effect, Cp is the plasma concentration of PF06821497 (nanograms per milliliter), EC50 is the plasma concentration of PF06821497 (nanograms per milliliter) causing one-half Emax, γ is the Hill coefficient, and kout is the first-order degradation rate constant (hour−1).
To further investigate the time delay of H3K27me3 inhibition in tumor relative to the plasma concentrations of PF06821497, H3K27me3 inhibition was also modeled by a signal-transduction model, in which the drug first acted upon a target receptor, which initiated an effect signal through a cascade of transit compartments (Lobo and Balthasar, 2002; Yamazaki et al., 2011): (3)in which K1 to K4 refer to the signal transit compartments, and τ is the mean transit time between the transit compartments (hours). The initial conditions for E and K1-K4 were unity (baseline) and zero, respectively. These PKPD models (i.e., the indirect-response model and the signal-transduction model) are henceforth referred to as models I and II, respectively. In both models, kin was defined as baseline response (unity) × kout, whereas kout was fixed at 0.03 hour−1 in final models based on the literature data (half-life of ∼1 day) (Zee et al., 2010; Zovoilis et al., 2016).
PKDZ Modeling.
Drug-disease modeling for antitumor efficacy to plasma concentration of PF06821497 was performed based on a modified indirect-response model (Yamazaki, 2013; Yamazaki et al., 2016). First, tumor growth curves in vehicle control groups were characterized as basic tumor growth models by a first-order growth rate: (4)in which T is tumor volume (cubic millimeter), and ktg is the first-order tumor growth rate constant (hour−1). The initial condition for T is tumor volume (cubic millimeter) on day 1.
Subsequently, the response of tumor volume (T) to plasma concentration of PF06821497 (Cp) was modeled using the estimated ktg in vehicle control groups (eq. 4) based on the assumption that PF06821497 ultimately stimulated the tumor-killing rate: (5)in which Kmax is the maximal tumor-killing rate (hour−1) caused by PF06821497, and KC50 is the plasma concentration of PF06821497 (nanograms per milliliter) causing one-half Kmax.
To further investigate the time delay of tumor growth inhibition relative to the plasma concentration of PF06821497, antitumor efficacy was also modeled by a signal-transduction model (Lobo and Balthasar, 2002; Yamazaki et al., 2011): (6)
(6)
These tumor growth inhibition models (the modified indirect-response model and the signal-transduction model) are henceforth referred to as models III and IV, respectively. Subsequently, tumor stasis concentration (Tsc), defined as the plasma concentration of PF06821497 required to maintain tumor burden constant at steady state (i.e., 100% tumor growth inhibition), was calculated by the obtained pharmacodynamic parameter estimates, assuming zero net–tumor growth rate (i.e., dT/dt = 0 as Cp = Tsc). Since tumor regression (>100% growth inhibition) was observed in the present study (e.g., subcutaneous group at 100 mg/kg in study 2), Kmax was fixed at 2 in final models to avoid over-parameterization. Sensitivity analyses for Kmax revealed that Tsc estimates were comparable when Kmax was fixed at 2–6.
Integrated PK-PDDZ Modeling.
To further investigate the PDDZ relationships of PF06821497 in the xenograft models, the integrated PK-PDDZ models were also applied to characterize the relationships among plasma concentrations of PF06821497, H3K27me3 inhibition, and antitumor efficacy (Yamazaki, 2013; Yamazaki et al., 2016). In the integrated models, the PD parameters obtained by models I and II were used to simulate the H3K27me3 inhibition as a function of time after repeated-dose administration. Tumor growth inhibition was then modeled using a proposed “inhibition index (1/E − 1)” as a forcing function in a signal-transduction model: (7)in which, as before, ktg is the first-order net growth rate constant (hour−1), T is tumor volume (cubic millimeter), Kmax is the maximal tumor-killing rate (hour−1) caused by PF06821497, E is the H3K27me3 ratio to baseline level, KE50 corresponds to the H3K27me3 inhibition index producing 50% of Kmax, K1 to K4 refer to the signal transit compartments, and τ is the mean transit time between the transit compartments (hours). The initial conditions for T, E, and K1–K4 were tumor volume (cubic millimeter) on day 1, unity (baselilne), and zero, respectively. Subsequently, the degree of H3K27me3 inhibition corresponding to tumor stasis at steady state was calculated by the obtained pharmacodynamic parameter estimates assuming zero net–tumor growth rate (i.e., dT/dt = 0).
Data Analysis.
All analyses were performed with NONMEM version 7.4 and S-Plus 8.0 (Insightful Corporation, Seattle, WA). The NONMEM subroutine ADVAN8 was used for all the models. Residual variability was characterized by a proportional error model. In models III–V, an interanimal variability on ktg was estimated using an exponential variance model. Model selection was based on several criteria, such as the NONMEM objective function value (OFV), estimates, S.E.s, and scientific plausibility as well as exploratory analysis of the goodness-of-fit plots.
Results
PK Modeling for PF06821497
The observed and model-fitted plasma concentrations of PF06821497 in studies 1 and 2 are shown in Fig. 2. Overall, the plasma concentration–time courses of PF06821497 in all groups were adequately described by the two-compartment model. Typical PK parameter estimates for CL/F, Q/F, V1/F, and V2/F at the oral doses were, respectively, 18.6 l/h per kilogram, 16.7 l/h per kilogram, 1.26 l/kg, and 102 l/kg in study 1 and 16.7 l/h per kilogram, 6.34 l/h per kilogram, 0.877 l/kg, and 27.1 l/kg in study 2, whereas those at the subcutaneous dose were 1.97 l/h per kilogram, 1.93 l/h per kilogram, 0.351 l/kg, and 8.66 l/kg, respectively, in study 2 (Table 1). S.E.s for the majority of estimated PK parameters were small (CV <20%). The relative Fa estimates in study 1 decreased from 1 at 100 mg/kg to 0.779 and 0.658 at 200 and 400 mg/kg, respectively, indicating a less than dose-proportional increase in oral exposures at the doses of 100–400 mg/kg in formulation 1. In contrast, the relative Fa estimate in study 2 was 1.07 at the dose of 300 mg/kg relative to 100 mg/kg, indicating a dose-proportional increase in oral exposures at the doses of 100–300 mg/kg in formulation 2. The typical pharmacokinetic parameters obtained were used to simulate plasma concentrations as a function of time after administration to drive the pharmacodynamic models.

Observed and model-fitted plasma concentrations of PF06821497 in DLBCL xenograft models after repeated administration. PF06821497 was administered to animals (n = 3/group) at the oral doses (po) of 100, 200, and 400 mg/kg twice daily, 7 hours apart, in study 1 (S1) and 100 and 300 mg/kg twice daily, 7 hours apart, or the subcutaneous dose (sc) of 100 mg/kg once daily in study 2 (S2). The x-axis represents the time after dosing in hours, and the y-axis represents the observed (OBS) and model-fitted (PRED) plasma concentrations of PF06821497 in nanograms per milliliter on a logarithmic scale.
Pharmacokinetic parameter estimates of PF06821497 in DLBCL xenograft models after repeated administration
Precision of the estimates is expressed as S.E. in parentheses. Fa represents a relative fraction absorbed to the lowest dose in each study (i.e., Fa1, Fa2, and Fa3 for the oral doses of 100, 200, and 400 mg/kg, respectively) in study 1 and Fa1 and Fa2 for the oral doses of 100 and 300 mg/kg, respectively, in study 2.
PKPD Modeling for H3K27me3 Inhibition
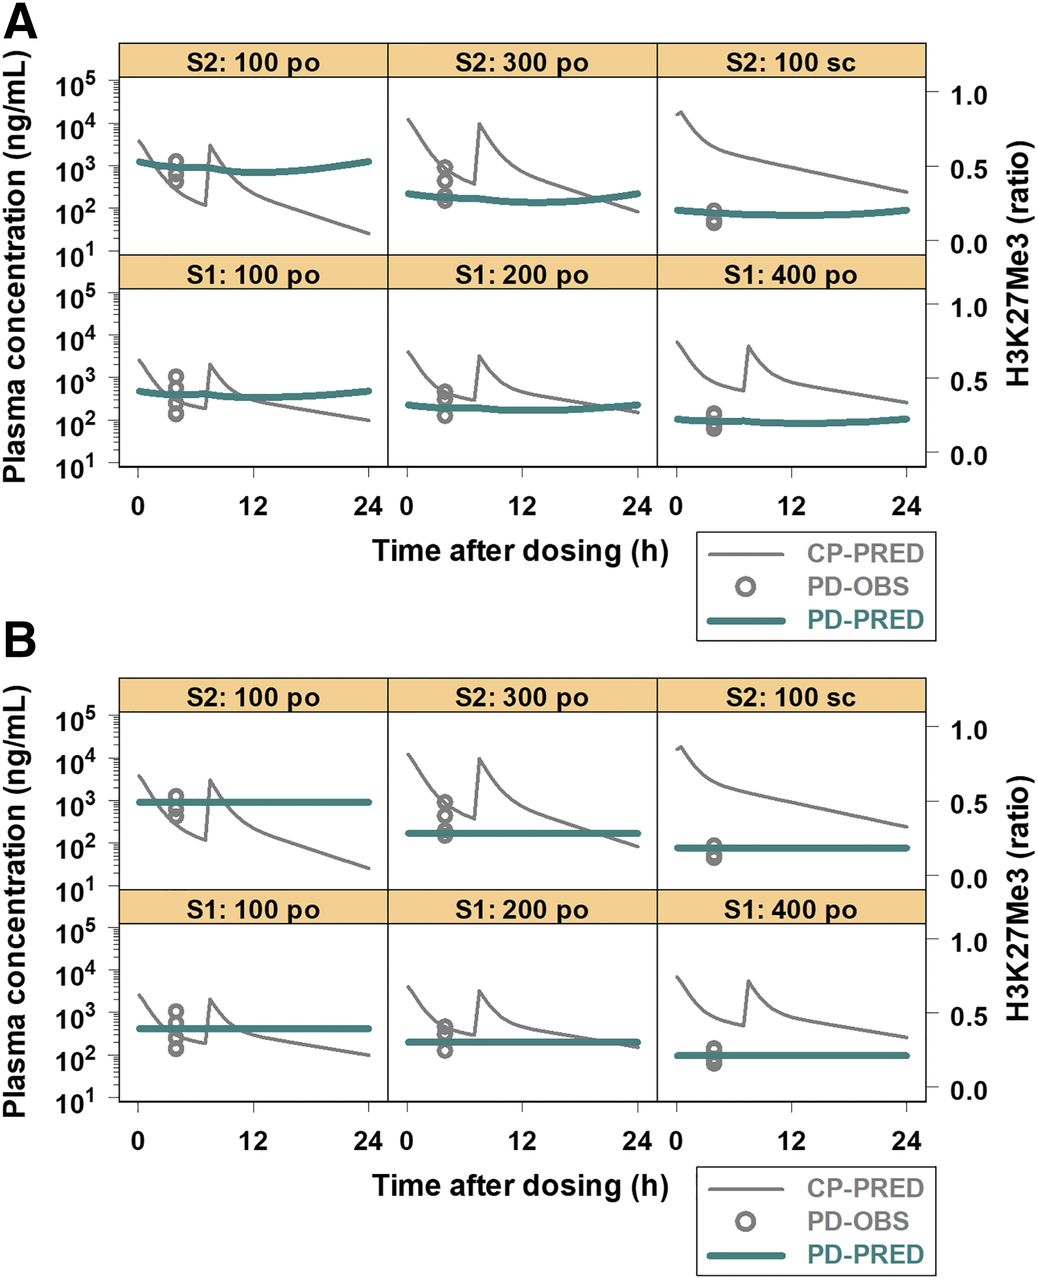
The observed and model-fitted H3K27me3 inhibition along with the simulated plasma concentrations of PF06821497 are presented in Fig. 3. Both models I and II sufficiently fit H3K27me3 inhibition in all groups of studies 1 and 2. The EC50 estimates by models I and II were 168 and 173 ng/ml, respectively (Table 2). In model II, the estimated τ was 6.61 hours. The OFV values were comparable between models I and II (−106 and −105, respectively). Overall, the modeling results were comparable between models I and II.

Observed and model-fitted H3K27me3 inhibition in DLBCL xenograft models after repeated administration of PF06821497. PF06821497 was administered to animals (n = 3 to 4/group) at the oral doses (po) of 100, 200, and 400 mg/kg twice daily, 7 hours apart, in study 1 (S1) and 100 and 300 mg/kg twice daily, 7 hours apart, or the subcutaneous dose (sc) of 100 mg/kg once daily in study 2 (S2). H3K27me3 inhibition by PF06821497 was characterized by models I (A) and II (B). The x-axis represents the time after dosing in hours, and the y-axes represent the simulated plasma concentration (CP-PRED) in nanograms per milliliter on a logarithmic scale (left) and the observed (PD-OBS) and model-fitted (PD-PRED) H3K27me3 inhibition in the baseline ratios on a linear scale (right).
Pharmacodynamic parameter estimates of PF06821497 for H3K27me3 inhibition in DLBCL xenograft models after repeated administration
Precision of the estimates is expressed as S.E. in parentheses. kin was defined as baseline response (unity) × kout.
PKDZ Modeling for Antitumor Efficacy
The model-fitted tumor growth inhibition profiles with the observed tumor volumes are presented in Fig. 4. The model-fitted individual profiles and the relationships between the observed and model-fitted tumor volumes are shown in Supplemental Figs. 1 and 2, respectively. The estimated ktg in vehicle control groups of studies 1 and 2 were 0.00216 and 0.00226 hour−1, respectively, which was used for subsequent PKDZ modeling by models III and IV. The KC50 estimates by models III and IV were 1110 and 357 ng/ml, respectively (Table 3). The OFV value was 11,010 in model III and 11,487 in model IV. The estimated τ by model IV was 87.0 hours (Table 3). Overall, model IV reasonably fit tumor growth inhibition profiles, including tumor regression by capturing the observed time delay (i.e., hysteresis), whereas model III could not fully describe the hysteresis (discussed later).

Observed tumor volumes and model-fitted tumor growth inhibition profiles in DLBCL xenograft models after repeated administration of PF06821497. PF06821497 was administered to animals (n = 9 to 10/group) at the oral doses (po) of 100, 200, and 400 mg/kg twice daily, 7 hours apart, in study 1 (S1) and 100 and 300 mg/kg twice daily, 7 hours apart, or the subcutaneous dose (sc) of 100 mg/kg once daily in study 2 (S2). Tumor growth inhibition by PF06821497 was characterized by models III (A) and IV (B). The x-axis represents the treatment period in days, and the y-axis represents the observed individual and median tumor volumes (IOBS and OBS, respectively) with the model-fitted tumor growth curves (PRED) in cubic millimeters.
Pharmacodynamic parameter estimates of PF06821497 for tumor growth inhibition in DLBCL xenograft models after repeated administration
Precision of the estimates is expressed as S.E. in parentheses. Tumor growth rates (ktg) in vehicle control groups were estimated to be 2.16 (0.0247) and 2.26 (0.0242) × 10−3 h−1 in studies 1 and 2, respectively.
PK-PDDZ Modeling for Antitumor Efficacy
The model-fitted tumor growth inhibition profiles with the observed tumor volumes and the simulated H3K27me3 inhibition profiles are presented in Fig. 5. The model-fitted individual profiles and the relationships between the observed and model-fitted tumor volumes are shown in Supplemental Figs. 3 and 4, respectively. Using the PKPD parameters obtained from model I, the integrated PK-PDDZ model (model V) reasonably fit the observed individual tumor growth curves in all groups of studies 1 and 2. The estimated τ was 85.1 hours, which was comparable to that (87.0 hours) by model IV (Table 3). The H3K27me3 inhibition required for tumor stasis at steady state was 70% calculated from the estimated parameters, such as KE50 of 2.30.

Observed tumor volumes and model-fitted tumor growth inhibition profiles in DLBCL xenograft models after repeated administration of PF06821497. PF06821497 was administered to animals (n = 9 to 10/group) at the oral doses (po) of 100, 200, and 400 mg/kg twice daily, 7 hours apart, in study 1 (S1) and 100 and 300 mg/kg twice daily, 7 hours apart, or the subcutaneous dose (sc) of 100 mg/kg once daily in study 2 (S2). Tumor growth inhibition by PF06821497 was characterized by model V. The x-axis represents the treatment period in days, and the y-axes represent the simulated H3K27me3 inhibition (PD-PRED) in the baseline ratios (left) and the observed individual and median tumor volumes (TV-IOBS and TV-OBS, respectively) with the model-fitted tumor growth curves (TV-PRED) in cubic millimeters (right).
Quantitative Comparison of PKPD Relationships
Based on the obtained pharmacodynamic parameters (e.g., EC50, Emax, KC50, and Kmax) by models I and IV, the established exposure-response curves of PF06821497 for H3K27me3 inhibition and tumor growth inhibition are graphically shown in Fig. 6A. It may be worth noting that tumor growth inhibition on the left y-axis ranges from 0 to 1.2 because of tumor regression (>100% tumor growth inhibition), whereas the range of H3K27me3 inhibition on the right y-axis is 0 to 1. The estimated EC50 (168 ng/ml) for H3K27me3 inhibition by model I was ∼2-fold lower than the estimated Tsc (357 ng/ml) by model IV, resulting in Tsc being roughly comparable to the EC70 (392 ng/ml) for H3K27me3 inhibition. The EC70 and Tsc values as total plasma concentrations (bound plus unbound) corresponded to unbound plasma concentrations of 177 and 161 nM free, respectively, after the correction for a fraction unbound in mouse plasma (0.21) (Table 4). Consistently, the integrated PK-PDDZ model (model V) suggested that the H3K27me3 inhibition required for tumor stasis was 70% as indicated before. The relationships among H3K27me3 inhibition, tumor growth inhibition, and inhibition index (1/E − 1) by the integrated PK-PDDZ modeling are presented in Fig. 6B. Overall, these modeling results suggest that PF06821497-mediated 70% inhibition for H3K27me3 would be associated with tumor stasis in DLBCL xenograft models with Karpas422.

Comparison of the relationships among plasma concentration of PF06821497, H3K27me3 inhibition, and tumor growth inhibition (TGI) in DLBCL xenograft models. Response curves were simulated at the concentration range of 0.1 to 100,000 ng/ml using the pharmacodynamic parameters obtained by models I and IV (A) and model V (B). Red dashed lines indicate tumor stasis (100% tumor growth inhibition), 70% H3K27me3 inhibition, inhibition index of 2.3, and the predicted minimum target efficacious concentration (Ceff,pred). The x-axis represents the plasma concentrations of PF06821497 in nanograms per milliliter on a logarithmic scale (A) and H3K27me3 inhibition in ratios (B), the left y-axes represent tumor growth inhibition in ratios (A and B), and the right y-axes represent H3K27me3 inhibition in ratios (A) and inhibition index (B).
Summary of pharmacodynamic parameter estimates for H3K27me3 inhibition and antitumor efficacy by PF06821497 in DLBCL xenograft models
The unbound concentrations (EC50, EC70, and Tsc) were calculated from the total concentrations after the correction for an unbound fraction in mouse plasma (0.21).
Discussion
We quantitatively characterized the relationships of plasma concentrations of PF06821497 to inhibition of pharmacodynamic biomarker (H3K27me3 inhibition) and disease responses (tumor growth inhibition) in DLBCL xenograft models using a mathematical modeling approach. This is the first report to quantify the PK-PDDZ relationships of an EZH2 inhibitor in nonclinical models. At least three other potent small-molecule EZH2 inhibitors are currently being studied in phase I/II trials in several cancer indications, including non-Hodgkin lymphoma (Keilhack and Smith, 2015; Soumyanarayanan and Dymock, 2016; Stazi et al., 2017). Encouragingly, one of these inhibitors, tazemetostat, has shown promising clinical responses in these trials, suggesting that targeting EZH2 has potential in future cancer therapy (Italiano et al., 2018; Makita and Tobinai, 2018). Consequently, there has been an increasing interest and need for quantitively characterizing PK-PDDZ relationships of EZH2 inhibitors in nonclinical models as well as cancer patients.
In the present study, oral exposures of PF06821497 increased in a less than dose-proportional manner at the doses of 100–400 mg/kg in formulation 1, as the relative Fa estimates decreased from 1 to 0.658 at the doses tested (Table 1). This could be the result of a solubility/dissolution-limited absorption, which was also observed across nonclinical species (e.g., rats and dogs) in formulation 1 (in-house data). Thermodynamic solubility of PF06821497 in a crystalline form was reported to be ∼0.4 mg/ml in deionized water (Kung et al., 2018). Subsequently, we used a more soluble wet-milled nanosuspension formulation (formulation 2) in study 2 to improve the solubility/dissolution-limited absorption. The Fa estimate at the dose of 300 mg/kg relative to 100 mg/kg was near-unity (1.07), indicating a dose-proportional increase in oral exposures at these doses in formulation 2. PF06821497 was also subcutaneously administered to xenograft models at the dose of 100 mg/kg in formulation 2. As a result of bypassing the first-pass metabolism in gut and liver, the estimated CL/F was ∼9-fold lower in subcutaneous administration (∼2 l/h per kilogram) than oral administration (∼17 l/h per kilogram) in study 2 (Table 1), suggesting that systemic availability of PF06821497 by subcutaneous administration increased by nearly 10-fold compared with oral administration. Once-daily subcutaneous dose of 100 mg/kg therefore yielded ∼2-fold higher exposures compared with twice-daily oral administration of 300 mg/kg per dose (600 mg/kg per day). The observed half-lives appeared to be comparable between oral and subcutaneous administration, although the time points were limited for half-life evaluation (Fig. 2). These results could be consistent with the observation that systemic CL of PF06821497 was near hepatic blood flow in rodents (Kung et al., 2018). In contrast, in vitro metabolic CL of PF06821497 in human microsomes and hepatocytes was moderate, suggesting that in vivo CL in humans would not be limited by hepatic blood flow. Overall, the dose-dependent tumor growth inhibition was achieved in the present study with a maximal tumor growth inhibition of 114% (i.e., significant tumor regression).
Two different PKPD models (models I and II) were applied to estimate in vivo potency of PF06821497 for H3K27me3 inhibition as pharmacodynamic biomarker responses. In general, both models (indirect-response and signal-transduction models) can account for a time delay of biomarker responses relative to drug concentrations (i.e., hysteresis) (Dayneka et al., 1993; Lobo and Balthasar, 2002; Yamazaki et al., 2016). In the present study, model I reasonably fit the H3K27me3 inhibition in all groups with a fixed kout of 0.03 hour−1 according to the reported half-life of ∼1 day (Zee et al., 2010; Zovoilis et al., 2016). As previously reported (Kung et al., 2018), in vitro EC50 for H3K27me3 inhibition was determined on day 3 after reaching steady state. These results were consistent with the literature reporting that EZH2 inhibitors time-dependently inhibited H3K27me2 methylation in lymphoma cell lines (i.e., apparent monoexponential declines with ≥90% inhibition after the treatment of 3 to 4 days) (Knutson et al., 2014). Model II also sufficiently fit the H3K27m3 inhibition results with an estimated τ of 6.6 hours (Table 2). The estimated EC50 of 173 ng/ml by model II was comparable to that (168 ng/ml) by model I. The sensitivity analysis for kout in model II revealed that EC50 was not sensitive (<10%) to kout of greater than 0.01 hour−1, whereas τ was sensitive to kout (0.1–15 hours at kout of 0.01–10 hour−1), suggesting a challenge to estimate τ and kout simultaneously based on the available data. Model I was therefore selected as a final PKPD model to further perform integrated PK-PDDZ modeling.
The estimated EC50 value (168 ng/ml) for H3K27me3 inhibition corresponds to an unbound concentration of 76 nM after the correction for an unbound fraction in mouse plasma. In contrast, the unbound EC50 in vitro was ∼5 nM (Kung et al., 2018), which was ∼15-fold lower than the unbound EC50 in vivo. The reason for the difference in EC50 estimates between in vitro and in vivo remains unclear, although biologic feedback mechanisms against EZH2 inhibitors might be one of the potential reasons. It has been known that adaptive changes in biologic signals to molecularly targeted agents can frequently occur in tumors via a rapid wiring of variety of signaling (Soria et al., 2012; Rosell et al., 2013). Thus, there could possibly be some in vitro–to–in vivo differences in biologic signaling mechanisms, including extent and rate of the changes in signals and feedbacks. Another potential reason could be the impact of subcutaneous inoculation of tumor cells on the expression levels of drug-metabolizing enzymes (e.g., CYP3A) and transporters (e.g., multidrug-resistance transport protein, P-glycoprotein) in mouse xenograft models (Sugawara et al., 2010). PF06821497 is characterized as a substrate of CYP3A and P-glycoprotein, thereby suggesting that some changes in drug-metabolizing enzymes and transporters in vivo could make an impact on PF06821497-mediated pharmacological responses. In addition, the estimated volume of distribution of PF06821497 in rodents after a single intravenous administration is relatively small (1 to 2 l/kg) (Kung et al., 2018). Therefore, the distribution of PF06821497 to tumors in vivo might be another potential factor to be considered. Overall, a dose-dependent H3K27me3 inhibition by PF06821497 was achieved in the present study with a nearly complete inhibition at the higher doses.
In the PKDZ modeling, two different models (models III and IV) were applied to estimate antitumor potency of PF06821497 in vivo. The KC50 estimate (1110 ng/ml) by model III was approximately 3-fold higher than that (357 ng/ml) by model IV (Table 3). The OFV value (11,010) in model IV was lower than that (11,487) in model III despite an additional parameter (τ) in model IV. One of the potential reasons could be that model III was not able to adequately account for marked hysteresis on tumor growth inhibition relative to the plasma concentrations of PF06821497 (Fig. 4; Supplemental Fig. 1). For example, model III could not sufficiently fit tumor regression, which was observed in the subcutaneous group of 100 mg/kg after ∼2-week treatments. Consistently, the estimated τ by model IV was relatively large (87.0 hours), which was approximately 13-fold longer than that (6.61 hours) for H3K27me3 by model II. The difference in the estimated τ between models II and IV suggested an additional hysteresis from H3K27me3 inhibition to tumor growth inhibition (i.e., PDDZ relationships) after a hysteresis from the plasma concentrations of PF06821497 to H3K27me3 inhibition (i.e., PKPD relationship). Consistently, in vitro H3K27me3 inhibition and antiproliferation reached steady state during 3- and 10-day incubation, respectively (Kung et al., 2018). Given these findings together, model IV was selected as a final model for the PK-PDDZ model to perform further modeling.
When compared between PKPD and PKDZ modeling results, the estimated EC50 (168 ng/ml) for H3K27me3 inhibition by model I was approximately 2-fold lower than the estimated Tsc (357 ng/ml) by model IV. Therefore, the calculated EC70 (392 ng/ml) for H3K27me3 inhibition was roughly comparable to Tsc, suggesting that PF06821497-mediated 70% inhibition of H3K27me3 would be associated with tumor stasis (100% tumor growth inhibition) in nonclinical xenograft models. To verify the PK-PDDZ relationships, we incorporated model I to model IV using the inhibition index (1/E − 1) as the integrated PK-PDDZ model (model V). The estimated KE50 was 2.30, which corresponded to E of 0.30 (i.e., 70% H3K27me3 inhibition) (Table 3). Thus, the integrated PK-PDDZ modeling results also suggested that 70% inhibition of H3K27me3 would be associated with tumor stasis. These comparisons are graphically presented in Fig. 6 and also summarized in Table 4 as unbound plasma concentrations. Based on these results, the EC70 (∼180 nM free) for PF06821497-mediated H3K27me3 inhibition could be considered a minimal-target efficacious concentration in plasma of cancer patients with DLBCL, since tumor stasis was achieved with 70% H3K27me3 inhibition in nonclinical xenograft models.
In conclusion, using a mathematical dynamic-modeling approach, the PK-PDDZ relationships among systemic exposures of PF06821497, pharmacodynamic biomarker inhibition, and disease responses in nonclinical tumor models were characterized well in a quantitative manner (Fig. 7). The present modeling results suggest that >70% H3K27me3 inhibition would be required for a significant antitumor efficacy (e.g., tumor regression) in DLBCL xenograft models. Accordingly, we would propose that the EC70 for H3K27me3 inhibition (∼180 nM free) could be considered a minimum target efficacious plasma concentration of PF06821497 in cancer patients with DLBCL. Overall, we believe that the quantitative characterization of nonclinical PK-PDDZ relationships will be valuable in understanding clinical PKPD relationships of PF06821497 in patients and also in guiding dose escalation/de-escalation to maintain therapeutic efficacy and safety of PF06821497 in the clinic. We will compare clinical PK-PDDZ relationships in patients with the present nonclinical characterization once clinical data are available.

PK-PDDZ modeling summary for plasma concentrations of PF06821497, pharmacodynamic biomarker responses, and antitumor efficacy in nonclinical xenograft models. Cp, plasma concentration of PF06821497; t, time after dosing or treatment period; H3K27me3, baseline ratio of H3K27me3 inhibition; Tumor, tumor volume (cubic millimeter); PK, simulated plasma concentration of PF06821497l; PD, H3K27me3 inhibition (ratio); DZ, tumor growth inhibition (ratio).
Acknowledgments
We greatly acknowledge Bioanalytical Group in Pharmacokinetics, Dynamics and Metabolism (Pfizer Worldwide Research & Development, Groton, CT) for bioanalytical analyses. We also thank Derek Bartlett, Pei-Pei Kung, and Mary Spilker (Medicine Design, Pfizer Worldwide Research & Development, San Diego, CA) for excellent input on the draft manuscript.
Authorship Contributions
Participated in research design: Yamazaki, Gukasyan, Wang, Uryu, Sharma.
Conducted experiments: Gukasyan, Wang, Uryu.
Performed data analysis: Yamazaki.
Wrote or contributed to the writing of the manuscript: Yamazaki, Sharma.
Footnotes
- Received October 29, 2019.
- Accepted February 12, 2020.
↵1 Current affiliation: Pharmaceutical Development, Allergan Plc, Irvine, California.
This study was sponsored by Pfizer, Inc.
↵
 This article has supplemental material available at jpet.aspetjournals.org.

Abbreviations
- CL/F
- apparent clearance
- DLBCL
- diffuse large B-cell lymphoma
- EC70
- effective concentration for 70% of maximal effect
- EZH2
- enhancer of zeste homolog 2
- Fa
- fraction of the dose absorbed
- H3K27
- histone H3 on lysine 27
- KC50
- plasma concentration of PF06821497 causing one-half Kmax
- KE50
- H3K27me3 inhibition index producing 50% of Kmax
- LC-MS/MS
- liquid chromatography tandem mass spectrometry
- OFV
- objective function value
- PD
- pharmacodynamic
- PDDZ
- pharmacodynamic-disease
- PK
- pharmokinetic
- PKDZ
- pharmacokinetic-disease
- PKPD
- pharmacokinetic-pharmacodynamic
- PRC
- polycomb repressive complex
- Q/F
- apparent intercompartmental clearance
- Tsc
- tumor stasis concentration
- V1/F
- apparent central volume of distribution
- V2/F
- apparent peripheral volume of distribution
- Copyright © 2020 by The American Society for Pharmacology and Experimental Therapeutics


