


Abstract
Erythromycin is a substrate of cytochrome P4503A4 (CYP3A4) and multiple drug transporters. Although clinical evidence suggests that uptake transport is likely to play a dominant role in erythromycin’s disposition, the relative contributions of individual pathways are unclear. Phenotypic evaluation of multiple pathways generally requires a probe drug cocktail. This approach can result in ambiguous conclusions due to imprecision stemming from overlapping specificity of multiple drugs. We hypothesized that an individualized physiologically based pharmacokinetic modeling approach incorporating 14CO2 production rates (iPBPK-R) of the erythromycin breath test (ERMBT) would enable us to differentiate the contribution of metabolic and transporter pathways to erythromycin disposition. A seven-compartmental physiologically based pharmacokinetic (PBPK) model was built for 14C-erythromycin administered intravenously. Transporter clearance and CYP3A4 clearance were embedded in hepatic compartments. 14CO2 production rates were simulated taking the first derivative of by-product 14CO2 concentrations. Parameters related to nonrenal elimination pathways were estimated by model fitting the ERMBT data of 12 healthy subjects individually. Optimized iPBPK-R models fit the individual rate data well. Using one probe, nine PBPK parameters were simultaneously estimated per individual. Maximum velocity of uptake transport, CYP3A4 clearance, total passive diffusion, and others were found to collectively control 14CO2 production rates. The median CYP3A4 clearance was 12.2% of the input clearance. Male subjects had lower CYP3A4 activity than female subjects by 11.3%. We applied iPBPK-R to ERMBT data to distinguish and simultaneously estimate the activity of multiple nonrenal elimination pathways in healthy subjects. The iPBPK-R framework is a novel tool for delineating rate-limiting and non-rate-limiting elimination pathways using a single probe.
SIGNIFICANCE STATEMENT Our developed individualized physiologically based pharmacokinetic modeling approach incorporating rate data (iPBPK-R) enabled us to distinguish and simultaneously estimate the activity of multiple nonrenal elimination pathways of erythromycin in healthy subjects. A new interpretation of erythromycin breath test (ERMBT) data was also obtained via iPBPK-R. We found that rate data have rich information allowing estimation of per-person PBPK parameters. This study serves as proof of principle that the iPBPK-R framework is a novel tool for delineating rate-limiting and non-rate-limiting elimination pathways using a single probe. iPBPK-R can be applied to other rate-derived data beyond ERMBT. Potential areas of application include drug–drug interaction, pathophysiological effects on drug disposition, and the role of biomarkers on hemodialysis efficiency utilizing estimated adjustment factors with correlation analysis.
Introduction
The macrolide antibiotic erythromycin is a nonrenally cleared drug that undergoes hepatic elimination via multiple pathways (Lam et al., 2006; Nolin, 2008; Benet, 2009; Franke et al., 2011; Chu et al., 2013). In the past, erythromycin was commonly used as a metabolic probe drug. It was administered intravenously and employed in the erythromycin breath test (ERMBT) to noninvasively measure in vivo hepatic CYP3A4 activity (Turgeon et al., 1994; Hirth et al., 2000; Nolin et al., 2006a; de Wildt et al., 2007). Use of the ERMBT in this manner relied on the premise that intravenously administered radiolabeled erythromycin undergoes N-demethylation by CYP3A4 in the liver and that 14CO2, a final by-product of the CYP3A4-mediated elimination pathway, is rapidly detected in breath (Nolin et al., 2006a; de Wildt et al., 2007). However, it is now known that erythromycin also undergoes hepatic drug transport—that is, hepatic clearance by organic anion transporting polypeptides (OATPs), P-glycoprotein (P-gp), and multidrug resistance-associated protein 2 (MRP2)–mediated elimination pathways (Lan et al., 2000; Sun et al., 2004; Kurnik et al., 2006; Lam et al., 2006; Frassetto et al., 2007; Franke et al., 2011; Chu et al., 2013).
After hepatic uptake transport by OATPs into the cells, 14C-erythromycin partly undergoes N-demethylation by CYP3A4 and gets converted to N-demethylated metabolites and 14C-formaldehyde. 14C-formaldehyde gets mostly converted to 14C-formate. Subsequently, 14CO2 is released and exhaled in breath in this CYP3A4-mediated pathway. Meanwhile, unmetabolized drug and N-demethylated metabolites are excreted by the transporter P-gp (Kurnik et al., 2006; Frassetto et al., 2007). Accordingly, interpretations of ERMBT data were misleading under the assumption that the erythromycin clearance was dependent solely on CYP3A4-mediated metabolism (Rivory and Watkins, 2001; Rivory et al., 2001). Although some studies with ERMBT concluded that there was a positive or inverse relationship between an ERMBT measure and a change in CYP3A4 activity (Turgeon et al., 1994; Hirth et al., 2000; Nolin et al., 2006a), a pilot pediatric study showed neither a consistent peak of 13CO2 flux across preterm infants nor a potential use of ERMBT for measuring CYP3A activity in these patients (de Wildt et al., 2007). The ERMBT has been reported to correlate poorly with the clearance of other drugs (Krivoruk et al., 1994; Krecic-Shepard et al., 1999). Furthermore, clinical studies with OATP and/or P-gp inhibitors (Kurnik et al., 2006; Frassetto et al., 2007) or a MRP2 variant (Franke et al., 2011) indicated that the effects of uptake and efflux transporters on erythromycin disposition would need to be accounted for in the interpretation of ERMBT results. Consequently, research using the ERMBT became less attractive and less common. In fact, it was determined that more research on the ERMBT itself was necessary to establish its reliability (Watkins, 1994; Spivey, 2000; Rivory et al., 2001; Frassetto et al., 2007).
The 14CO2 production rate measurement of ERMBT results may provide a unique opportunity to differentiate contributions of metabolic versus transporter-mediated pathways to erythromycin disposition, since 14CO2 concentration in breath is proportional to the 14CO2 production rate in the hepatocyte. Moreover, contributions of specific pathways may be estimated within individuals or per person when physiologically based pharmacokinetic (PBPK) modeling is applied to 14CO2 production rate data. By measuring the breath concentration as proxy for 14CO2 production rate, a hidden behavioral signal can be captured, which is usually unrecognized and treated as noise in modeling mean drug concentrations (Oppenheim and Schafer, 2009). Thus, the advantage of incorporating measured 14CO2 production rate into PBPK modeling is that the concentration change, or rate, contains greater information and is more sensitive to physiologic changes compared with concentration itself (Fig. 1). Therefore, multiple elimination pathways of a single drug can be differentially estimated using the rate data.

Examples of the impact of PBPK parameters on the shape of the 14CO2 production rate–time curves compared with the shape of the 14CO2 concentration–time curves in the hepatocyte. In each of the four panels (subjects A–D), the main plot shows the 14CO2 production rate–time curve and the inset smaller panel shows the corresponding14CO2 concentration–time curve. Both curves were simulated using PBPK modeling. The upper left panel illustrates the 14CO2 production rate–time curve and 14CO2 concentration–time curve for a hypothetical healthy subject denoted subject A. In the upper right panel, subject B has a lower CYP3A4 clearance compared with the 14CO2 production rate–time curve of subject A and the 14CO2 production rate–time curve of subject B is flatter without presenting a sharp peak accordingly. In the lower left panel, subject C has a higher peak of the 14CO2 production rate–time curve due to the increased maximum velocity of the uptake drug transport compared with subject A. In the lower right panel, subject D shows the greater AUC of the 14CO2 production rate–time curve due to the decreased volume of the hepatocyte compared with subject A. Subject D has less steep slopes in the first and second elimination phases of the 14CO2 production rate–time curve due to the decreased partition coefficient of the combined other organs compared with those of subject A. Note that the curves of subjects B–D were simulated by changing particular parameter(s) based on the curves of subject A, and these subjects are hypothetical examples.
The aim of this work was to estimate the activity and corresponding contribution of multiple nonrenal clearance pathways to the elimination of a single probe (erythromycin) with our novel individualized physiologically based pharmacokinetic modeling approach using rate data (iPBPK-R). This study establishes proof of concept that rate data may be used as a method for estimating the activities and differentiating the contribution of multiple clearance pathways to the elimination of a single probe drug that exhibits overlapping substrate specificity. We anticipate that the iPBPK-R framework will be applicable to breath rate data of other compounds, such as volatile organic compounds (O’Hara et al., 2009; Grabowska-Polanowska et al., 2019), to evaluate drug–drug interactions, disease effects on drug disposition, and the relationship between potential biomarkers and intervention, among others.
Materials and Methods
Clinical Data Sources.
The 14CO2 production rate data were obtained from a prospective cohort study in which the ERMBT was administered to 12 healthy Caucasian subjects (seven male) (Nolin et al., 2006b). Briefly, a single 0.074 mmol (0.04 mg, 3 μCi) dose of [14C-N-methyl] erythromycin (Metabolic Solutions Inc., Nashua, NH) was intravenously administered and breath samples were collected immediately before receiving the dose and at 5, 10, 15, 20, 30, 40, 50, 60, 90, and 120 minutes postdosing as previously described (Nolin et al., 2006a). The study adhered to the Declaration of Helsinki and was approved by the Maine Medical Center Institutional Review Board and the Radiation Safety Committee. Parameters for which no in vitro values were available in the published literature and that could not be calculated using the in vitro–in vivo extrapolation (IVIVE) approach were estimated by applying the PBPK-R model (described in the next subsections) to the previously published 14CO2 production rate at 20 minutes (Frassetto et al., 2007).
PBPK Model Structure.
As shown in Fig. 2, a PBPK model comprising six organ compartments was built with pharmacokinetic parameters for 14C-erythromycin. These compartments were artery (Art), Vein, lung (LG), liver (LV), kidney (KD), and combined other organs (OT). The liver compartment consisted of two subcompartments: extracellular space (ES) and liver cell (LC). A nonlinear meta-uptake transporter (OATPs are combined; see the Model Assumptions section) and total passive diffusion modeled the drug transfer between the ES and LC subcompartments. Nonlinear efflux transporters (P-gp and MRP2) and CYP3A4 clearance were modeled in the LC compartment. CYP3A4 clearance was observed to be linear, which is not surprising since a low dose of 14C-erythromycin was administered and it was expected that its concentration was well below the maximum velocity of nonlinear kinetics.

Schematic representation of a PBPK model for describing the time profiles of 14C-erythromycin after intravenous 14C-erythromycin administration in a healthy subject. The PBPK model consisting of six organ compartments was built with pharmacokinetic parameters for 14C-erythromycin. The upper right panel shows the liver composed of two subcompartments (ES and LC) where nonlinear uptake and efflux transporters and linear enzymatic clearance were embedded. In the lower right panel, the metabolic by-product model is illustrated where the metabolite 14C-formate is converted to radiolabeled bicarbonate H14CO3− in the CYP3A4-mediated pathway and dissolved in the LC subcompartment. The series of conversion from 14C-formaldehyde to H14CO3− is assumed to be a rapid process and nonrate limiting. Then, 14CO2 is produced and exhaled in breath as a result of the first-order elimination of bicarbonate (with a constant kresp) from the LC subcompartment. IV, intravenous.
Ordinary Differential Equations, Kinetic Parameters, and Data Input.
Changes in drug concentrations of all compartments and subcompartments contained within the PBPK model were mathematically described with a set of ordinary differential equations (ODEs) (see Supplemental Material). We used permeability-limited liver models in the ODEs associated with the ES and LC subcompartments (Jamei et al., 2014). In addition, we referred to Kanamitsu et al. (2000) for the metabolic by-product model to describe the series of non-rate-limiting steps from 14C-formaldehyde to bicarbonate and subsequent 14CO2 generation within the LC subcompartment. This allowed us to approximate the CO2 concentration in the breath through the first derivative of the cumulative CO2 concentration generated in the LC subcompartment (CO2 concentration rate of the LC subcompartment) (see Fig. 2 and the Model Assumptions section). Table 1 provides physiological and kinetic parameters that were calculated based on IVIVE. These parameter values were used as initial input values in the iPBPK-R model fitting.
Parameters used for the erythromycin breath test simulations
Rate Data and Reduced Order Model.
Frequently sampled rate data has more information compared with equivalently sampled concentration data. However, it requires more effort to extract the information. Nonlinear model fitting of measured first derivative data is often performed to estimate sensitive parameters in established methodologies used in digital signal processing and other engineering disciplines (Oppenheim and Schafer, 2009). We modeled the 14CO2 production rates from the ERMBT study using the same concept, which is illustrated in Fig. 1. Accordingly, the iPBPK-R method was applied to the 14CO2 production rate data, and multiple hepatic elimination pathways (i.e., uptake and efflux transport and passive diffusion parameters) were estimated using the single probe drug 14C-erythromycin. To achieve high precision in model fitting to the high-resolution 14CO2 rate data, we used a reduced order model (Schilders et al., 2008). Reduced order models are generally complex enough to capture the behavior of interest but simple enough so that the mathematical models are well-posed, providing estimable parameters. Based on this rationale, the seven-compartmental PBPK model was built as described in the above subsections PBPK Model Structure and Ordinary Differential Equations, Kinetic Parameters, and Data Input.
Model Assumptions.
The number of compartments was limited to seven including subcompartments to facilitate fitting of PBPK models to ERMBT data while enabling estimation of the activity and corresponding of effect of CYP3A4 and drug transporters on erythromycin disposition. The modeling was carried out under the following assumptions:
14C-erythromycin is intravenously administered for 30 seconds.
Except for the liver and kidney compartments, all compartments were assumed to be perfusion limited, where the distribution of a drug rapidly reaches equilibrium via passive diffusion and the unbound concentration in the compartment is the same as those in the diffused space at equilibrium. Perfusion-limited compartments were described with a well stirred model (Kanamitsu et al., 2000; Maeda and Sugiyama, 2013).
Pathways from the ES compartment to the LC compartment for erythromycin are composed of total passive diffusion plus summation of uptake transporters only. Erythromycin mainly undergoes hepatic uptake transport by OATP isoforms OATP1B1 and OATP1B3. These uptake transport processes were modeled as a single meta-uptake process.
CO2 is present in the systemic circulation under steady-state conditions. Accordingly, 14CO2 is instantaneously released in breath via the lung without being stored in or released from any other compartments after it gets generated in the LC subcompartment.
We assume that a metabolite 14C-formate is converted to radiolabeled bicarbonate H14CO3− as a by-product in the CYP3A4-mediated pathway and dissolved in the LC subcompartment. The series of conversion from 14C-formaldehyde to 14C-formate through to H14CO3− is rapid and not rate limiting as assumed by Sugiyama et al. (2011). The final by-product 14CO2 in this elimination pathway is produced and exhaled in breath as a result of a first-order elimination of bicarbonate (with a constant kresp) from the LC subcompartment (Sugiyama et al., 2011).
The liver (composed of ES and LC subcompartments) and the kidneys (kidney compartment) are elimination organs. In addition, a parameter μ was included in the combined other organs compartment to explain the exponential decay that was seen in the observed 14CO2 production rate data. We anticipated that this parameter μ would improve the model fitting. Thus, the exponential decay was assumed to explain any loss or decomposition of the drug before the drug reaches the liver in the system.
The unbound drug, but not the bound drug, is subject to uptake and efflux transport, enzymatic metabolism, and elimination in the liver.
For the intrinsic clearance of CYP3A, linearity was assumed after investigating the model fitting in comparison with nonlinear intrinsic clearance.
Simulations, Optimizations, and Sensitivity Analysis.
We developed the individualized PBPK modeling of rate (iPBPK-R) framework shown in Fig. 3. Specifically, concentration–time curves of 14C-erythromycin and enzymatic by-products H14CO3− and 14CO2 were simulated for individual subjects based on the ODEs (Fig. 2; Supplemental Material). 14CO2 production rates were simultaneously simulated by taking the first derivative of cumulative 14CO2 data generated.

Framework of the application of iPBPK-R to the ERMBT study in 12 healthy subjects.
Parameters were optimized via a three-step iPBPK-R framework (Fig. 3). In each step, a nested optimization was used. In the first and second steps, the fraction of the drug filtered via the glomerulus (δ) and the expression ratio of P-gp transporters between liver and kidney compartments were preestimated in the inner optimization loop of the iPBPK-R model fitting to the previously published mean 14CO2 production rate at 20 minutes after ERMBT (Frassetto et al., 2007). In the same two steps, four PBPK parameters (maximum velocity of the meta-uptake transport process, CYP3A4 clearance, partition coefficient in the combined other organs, and exponential decay parameter μ) were preestimated via the outer loop optimization. The preestimated parameter values in the first two steps were used as initial input values in the third step. In the third step (main step), the nested optimization process consisting of the inner loop and outer loop was used to optimize and estimated IVIVE adjustment factors for five PBPK parameters (maximum velocity of two efflux transporters P-gp and MRP2, volume of total hepatocyte, blood flow into the combined other organs, and total passive diffusion between extracellular space and hepatocyte). This was done so that we could implement iPBPK-R model fitting to the observed 14CO2 production rates between 0 and 120 minutes in 12 healthy subjects. In this step, the model fit was evaluated using normalized residuals between predicted and observed rates, visual inspection, and plausibility of the resulting parameter estimates. Among the PBPK parameters in Table 1, nine outer loop parameters (see Fig. 1) were selected to optimize and estimate since they were essential parameters for model fitting based on visual investigation and sensitivity analysis. In fact, adjustment factors for maximum velocity of efflux transporters did not have a critical effect of controlling the shape of the 14CO2 production rate–time curves. However, these parameters were kept for optimization since they were part of nonrenal elimination pathways. The three scaling parameters in the inner optimization loop in the third step (Fig. 3) were used to calculate final adjustment factors for IVIVE values of transporter kinetics. One cycle of fixed-point iteration was conducted and the results of the third step outer loop were used in subsequent simulations to refine the parameter estimates.
All of the simulations and parameter estimations were implemented with the programming language and free software environment R 3.4.4. The R package deSolve was used for solving the set of ODEs, and large-scale simulations were conducted via the Bridges supercomputer at the Pittsburgh Computing Center (Towns et al., 2014). Methodological details of the iPBPK-R approach will be described in a methodological manuscript under preparation (Franchetti Y et al., manuscript in preparation). Some methodological features were discussed at the Society of Industrial and Applied Mathematics Conference on Computational Science and Engineering (Franchetti Y, Nolin TD, and Franchetti F. Towards precision medicine: Simulation based parameter estimation for drug metabolism. Society of Industrial and Applied Mathematics (SIAM) Conference on Computational Science and Engineering (CSE19), February 2019).
Statistical Analysis.
Our primary aim was to simultaneously estimate pharmacokinetic (PK) parameters associated with metabolic versus transporter-mediated pathways within individual study subjects using iPBPK-R. Descriptive statistics were presented with the mean ± S.D. and/or the median (range). The 25th and 75th percentiles were also obtained for creating box plots. This study explored feasibility and estimability on model parameters, and no statistical test was powered in advance. Assuming that all measurements were non-normally distributed, one-sided Wilcoxon–Mann–Whitney tests were conducted for comparing two independent groups. Spearman’s ρ correlation coefficients were calculated in correlation analysis for studying the relationships between estimated adjustment factors for nonrenal elimination parameters and baseline demographic or uremic solute concentrations [blood urea nitrogen (BUN), serum creatinine, and tumor necrosis factor-α]. An adjustment factor of 1 means that there was no need to adjust the initial parameter input value in the optimization. A P value < 0.05 was considered statistically significant for all comparisons. All statistical analyses were conducted using SAS 9.4 (SAS Institute Inc., Cary, NC).
Results
The iPBPK-R model was applied to fit the observed 14CO2 production rate data for the 12 healthy subjects (Fig. 4). The nested optimization procedure yielded parameter estimates for all subjects, and the excellent model fit was confirmed with the normalized residual–time plots across subjects (mean 10−4, S.D. 10−4) (Fig. 5; Table 2; Supplemental Table 1).
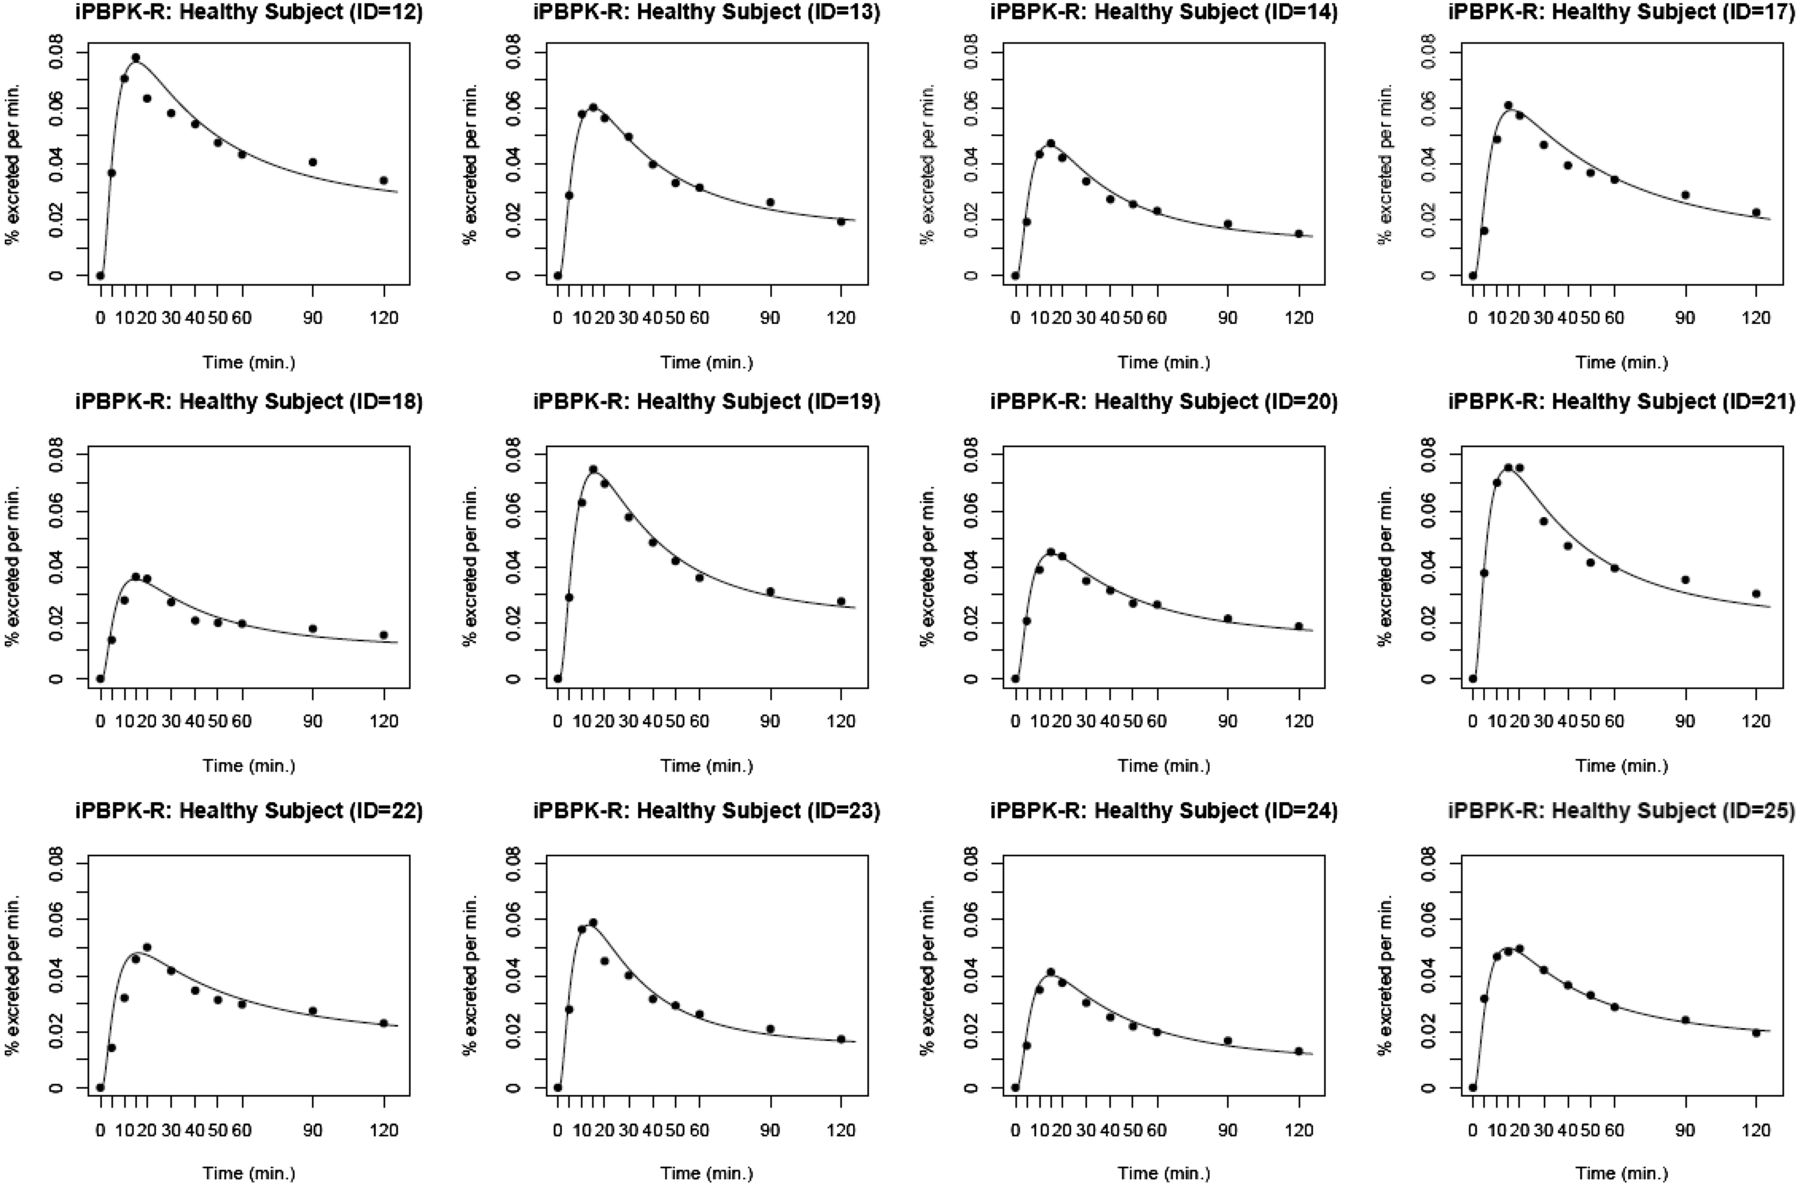
iPBPK-R model fitting to the individual ERMBT data from the 12 healthy subjects. The black lines are modeled curves and the black dots indicate the observed 14CO2 production rates.

Normalized residual–time plots for the 12 healthy subjects. Residuals were obtained from iPBPK-R model fitting to the ERMBT data (results are shown in Fig. 4). The black dots are normalized residuals.
Parameter estimates through the nested optimization and normalized residuals in the iPBPK-R modeling of the ERMBT study in 12 healthy subjects
The estimated adjustment factors for parameters in the liver and combined other organ compartments are shown in Figs. 6A and 7, respectively. The estimated median CYP3A4 clearance was 87.8% lower than the original IVIVE value (adjustment factor = 0.122 in Fig. 6A) and the median adjustment factor for total passive diffusion was 33.5% lower than the original IVIVE value (adjustment factor = 0.665 in Fig. 6A). The adjustment factor for maximum velocity (Vmax) of the meta-uptake transporter varied by individual (25th quantile adjustment factor, 0.74; 75th quantile adjustment factor, 0.99). When stratified by sex (Fig. 6B), the adjustment factor for Vmax of the meta-uptake transporter did not differ by sex; a few female healthy subjects had reduced uptake transport activity (median adjustment factor in male/female subjects = 0.99: 0.67; one-sided exact P = 0.10). Vmax of efflux transporters (P-gp and MRP2) did not require an adjustment from the original IVIVE values, since the estimated median and mean adjustment factors were 1.00. The median adjustment factors for total hepatocyte volume, CYP3A4 clearance, and total passive diffusion varied among individuals (Fig. 6A). In the combined other organs compartment (Fig. 7), arterial blood flow barely required IVIVE adjustment (median adjustment factor 0.87 or 13% decrease from the IVIVE value), whereas IVIVE values of exponential decay μ and partition coefficient needed to be adjusted as high as 4.0 and 18.8 times (by median), respectively. The latter two parameters did not vary by individual but the adjustment factor for arterial blood flow relatively varied by individual (25th quantile adjustment factor, 0.52; 75th quantile adjustment factor, 0.99). Since the meta-uptake transporter, CYP3A4 clearance, volume of total hepatocyte, and total passive diffusion varied in their adjustment factor, we stratified these adjustment factors by sex in the box-and-whisker plots (Fig. 6B). When compared by sex using one-sided Wilcoxon–Mann–Whitney tests, CYP3A4 clearance was significantly lower in male than in female subjects (median reduction from the IVIVE value in male/female subjects = 89.3%:78.0%; one-sided exact P = 0.04). The total hepatocyte volume and total passive diffusion did not differ by sex (one-sided exact P = 0.27 and 0.17, respectively).

(A) Estimated IVIVE adjustment factors for PBPK parameters in the liver compartments (ES and LC subcompartments). The PBPK parameters are maximum velocity of the meta-uptake transporter, maximum velocity of P-gp, maximum velocity of MRP2, CYP3A4 clearance, the volume of the hepatocyte, and total passive diffusion between ES and LC subcompartments (from the left to the right on the x-axis). These PBPK parameters were estimated in the main step (third step) of the iPBPK-R framework as shown in Fig. 3. (B) Estimated IVIVE adjustment factors in the liver compartments stratified by sex. These selected estimates adjust CYP3A4 clearance, the volume of the hepatocyte, and total passive diffusion between ES and LC subcompartments. When the IVIVE adjustment factor is estimated to be 1, it is interpreted that the parameter input was not adjusted from the original IVIVE input value through the iPBPK-R model fitting. Exact P values are shown based on Wilcoxon–Mann–Whitney tests for comparing between male and female subjects (one-sided test). *P < 0.05 (statistically significant difference).
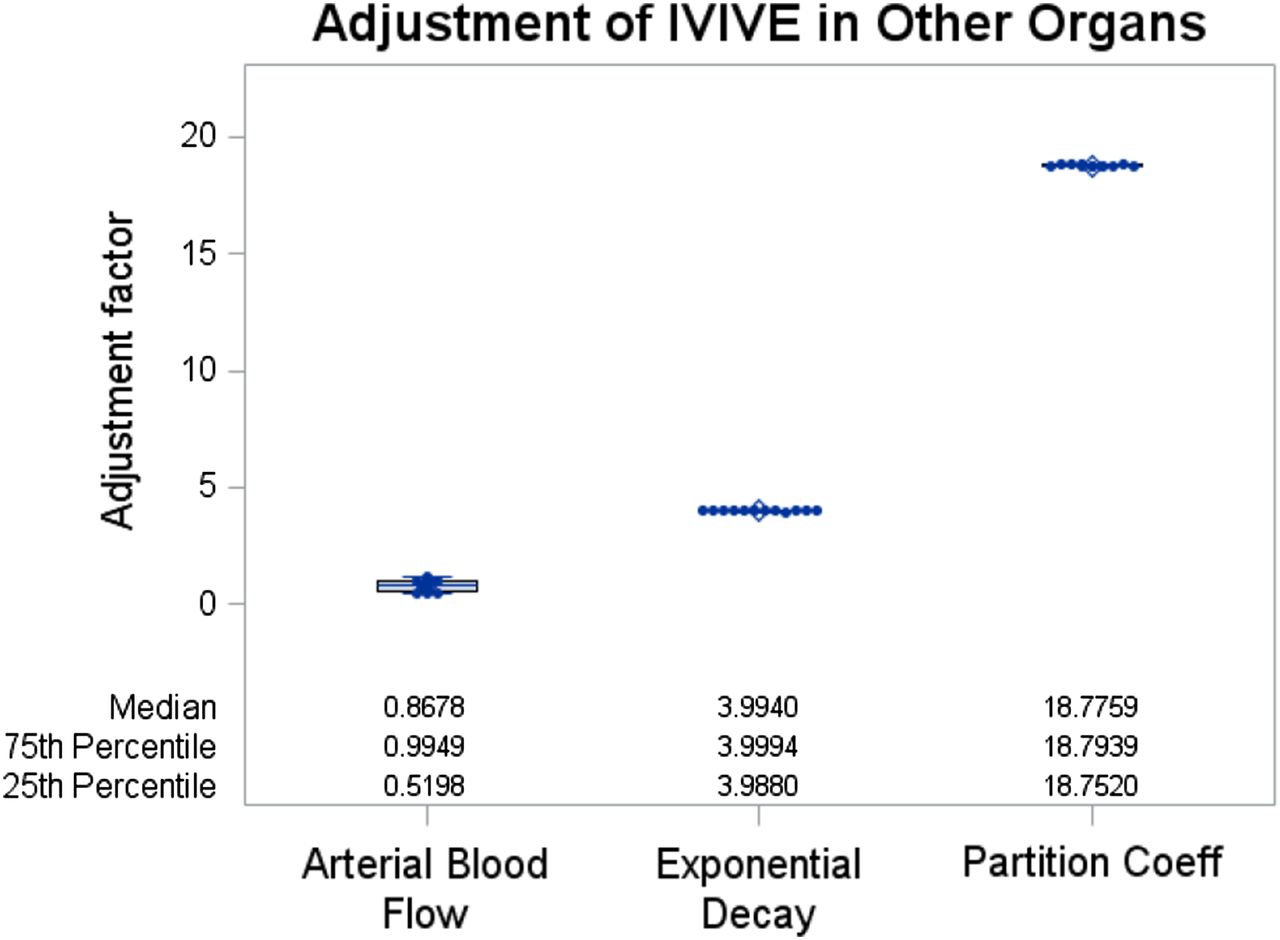
Estimated IVIVE adjustment values for PBPK parameters in the combined other organs (OT) compartment. The PBPK parameters are arterial blood flow, exponential decay, and partition coefficient between OT and plasma, respectively (from the left to the right on the x-axis). These PBPK parameters were estimated in the main step (third step) of the iPBPK-R framework as shown in Fig. 3. When the IVIVE adjustment value is estimated to be 1, it is interpreted that the parameter input was not adjusted from the original IVIVE input value through the iPBPK-R model fitting.
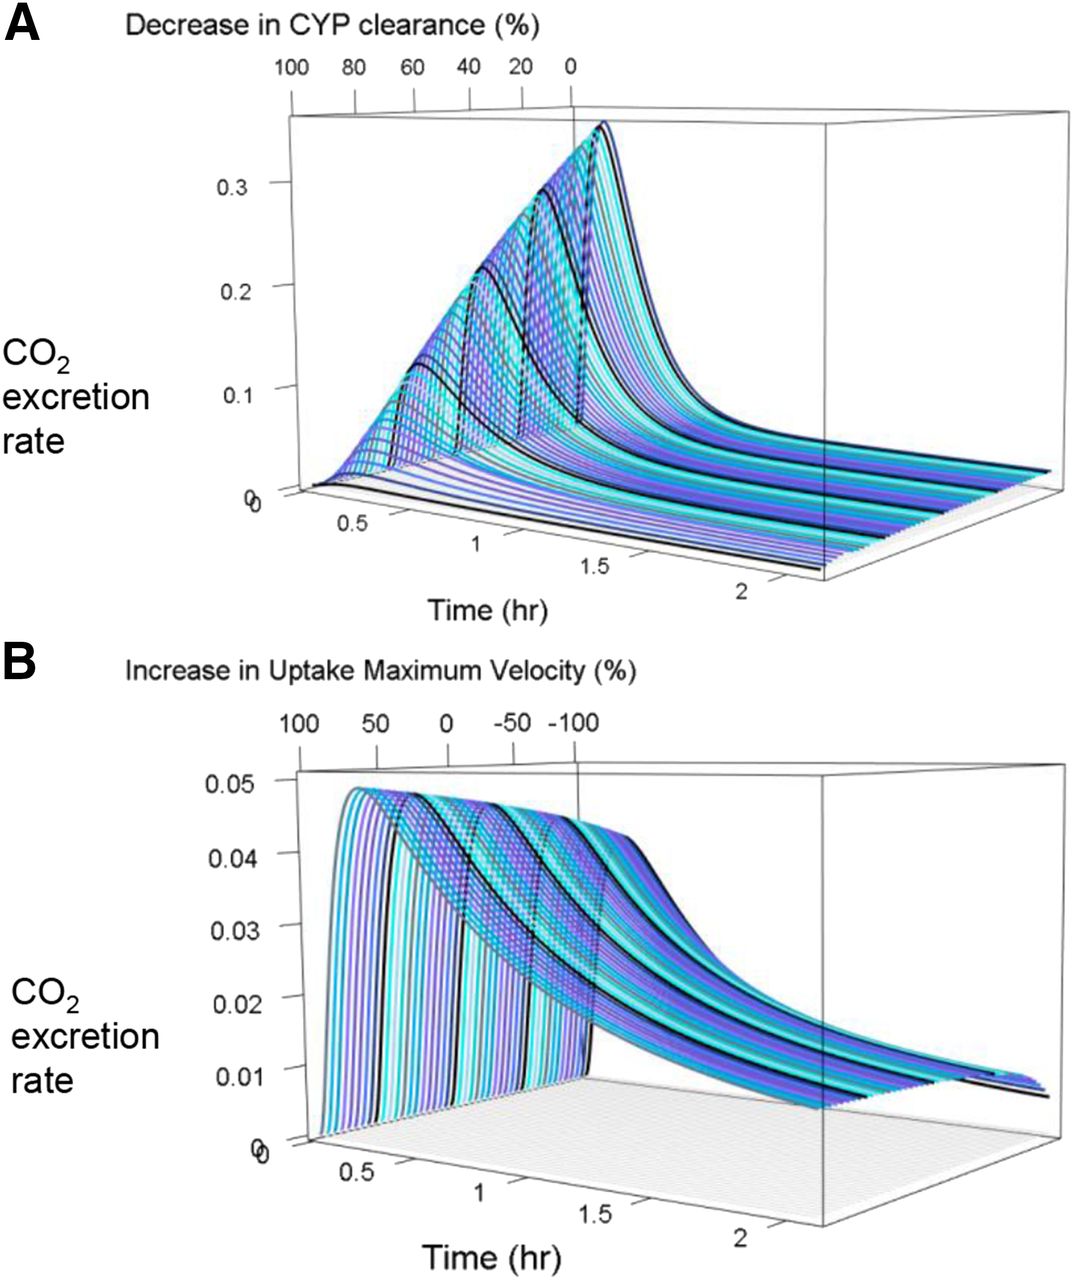
The observed 14CO2 production rate–time curves of 12 healthy subjects had three phases: 1) the increasing absorption/distribution phase, 2) the first elimination phase, and 3) the second elimination phase (depicted by the black dots in Fig. 4). Through the sensitivity analysis in the iPBPK-R model fitting, we found that multiple physiologic parameters interact and control the shape of the 14CO2 production rate–time curve (Fig. 8). When CYP3A4 clearance increases, the peak height and the area under the curve (AUC) increase with a steeper absorption phase. Vmax of uptake drug transport and total passive diffusion together control the peak height, the first elimination phase, and the second elimination phase of the curve. As part of the sensitivity analysis, we simulated 14CO2 production rate–time curves with one additional varying parameter (see three-dimensional plots in Fig. 9). In Fig. 9A, CYP3A4 clearance varied from 1% to 100% of the IVIVE value. In Fig. 9B, Vmax of the meta-uptake transporter varied from 1% to 200% while keeping the total passive diffusion at 50% of its optimal value. Modeled 14CO2 production rates were sensitive to changes in CYP3A4 clearance (see Fig. 9A). Changes in total passive diffusion and uptake drug transport together had an effect on the shape of 14CO2 production rate–time curves (Fig. 9B).

ERMBT data interpretation as a result of the application of iPBPK-R. The modeled 14CO2 concentration–time curve represents three phases: the increasing absorption phase, the first elimination phase after the peak of the curve, and the second elimination phase. Red line and text: The increased absorption phase gets less steep as CYP3A4 clearance decreases. Blue line and text: The peak of the curve increases as 1) CYP3A4 clearance increases, 2) maximum velocity of the meta-uptake transporter increases, 3) arterial blood flow in the combined other organ (OT) compartment (QOT,Art) decreases, 4) the partition coefficient of OT to plasma decreases, and/or 5) total passive diffusion between ES and LC subcompartments increases. Green line and text: the first elimination phase of the curve gets less steep as 1) the partition coefficient of OT to plasma decreases, 2) maximum velocity of the meta-uptake transporter increases, and/or 3) QOT,Art increases. Yellow line and text: the second elimination phase of the curve gets less steep or shifts upward as 1) the partition coefficient of OT to plasma decreases, 2) exponential decay in the OT compartment decreases, and/or 3) total passive diffusion between ES and LC subcompartments decreases. Purple text: the AUC of the curve increases as 1) the volume of the hepatocyte decreases, 2) CYP3A4 clearance increases, and/or 3) QOT,Art decreases.

Example of sensitivity analysis. Simulated 3D 14CO2 production rate–time curves where (A) CYP3A4 clearance was varied from 1% to 100% of the IVIVE value and (B) maximum velocity of the meta-uptake transporter was varied from 1% to 200% while keeping the total passive diffusion at 50% of its optimal value. CYP, cytochrome P450.
As an exploratory analysis, Spearman correlation analysis between the estimated adjustment factors for nonrenal elimination parameters (Vmax of meta-uptake transporters, CYP3A4 clearance, and total passive diffusion) and baseline parameters was conducted (see Table 3; Supplemental Table 2). These baseline parameters were demographic and physical factors (height, weights, age, and estimated glomerular filtration rate) and uremic solute concentrations including serum creatinine, BUN (a low molecular weight solute), and tumor necrosis factor-α (a middle molecular weight solute). In all 12 subjects, the correlation coefficient between BUN and the adjustment factor for Vmax of meta-uptake transporters was estimated to be negative and strong, and this correlation was statistically significant (ρ = −0.608; P = 0.04) (Table 3). In the male subjects, BUN was negatively correlated with the adjustment factors for Vmax of meta-uptake transporters (ρ = −0.857; P = 0.01), CYP3A4 clearance (ρ = −0.857; P = 0.01), and passive diffusion (ρ = −0.821; P = 0.02), which were very strong according to Evans’ correlation criteria (Evans, 1996) (Supplemental Table 2).
Spearman correlation coefficients among the estimated PBPK parameters, demographic and physiologic data, and uremic solute concentrations in 12 healthy subjects
Discussion
This is the first study to show that the activity of multiple nonrenal elimination pathways can be estimated within individual study subjects with a single probe drug, erythromycin, via PBPK modeling and optimization-based model fitting of rate data (iPBPK-R). The iPBPK-R method is distinctly different from and advantageous over other approaches that use multiple pathway-specific probes (i.e., the “cocktail” approach). The cocktail approach may lead to higher imprecision due to 1) uncertainty in parameter estimates pertinent to different probes’ characteristics, 2) varying interactions with physiologic properties, and 3) intercohort variabilities (Zhou et al., 2004; Smith et al., 2007). The iPBPK-R method overcomes these by utilizing the distinct and dynamic information contained in rate data solely obtained with a single probe.
Nonlinear model fitting of measured rate data (Oppenheim and Schafer, 2009) was adopted in our individualized PBPK modeling, which enabled multiple-parameter optimization to achieve high accuracy (see the normalized residual plots in Fig. 5). Figure 1 illustrates that the 14CO2 production rate data contain more information than the cumulative 14CO2 concentration data when they are observed. First, as shown in the inset panels for hypothetical subjects A, B, C, and D, the simulated curves of the cumulative amount of 14CO2 generated during the study period are not sensitive to any underlying parameter changes since all four subjects’ cumulative curves look similar. On the other hand, simulated curves of 14CO2 production rates show a dynamic change depending on the parameter change, since the shape of the rate–time curves visibly differs across the subjects. This illustrates that, for a given measurement accuracy, measuring the first derivative data allows us to estimate parameter differences while these differences cannot be estimated from the original data. The iPBPK-R method used here leverages this for the purposes of characterizing multiple nonrenal clearance pathways simultaneously.
Historically, erythromycin was commonly used as a metabolic probe drug. It was administered intravenously and employed in the ERMBT to noninvasively measure in vivo activity of hepatic CYP3A4 (Turgeon et al., 1994; Hirth et al., 2000; Nolin et al., 2006a; de Wildt et al., 2007). However, it is now known that erythromycin undergoes hepatic clearance by OATPs, P-gp, and MRP2-mediated elimination pathways as well (Lan et al., 2000; Sun et al., 2004; Kurnik et al., 2006; Lam et al., 2006; Frassetto et al., 2007; Franke et al., 2011; Chu et al., 2013). Accordingly, interpretations of ERMBT data were misleading under the assumption that erythromycin clearance was dependent solely on CYP3A4-mediated metabolism (Rivory and Watkins, 2001; Rivory et al., 2001). We were interested in accounting for the multiple nonrenal elimination pathways of erythromycin and estimating corresponding kinetic parameters within individual healthy subjects through modeling observed rate data. Rate data is commonly used in engineering disciplines, typically in digital signal processing. We anticipated that by applying mechanistic iPBPK-R to the ERMBT data, we could simultaneously estimate the activity of multiple nonrenal elimination pathways. Although this is a pilot study, we found that CYP3A4 activity was consistently estimated to be lower than the IVIVE-based CYP3A4 activity in all subjects. We showed that CYP3A4 clearance, uptake transport, and other physiologic parameters collectively control the 14CO2 production rates of the ERMBT (Figs. 8 and 9). This serves as a proof of principle that the iPBPK-R framework is a novel tool for delineating rate-limiting and nonrate-limiting elimination pathways using a single probe.
Simultaneous estimation of the activity of multiple nonrenal elimination pathways facilitates studying the interaction between enzymatic metabolism and drug transport or enzyme-transporter interplay (Benet, 2009). As discussed previously, the ERMBT was actively used to probe in vivo CYP3A catalytic activity in the past. However, across clinical studies using the ERMBT, there were conflicting results in predicting total body clearance from the 14CO2 production rate analysis. Rivory et al. (2001) discussed possible causes for the inconsistent results among the ERMBT studies. The reasons included high interindividual variability of the 14CO2 production rate data, potential overestimation of 14CO2 production in female subjects, and use of different type of measurements among studies (i.e., inverse time to the peak, 14CO2 production rate at 20 minutes, and AUC from 0 to 2 hours). Because erythromycin was found to be a substrate of not only CYP3A but also P-gp, Mrp2, and Oatp2 in in vitro studies (Sun et al., 2004; Franke et al., 2011), studying the effect of enzyme-transporter interplay on nonrenal drug elimination became essential (Chu et al., 2013). To study the enzyme-transporter interplay, mechanistic PBPK modeling is a useful tool because it allows us to explicitly describe the activity of each elimination pathway in the whole body system. By combining the set of mathematical equations with multiparameter optimization, one can indirectly estimate the activity of different elimination pathways in the target organ (Chu et al., 2013). The iPBPK-R approach overcomes infeasible direct sampling of drug concentrations from the target organ where the in vivo enzyme-transporter interplay may be occurring.
In studies using the ERMBT, 14CO2 production may have been overestimated in female subjects and the difference between sexes was around 20%–25% (Rivory et al., 2001). We observed higher CYP3A4 activity in female than in male subjects and the difference between sexes was about 11%. In fact, the result for female subjects aligned with the study of human liver bank samples in which expression levels of CYP3A4 in female samples were found to be higher than in male samples (Wolbold et al., 2003). No correlation was observed between CYP3A4 activity or drug transport activity and physiologic factors, weight, height, or body mass index in all subjects or in each sex. Accordingly, our study indicated that there is a sex-related difference in CYP3A4 activity.
We further conducted correlation analysis on the adjustment factors for nonrenal elimination clearance with plasma concentrations of uremic solutes. There was a significant inverse correlation between the uremic solute BUN and the adjustment factor for Vmax of the meta-uptake transporter (OATPs) in 12 subjects (ρ = −0.608). In male subjects, significant inverse correlations were observed between BUN and maximum velocity of OATPs, CYP3A4 clearance, and passive diffusion, respectively. Despite the small sample size, we showed that correlation analysis can be used to explore relationships between the activity of nonrenal elimination pathways and potential surrogate biomarkers (such as uremic solutes) after iPBPK-R modeling.
There are several limitations in this study. First, the detailed structures in the kidney compartment were omitted and were not modeled so that multiple parameters could be estimated using a reduced order model. Second, in the reduced order PBPK model, it is not possible to distinguish the value of maximum velocity and the number of individual transporters. Third, we did not distinguish in vitro parameter values between 14C-erythromycin and erythromycin for IVIVE calculations. The two compounds are not the same but they are used interchangeably in clinical research. Therefore, the literature values are the best parameters that we could use. Fourth, no genetic variant data of OATPs were available, so we could not conclude whether low CYP3A4 activity was truly caused by the sex difference or the interplay with OATP variants. Fifth, IVIVE values were calculated based on average 70-kg male data. Although both male and female subjects were enrolled in the clinical study with ERMBT, the average body weight was close to 70 kg (68 kg). Therefore, use of the average 70-kg male data is not expected to cause a large bias. The variability in weight is reflected in the estimated adjustment factors for the total hepatic volume. Finally, the CYP3A4 and transporter activity estimates derived from iPBPK-R modeling were not compared with or validated using specific pharmacologic probe substrates as controls. The fitted model cannot be validated against the measurements beyond the breath data. However, the model is a reduced order model, and we could establish that the model was not overfitted. Furthermore, the visual inspection and normalized residuals calculated from predicted and observed curves indicated excellent model fit across all individual subjects. By conducting simultaneous optimizations of parameters and sensitivity analysis, we showed the robustness of parameter estimates and consistency in the estimated CYP3A4 activity across 12 subjects. Similarly, the estimated uptake transporter activity was robust and consistent across male subjects, whereas a wider variability was seen in female subjects.
iPBPK-R can be applied to any rate-derived data beyond ERMBT. Ideal characteristics of measurements are as follows: 1) rate measurement with long elimination half-life and frequent sampling, 2) in vitro data sufficient for IVIVE, 3) intravenous dosing, and 4) individual data. The underlying idea for measurement 1 is that rate information can be used to capture both non-rate-limiting and rate-limiting steps in elimination pathways of interest. As another example, breath rate data of volatile organic compounds can be used to study the role of potential biomarkers on hemodialysis efficiency (Grabowska-Polanowska et al., 2019). Other potential areas of application include drug–drug interaction, pathophysiological effects, and the effect of intervention, polypharmacy, or any other extrinsic factors on drug disposition by estimating adjustment factors and conducting correlation analysis. In the future, we plan to apply the iPBPK-R framework to rate data of other compounds that are known to be cleared by multiple nonrenal elimination pathways.
Conclusion
The iPBPK-R approach was applied to evaluate 14CO2 production rate data of the ERMBT in healthy subjects. Optimized iPBPK-R models fit the individual data well and they allowed us to distinguish and simultaneously estimate the activity of multiple nonrenal elimination pathways of the single probe 14C-erythromycin. The median in vivo CYP3A4 activity was estimated as low as 12.2% of the IVIVE-based CYP3A4 clearance. 14CO2 production rate data has rich information allowing estimation of per-person rate-limiting and nonrate-limiting PK parameters. Accordingly, we found that the multiple PK and physiologic parameters collectively control the 14CO2 production rate–time curve of the ERMBT. Adjustment factors for the activity of drug transporters were also estimated in all subjects. Finally, correlation analysis can be used to explore relationships between the activity of nonrenal elimination pathways and potential surrogate biomarkers (such as uremic solutes) via iPBPK-R modeling. In summary, we applied iPBPK-R to ERMBT data to distinguish and simultaneously estimate the activity of multiple nonrenal elimination pathways in healthy subjects. This serves as proof of principle that the iPBPK-R framework is a novel tool for delineating rate-limiting and non-rate-limiting elimination pathways using a single probe.
Acknowledgments
The authors thank Professor Franz Franchetti (Department of Electrical and Computational Engineering, Carnegie Mellon University) for expertise, critical review, and insightful comments regarding the manuscript.
Authorship Contributions
Participated in research design: Franchetti, Nolin.
Conducted experiments: Franchetti.
Performed data analysis: Franchetti, Nolin.
Wrote or contributed to the writing of the manuscript: Franchetti, Nolin.
Footnotes
- Received February 21, 2019.
- Accepted July 31, 2019.
This work is an extension of a study previously funded by the Satellite Healthcare Research Foundation. Y.F. is supported by an appointment to the Research Participation Program at the Center for Drug Evaluation and Research, administered by the Oak Ridge Institute for Science and Education through an interagency agreement between the U.S. Department of Energy and the U.S. Food and Drug Administration. T.D.N. is supported in part by the National Institutes of Health National Institute of General Medical Sciences [Grant R01-GM107122]. This work used the Extreme Science and Engineering Discovery Environment (XSEDE), which is supported by National Science Foundation grant number ACI-1548562, and XSEDE Bridges at the Pittsburgh Supercomputing Center through allocation BIO180015.
↵
 This article has supplemental material available at jpet.aspetjournals.org.

Abbreviations
- AUC
- area under the curve
- BUN
- blood urea nitrogen
- ERMBT
- erythromycin breath test
- ES
- extracellular space
- iPBPK-R
- individualized physiologically based pharmacokinetic modeling approach incorporating rate data
- IVIVE
- in vitro–in vivo extrapolation
- LC
- liver cell
- MRP
- multidrug resistance-associated protein
- OATP
- organic anion transporting peptide
- ODE
- ordinary differential equation
- P-gp
- P-glycoprotein
- PBPK
- physiologically based pharmacokinetic
- PK
- pharmacokinetic
- Copyright © 2019 by The American Society for Pharmacology and Experimental Therapeutics


