


Abstract
Nemiralisib (GSK2269557), a potent inhaled inhibitor of phosphoinositide 3-kinase δ (PI3Kδ), is being developed for the treatment of respiratory disorders including chronic obstructive pulmonary disease. Determining the pharmacokinetic (PK) and pharmacodynamic (PD) responses of inhaled drugs early during drug development is key to informing the appropriate dose and preferred dose regimen in patients. We set out to measure PD changes in induced sputum in combination with drug concentrations in plasma and bronchoalveolar lavage (BAL) taken from healthy smokers (n = 56) treated for up to 14 days with increasing doses of inhaled nemiralisib (0.1–6.4 mg). Induced sputum analysis demonstrated a dose-dependent reduction in phosphatidylinositol-(4,5)-trisphosphate (PIP3, the product of PI3K activation), with a maximum placebo-corrected reduction of 23% (90% confidence interval [CI], 11%–34%) and 36% (90% CI, 11%–64%) after a single dose or after 14 days of treatment with nemiralisib, respectively (2 mg, once daily). Plasma analysis suggested a linear PK relationship with an observed accumulation of ∼3- to 4.5-fold (peak vs. trough) in plasma exposure after 14 days of nemiralisib treatment. The BAL analysis at trough confirmed higher levels of the drug in the lungs versus plasma (32-fold in the BAL fluid component, and 214-fold in the BAL cellular fraction). A comparison of the drug levels in plasma and the reductions in sputum PIP3 showed a direct relationship between exposure and PIP3 reduction. These results demonstrated target engagement upon treatment with inhaled nemiralisib and provide confidence for a once-daily dosing regimen.
Introduction
Inhaled drug therapeutics have the advantage of being delivered directly to the target organ, providing the opportunity for quick onset of action and a low systemic exposure, limiting potential unwanted effects in other organs (Lipworth, 1996; Lötvall, 1997). However, compared with systemically delivered therapies, the development of inhaled medicines has two key challenges. First the pharmacokinetic (PK) profile of local concentrations must be understood. Second, any pharmacodynamic (PD) changes in the lung after inhaled dosing must be discerned. Both are challenging to assess as sampling of the local compartment is not feasible in all patients or stages of disease. Addressing these challenges however, enables the determination of a PK/PD relationship and informs future development of novel therapeutics. A recent review has highlighted the importance of these factors in the interpretation of clinical study observations to ultimately reduce the number of failed drug trials (Morgan et al., 2012).
Asthma and chronic obstructive pulmonary disease (COPD) are characterized by chronic inflammation in the airways and are currently treated with several inhaled treatments (Barnes, 2013; Durham et al., 2016). Phosphoinositide 3-kinase δ (PI3Kδ) is a lipid kinase expressed predominantly in leukocytes, where it regulates the activation, proliferation, and function of multiple cell types, thereby modulating immune responses (Down et al., 2015; Stark et al., 2015). Inhibitors of PI3Kδ have been proposed as therapeutics for asthma and COPD due to their potential to inhibit the recruitment of inflammatory cells and reduce the release of proinflammatory mediators such as cytokines, chemokines, reactive oxygen species, and proteolytic enzymes (Park et al., 2008; Stark et al., 2015; Cahn et al., 2017).
In addition, targeting the PI3Kδ pathway improves innate immune responses to infections by promoting host defense (Down et al., 2015; Stark et al., 2015) and may restore steroid effectiveness under conditions of oxidative stress (Marwick et al., 2010; Sriskantharajah et al., 2013). Furthermore, individuals with activating mutations in PI3Kδ suffer from profound immune defects, accompanied by bacterial colonization, severe recurrent respiratory infections, and progressive lung damage, suggesting the PI3Kδ pathway is involved in pathogen-driven responses (Angulo et al., 2013). Finally, recent data have suggested that targeting the PI3Kδ pathway could reduce the incidence of pathogen-induced exacerbations by improving immunity and enhancing viral clearance (Stark et al., 2015).
Nemiralisib (GSK2269557) is a potent inhaled PI3Kδ inhibitor that is >1000-fold more selective at PI3Kδ than 250 other kinases, including the three other PI3K isoforms (Down et al., 2015). We postulate that an inhaled PI3Kδ inhibitor will provide localized anti-inflammatory action while potentially avoiding any unwanted effects in other organs. Given our approach, an understanding of PK/PD in the lung early in the clinical phase was deemed critical for successful drug development.
Here we present data from two independent clinical studies with nemiralisib in healthy volunteers who were cigarette smokers, in whom drug concentrations were measured in plasma and bronchoalveolar lavage (BAL) samples and correlated directly with levels of phosphatidylinositol-(3,4,5)-trisphosphate (PIP3), the product of all isoforms of PI3K activity, from matching induced sputum samples. The results of our work demonstrate the ability of nemiralisib to engage the target in the lung, and the data provide confidence for a once-daily dosing regimen.
Materials and Methods
Subject Population
Data from independent clinical trials are presented. The first (Study A, protocol PII115117, NCT01462617) was conducted at Quintiles, Guy’s Hospital London, United Kingdom, from July 2011 to March 2012. The second (Study B, protocol PII116617, NCT01762878) was conducted at Hammersmith Medicines Research, London, United Kingdom, from January 2013 to October 2013. Across the two studies, male and female (without childbearing potential) subjects between the ages of 18 and 55 were eligible to be recruited if they were deemed to be healthy by an experienced physician, had a body mass index within the range of 18–31 kg/m2, and had blood chemistry, electrocardiogram, and spirometry results within the normal range (note that only males were included in Study A).
For the pharmacodynamic assessment, subjects were recruited who were current smokers had a pack history of ≥5 pack year; Study B specified that the subjects were able to produce an adequate sputum sample of >100 mg at screening. Subjects were excluded if they had liver or heart disease or a history of asthma. Written informed consent was obtained before study participation. Both studies were conducted in accordance with the Declaration of Helsinki and relevant ethics committee/institutional review boards and regulatory authorities reviewed and approved the study protocols. Anonymized individual participant data and study documents can be requested for further research from www.clinicalstudydatarequest.com.
Study Design
Both studies were single-center, double-blind, placebo-controlled, randomized studies in healthy volunteers, including cigarette smokers, designed to determine the safety, tolerability, and PK and PD profile of single and repeat doses of nemiralisib.
Study A was performed using a nebulized formulation, and Study B was conducted using a dry powder formulation provided in a Diskus inhaler. In each study, there was a matching placebo. Abstracts of data from both studies have previously been presented (Wilson et al., 2013, 2014; Worsley et al., 2013).
Study A determined the PK/PD relationship of a single dose of nemiralisib in a two cohort, crossover design with active doses administered using a nebulized dosimeter to smokers. In the first cohort, 15 subjects received nemiralisib as a 0.4- or 6.4-mg single dose or placebo in a three-way crossover with a 7-day washout between treatments. Induced sputum samples were collected 3 hours after treatment inhalation.
In the second cohort, 12 subjects received nemiralisib as a 6.4-mg single dose or placebo in a two-way crossover with 14 days washout between treatments. Bronchoscopy for the collection of BAL samples was conducted 3 hours after the inhalation of the treatment.
In both cohorts, blood samples for PK analysis were collected after inhalation of treatment, and at 3 hours (presputum and postsputum induction or BAL), at 6, 12, and 24 hours after inhalation.
Study B explored the PK/PD relationship of nemiralisib in a single-dose escalation phase in a total of 16 subjects, all of whom were regular cigarette smokers, in a four-way crossover with each subject receiving placebo, 0.1, 0.5, and 2 mg of a dry powder formulation of nemiralisib administered using the Diskus device, with a 14-day washout between treatments. Induced sputum samples were collected 3 and 24 hours after treatment inhalation, and blood samples for the PK analysis were collected before the dose and 5, 30, and 45 minutes, and 1, 2, 3, 4, 6, 8, 12, and 24 hours after the dose.
A 14-day repeat dose arm was conducted in a further cohort where the subjects received 2 mg of nemiralisib (n = 10) or placebo (n = 3) in a parallel group design, also delivered as a dry powder formulation using the Diskus device. Induced sputum samples were collected before the dose, and at 3 hours after the dose on days 1 and 6 of treatment, then at 3 and 24 hours after the dose on day 12 of treatment. Blood samples for the PK analysis were collected before the dose and 5 minutes after the dose on days 1–13 inclusive, and before the dose and 5, 30, and 45 minutes, and 1, 2, 3, 4, 6, 8, and 12 hours after the dose on day 14. Bronchoscopy for the collection of BAL samples was performed at 24 hours (trough) after the final (day-14) dose.
Study Procedures
Sample Collection.
Pharmacokinetics blood sample.
For the PK analysis of nemiralisib, 2 ml of blood samples were collected in K3 ethylenediaminetetraacetic acid tubes, inverted 8–10 times, and placed on wet ice in an upright position. Blood samples were centrifuged for 10 minutes at approximately 1500g at 2–8°C to generate plasma. The resulting plasma samples were aliquoted into clean tubes and frozen at approximately −20°C within 1 hour of collection and were stored at −20°C until shipment to the bioanalysis site.
Bronchoalveolar lavage sample.
Lung lavage was collected via the instillation of 3 × 50 ml aliquots of saline administered to the right middle lobe. Aliquots were aspirated (directly by syringe connected to a bronchoscope) after each instillation; the separate return volume was measured for each aspirate and kept separately on ice for analysis. Each separate wash was centrifuged at 4000g for 5 minutes, and the supernatant containing epithelial lining fluid (ELF) was removed; the cell pellet was kept separately. The cell pellet for the concentration analysis was then resuspended in deionized water (causing cell lysis) to an equivalent volume of 20% of the individual lavage return volume. The reconstituted pellet and supernatant (ELF) samples were stored at −80°C until shipment to the bioanalysis site.
Induced sputum sample.
Induction was performed after each of up to three 5-minute inhalations of saline (0.9%, 3%, 4%), following standard local procedures. The sputum samples were frozen at each site for subsequent phospholipid analysis.
Sample Analyses.
Drug concentration measurements in plasma and BAL cells and fluid.
Derivation of concentrations in the lung ELF and cell pellet were conducted using the raw concentration data with the equations detailed in Supplemental Table 1. Human plasma, lung ELF supernatant, and BAL cell pellet samples were analyzed for nemiralisib using a validated analytic method based on protein precipitation, followed by high-pressure liquid chromatography with tandem mass spectrometry analysis. The lower limit of quantification (LLQ) was 20 pg/ml using a 25-µl aliquot of human plasma, lung ELF supernatant, and BAL cell pellet with a higher limit of quantification (HLQ) of 10,000 pg/ml.
Human plasma and lung ELF supernatant samples were analyzed for urea by a validated analytic method based on the Roch-Ramel enzymatic reaction, using a urease and glutamate dehydrogenase methodology on the Siemens Advia 1800 chemistry analyzer. In plasma, the LLQ was 0.2 mM with a HLQ of 239.5 mM, and in lung ELF supernatant the LLQ was 0.01 mM with a HLQ of 2.8 mM. Due to the invasive nature of the BAL procedure, it was performed at a single time point at a single dose in our healthy volunteers.
Pharmacokinetic analysis of concentration data.
Individual plasma nemiralisib concentration–time data using actual times was analyzed using WinNonlin Professional Edition v5.3 or higher (Certara, Inc., Princeton, NJ) to derive PK parameters, including the maximum observed plasma concentration (Cmax), time to Cmax (tmax), trough concentration (Cmin), and area under the plasma concentration–time curve (AUC(0–t)). The assessment of dose proportionality was performed for the plasma PK data using a power model (Supplemental Tables 2 and 3). An estimate of the mean slope of loge (dose) was reported for each relevant parameter, along with corresponding 90% confidence intervals (CI). Further exploratory analysis was performed using the ANOVA method after normalizing the parameters by a chosen nominal dose of 100 μg. The adjusted geometric mean and 90% CI were presented for each dose along with the estimated treatment ratios and corresponding 90% CI.
Assessment of the accumulation for the plasma PK data was performed using data from the single and repeat dose phases in Study B. The accumulation ratios were calculated for both peak (5 minutes after the dose) and trough (24 hours after the dose) values, using the day-14 and day-1 values. Peak-to-trough ratios were also calculated for days 1 and 14.
No formal assessment of the steady state was performed. Visual analysis of the concentration–time profiles taken daily during the studies was used to assess the achievement of a steady-state concentration in the plasma of the dosed subjects.
BAL samples (cells and supernatant) were analyzed for nemiralisib concentrations for derivation of lung ELF and cell pellet concentrations (Study B only). Urea levels were measured in the BAL samples together with the corresponding time-matched plasma sample for calculation of the ELF dilution factor (using urea as a dilution marker). The dilution factor was used to multiply the BAL nemiralisib concentration to derive the volume of ELF within the sample, and subsequently the concentrations within ELF. The derived ELF concentrations of nemiralisib for each BAL wash were calculated separately.
A pooled analysis was calculated per subject by calculating the total mass of nemiralisib in all three washes and dividing by the total volume of ELF within all three washes. The cell pellet concentration (Study B only) was derived using the resulting ELF concentration and the ratio of the raw (not urea corrected) sample results between supernatant and cell pellet (reconstituted and lysed).
PIP2 and PIP3 detection and analysis in sputum samples.
PIP3 peak area proportion (PIP3 peak area/[PIP3 peak area + PIP2 peak area]) was calculated from the mass spectrometer peak areas for PIP3 and phosphatidylinositol-(4,5)-bisphosphate (PIP2), derived using established methodology (Clark et al., 2011). The PIP3 proportion, using PIP2, was calculated to correct for changes in cell numbers between different sputum samples, assuming PIP2 was correlated with cell number (Clark et al., 2011).
The time of freeze of each sputum sample was recorded, and the time elapsed between collection and freeze was calculated. For clinical study samples, Loge (PIP3 peak area proportion) was analyzed using mixed effects, repeated measures analyses, including time to freeze as a covariate. Treatment ratios (and 90% CI) of the adjusted geometric mean for nemiralisib versus placebo are presented. Statistical models were used to determine Bayesian posterior probabilities (assuming a noninformative prior). Student’s t-cumulative distribution function was used to obtain the probabilistic statements.
Results
Demographics and Safety Data for Study A and Study B.
For the PK and PD assessment, 56 subjects were randomized in the two studies (Table 1). The ages, heights, and weights of the subjects in both studies were broadly similar. All subjects were current smokers, with the mean number of cigarettes smoked per day ranging from 14 to 19 across the two studies, and mean pack years ranging from 10 to 18 (Table 1). The reported adverse effects were minor, with the most common being headache, none of which were attributed to being related to the test agent (Supplemental Table 4).
Demographics and baseline lung function of the subjects who smoked cigarettes in Study A (nebulized formulation) and Study B (dry powder formulation)
Values are mean ± S.D. unless otherwise indicated.
Single-Dose PK (Plasma).
After single inhaled administration of doses of 0.1 to 6.4 mg of nemiralisib, the peak plasma nemiralisib concentrations (Cmax) were achieved rapidly, typically in the initial sample taken approximately 5 minutes after the dose (Fig. 1). The concentrations declined rapidly and in a biexponential manner, with a more protracted terminal elimination phase. Minor fluctuations in the concentration–time profiles after the dose were observed and are reflected in the median data, particularly at the low dose. Exposures increased in an approximately proportional manner in both Study A and Study B, with the geometric mean values presented in Table 2.

Nemiralisib 24-hour plasma PK profile. Median plasma concentration of nemiralisib over 24 hours after single dosing in Study A (0.4 and 6.4 mg only) and single dosing (SD) and 14-day repeat dosing (RD) in Study B (0.1, 0.5, and 2.0 mg SD and 2 mg RD).
Summary of plasma PK from Study A and Study B after single and repeat dosing with nemiralisib
Repeat-Dose PK (Plasma).
After once daily administration of 2 mg nemiralisib for 14 days in Study B, there was an accumulation of approximately 4.5-fold on trough concentrations and 3-fold on peak values (Fig. 2). The peak-to-trough ratios were approximately 3.2 on day 1 and 2.2 on day 14. Based on the peak and trough concentrations, the steady state was reached by day 7, with levels comparable, although variable, between days 7 and 14. The exposure data can be seen in Table 2.

Daily Cmax and Cmin plasma values after 14-day repeat dosing of nemiralisib in Study B. Geometric mean (with minimum and maximum values) of postdose plasma concentrations of nemiralisib at 5 minutes (Cmax), and 24 hours (Cmin) after 14-day daily dosing.
BAL PK (BAL ELF and Cell Fraction).
In Study A, after single nebulized dosing at 6.4 mg, the concentrations of nemiralisib in ELF derived from BAL data obtained 3 hours after dosing was approximately 598 ng/ml of ELF. Using the time-matched plasma concentration of nemiralisib (approximately 1.1 ng/ml), the lung ELF-to-plasma ratio was approximately 540:1.
In Study B, exposure of the lung to nemiralisib after repeated 2-mg daily dosing was derived from BAL samples obtained 24 hours after day 14. Lung ELF and cell pellet concentrations at 24 hours after the day-14 dose were 55 ng/ml (ELF-to-plasma ratio 32:1) and 366 ng/ml (cell-to-plasma ratio 213:1), respectively (Table 3).
BAL pharmacokinetics (plasma, ELF, and cell pellet pharmacokinetics) at day-14 trough
PIP3 Levels in Induced Sputum.
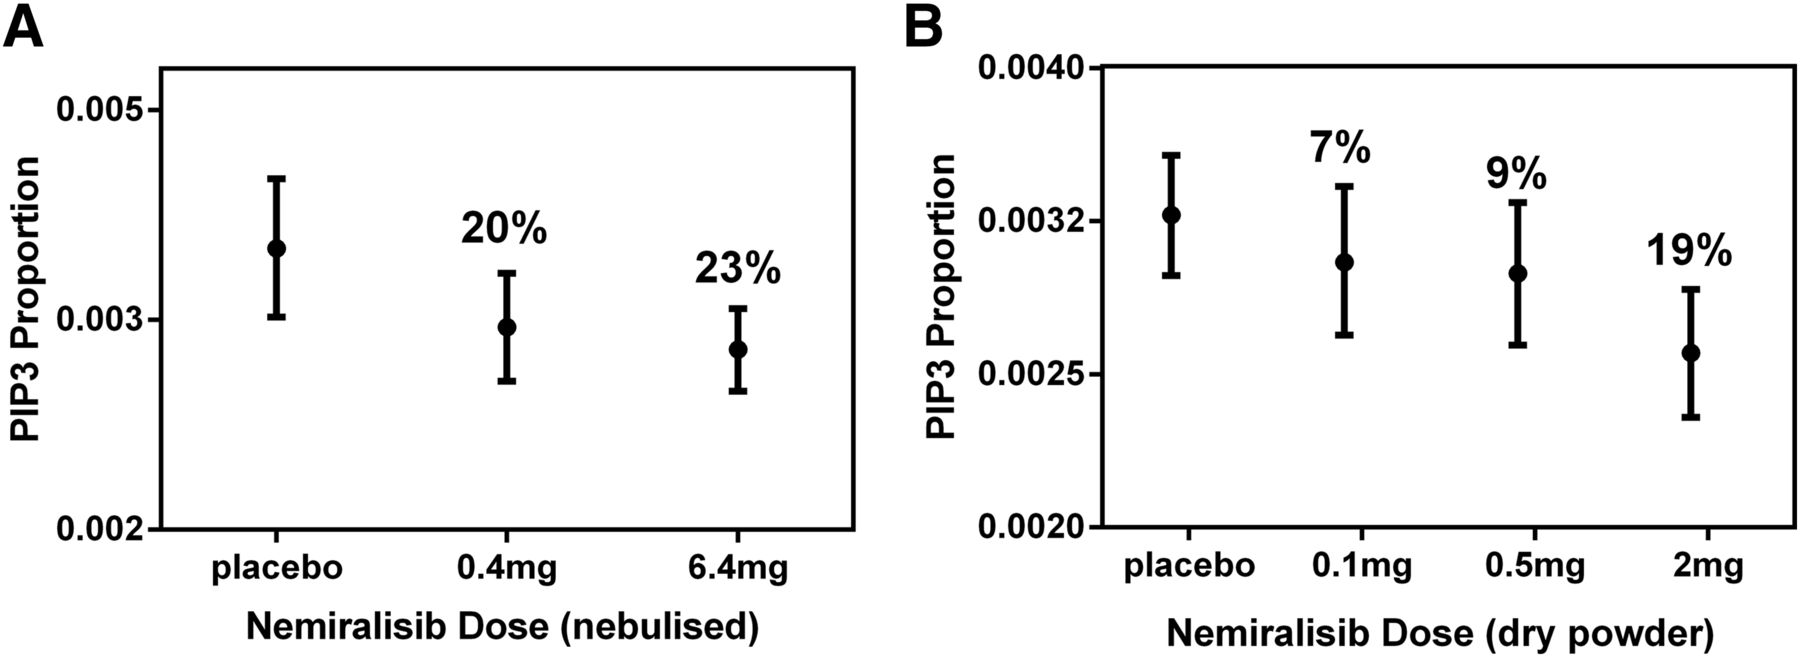
In Study A, the PIP3 proportion at 3 hours after dosing was reduced from 0.00382 (0.00341, 0.00428) after receiving placebo, to 0.00306 (0.00273, 0.00343) after a single 0.4-mg dose, and to 0.00294 (0.00262, 0.00330) after a single 6.4-mg dose of nemiralisib (Fig. 3A). The ratios of the adjusted geometric mean were 0.801 (0.691, 0.928) for 0.4 mg versus placebo, and 0.770 (0.663, 0.895) for 6.4 mg versus placebo, representing reductions of 20% and 23%, respectively. Therefore, from these data, the probability that there truly is a decrease from placebo is 99.1% for 0.4 mg and 99.6% for 6.4 mg.

PIP3 levels in induced sputum 3 hours after the dose. Nemiralisib reduced the PIP3 levels in induced sputum samples in healthy smokers who were given single dose administration of a nebulized (A) or dry power formulation (B).
In Study B, nemiralisib reduced PIP3 levels measured 3 hours after inhalation in a dose-dependent manner from 0.00320 (0.00292, 0.00350) after receiving placebo to 0.00260 (0.00236, 0.00286) after a single 2-mg dose (Fig. 3B). The ratio of adjusted geometric means for 2 mg versus placebo was 0.813 (0.723, 0.915), representing a 19% decrease in the levels of PIP3 compared with placebo, with the probability that there truly is a decrease from placebo of 99.8%. The reduced levels of PIP3 were maintained at 24 hours after receiving a single 2-mg dose, but they broadly returned to placebo levels in the subjects dosed with 0.1 and 0.5 mg.
The degree of reduction in PIP3 levels was enhanced after 12 days of repeat dosing of 2 mg of nemiralisib to 0.00205 (0.00175, 0.00241), representing a 36% decrease at 3 hours compared with placebo, with the probability that there truly is a decrease of 98.1% (Table 4). The levels of PIP3 were still reduced at 24 hours after the final 14-day dose at 0.00208 (0.00186, 0.00234). Therefore, both studies demonstrated a reduction in the levels of PIP3 in sputum samples after single and repeat dosing with nemiralisib compared with placebo (Table 4).
PIP3 levels in induced sputum
Relationship between Nemiralisib Exposure and PD Effect.
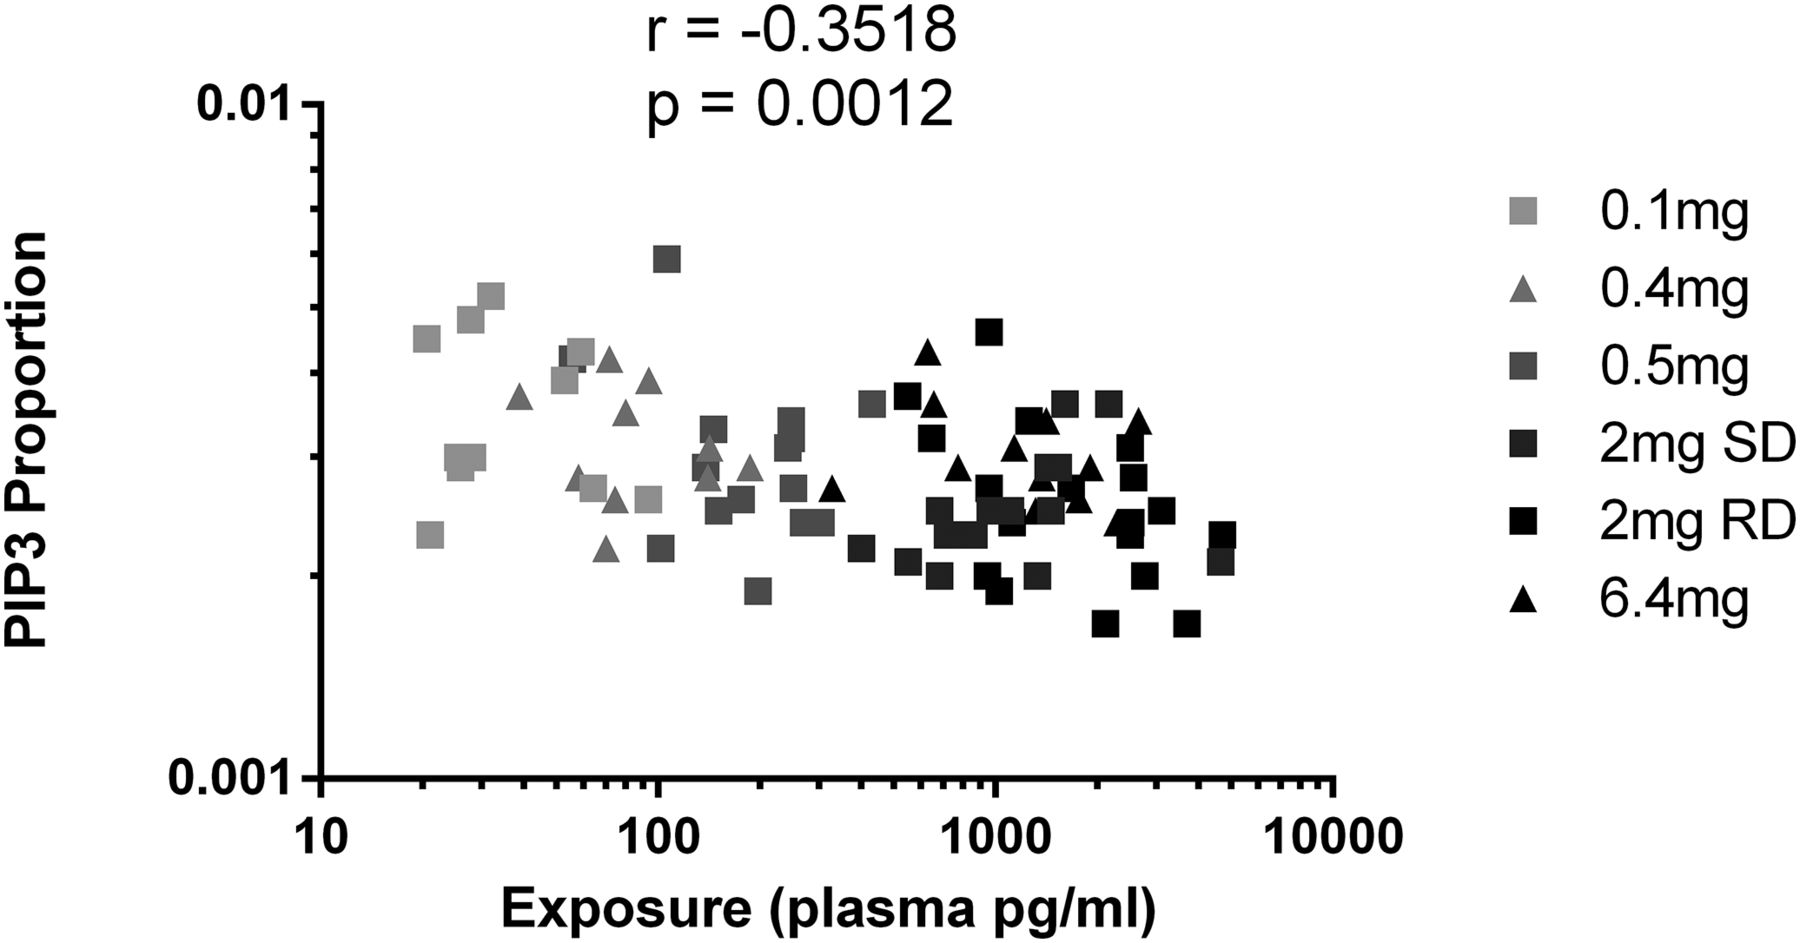
Figure 4 shows a post hoc analysis of the combined PIP3 proportion values from both studies plotted against the respective time matched plasma concentration from each individual subject treated with nemiralisib. When evaluating this data, it can be observed that as the plasma concentration of nemiralisib increased, the PIP3 proportion decreased (range: 0.0016–0.0063), with a correlation of −0.3518 and an unadjusted P value of 0.0012. The range of PIP3 proportion after placebo dosing was 0.0020–0.0064.

Relationship between exposure and pharmacodynamic effect. Post hoc analysis of the combined data from both studies revealed a direct relationship between the increase in the plasma exposure of nemiralisib and the decrease in the proportion of PIP3 levels. All data from Study A (triangles), and Study B (squares) are included. PIP3, phosphatidylinositol-trisphosphate; RD, repeat dosing; SD, single dosing.
Discussion
The value of inhaled therapeutics includes quick onset of action, target organ deposition, and potential avoidance of systemic consequences. The research described here aimed to address the need to understand lung exposure and the consequences of target engagement in an early stage of clinical development. Here, we present the PK of nemiralisib (GSK2269557), a novel inhaled inhibitor of PI3Kδ, in blood and lung samples, and we compare the data with alterations in a PD marker in induced sputum samples taken at the same time. We have successfully demonstrated PI3Kδ target engagement in these samples, as indicated by consistent reductions in sputum PIP3 levels after single and repeat dosing of nemiralisib. This was observed in two clinical studies with different formulations, and the combined data show that as the levels of inhaled drug exposure increase (measured in plasma), the proportion of PIP3 in sputum decreases in a linear fashion. The data are consistent with a once-daily dosing interval.
Smoking is described to directly activate the PI3Kδ pathway (To et al., 2010; Daijo et al., 2016), and although the PIP3 reductions (∼36%) may seem modest in our studies, this is likely because only the PI3Kδ-dependent PIP3 component of total PIP3 will have been inhibited due to the high selectivity of nemiralisib over other PI3K isoforms.
To try and understand the observed degree of reduction in PIP3 in sputum, we performed an additional in vitro experiment. We measured the reduction of PIP3 levels in unstimulated isolated human neutrophils in the presence of nemiralisib and a pan-PI3K inhibitor (Supplemental Fig. 1). In this experiment, the reduction with nemiralisib was similar to that achieved with the pan-PI3K, suggesting the change was entirely PI3Kδ driven (Supplemental Fig. 1). Interestingly, the degree of reduction in PIP3 levels in isolated neutrophils is similar to that observed in sputum after dosing of nemiralisib, suggesting this change is the maximal achievable inhibition through inhibition of PI3Kδ alone. We have recently demonstrated that inhalation of nemiralisib also results in reduction of inflammatory cytokines in sputum from stable COPD patients dosed for 14 days (Cahn et al., 2017).
The reduction in PIP3 levels was greater in subjects dosed for 14 days compared with a single dose, demonstrating that the effects of nemiralisib are increased upon repeat dosing, potentially due to greater exposure. Notably, reductions in PIP3 levels were still observed 24 hours after dosing (see Table 4). The absolute PIP3 values together with the degree of change in PIP3 proportion observed were broadly consistent across the two clinical studies, indicating that this is a robust biomarker of PI3Kδ activity.
The nemiralisib plasma concentration–time profiles were slightly variable, consistent with a drug taken by inhalation, and were characterized by two peaks: a first one occurring at 5 minutes after dosing and a second smaller one at approximately 2 hours, thus resulting in a median tmax ranging between 5 minutes and 2 hours. The first peak represented rapid absorption from the lung, and the second peak represented an oral absorption component, as recently characterized (Wilson et al., 2018). The plasma concentrations subsequently decreased less rapidly, with the profile showing a more protracted elimination route.
Exposure to nemiralisib increased with increasing dose in an approximately proportionate manner, with some deviations in derived Cmax and AUC parameters between individuals within a dose level, and between doses and cohorts. Definitive kinetics, in particular the calculation of the terminal elimination phase, were difficult to show in both studies due to the slow rate of observed elimination of the compound from plasma. This meant that the sampling regimen (and in particular the last time point) were influential in the ability to accurately determine the terminal half-life, and this also impacted the ability to calculate AUC to infinity. In a recent study in healthy Japanese volunteers (Ino et al., 2019), the terminal half-life appeared to be approximately 42 hours and is being further characterized in an ongoing human absorption, distribution, metabolism, and excretion study (NCT03315559).
In our studies, plasma accumulation was observed upon repeat administration of nemiralisib, consistent with a long terminal elimination rate, with a steady state being achieved by day 7. This is a consistent time to steady state for a molecule with an elimination rate of at least 36 hours, which would be expected to achieve steady state by day 6 after once-daily administration.
The data derived from BAL demonstrated a high concentration of nemiralisib in the lungs as compared with the plasma exposure, as would be expected after topical delivery. At 3 hours after dosing with a single nebulized solution, the ELF levels were approximately 540 times higher than those in plasma. Upon repeat administration of a dry powder formulation to steady state, however, the ELF levels at 24 hours after the last dose were 32 times that of plasma. Given that the cellular concentration was 213 times higher when compared with plasma, collectively these data demonstrate that the compound was distributed into the cellular compartment. The measured total cell fraction may be an overestimation of the available drug, as it reflects a combination of intracellular, cell-bound, and undissolved drug captured during the BAL process. Therefore, the intracellular concentration capable of inhibiting the kinase could be lower.
Measuring the cellular lung trough concentration is extremely valuable for translating in vitro to in vivo data, and it suggests a 2-mg dose would be sufficient to engage the target for a period of 24 hours, indicating a once-daily therapeutic dosing interval. However, the cellular levels may not be truly reflective of drug within the cell and could represent drug that is intracellular and bound to the outside, or undissolved drug material. Although we cannot be certain if the drug is intracellular or cell bound, the BAL concentration measured in our study (see Table 3) equates to approximately 10 nM. This concentration of nemiralisib has been shown to generate robust effects across multiple in vitro assays (Down et al., 2015). This demonstrates the importance of combining target PK with PD over a range of doses and exposures to characterize the shape of the PK/PD response.
Although the formulation was different between the two studies explored here (solution vs. dry powder), the high solubility of nemiralisib means the dry powder is likely to rapidly dissolve upon deposition in the lung and thus would be expected to demonstrate similar PK properties to the nebulized solution. It is also assumed that distribution of the drug in the lung would be broadly similar for both formulations, although this is difficult to experimentally establish. Recently we have demonstrated that the PK profile in stable COPD patients closely matches that presented here in healthy volunteers, suggesting a similar exposure (Cahn et al., 2017).
The combination of plasma PK profile with the PD reductions in sputum PIP3 demonstrate a direct relationship between increasing plasma exposure and reducing PIP3 proportion in sputum with no evidence of hysteresis. This suggests a good correlation between plasma exposures at the times measured (3 and 24 hours after dosing) and exposure in the effect compartment driving the response. Plasma PK is absorption/distribution limiting after delivery of nemiralisib to the lungs. It is assumed (although not proven) that the sputum response reflects the pharmacology within the ELF and lung cellular compartment.
In conclusion, we have demonstrated that nemiralisib has acceptable tolerability, with a well-defined PK profile, showing significantly higher levels in lung compared with plasma. Nemiralisib appears to engage PI3Kδ in the target organ, as demonstrated by the reduction of PIP3 in sputum, with a linear relationship observed between plasma exposure and reduction in PIP3 levels. The generation of a well-defined PK/PD relationship adds to our confidence in progressing with the development of a molecule and facilitates the interpretation of subsequent clinical observations.
Acknowledgments
The authors gratefully acknowledge editorial support provided by Kate Hollingworth of Continuous Improvement Ltd, which was funded by GlaxoSmithKline. The authors would like to thank Niki Day for safety review during Study A.
Authorship Contributions
Participated in research design: Begg, Wilson, Hamblin, Montembault, Green, Deans, Worsley, Cui, Dear, Cahn, Hessel, A.A.
Conducted experiments: Boyce, Fantom, Amour, Ahmad, Kielkowska, Clark.
Performed data analysis: Wilson, Deans, Begg, Amour, Fantom.
Wrote or contributed to the writing of the manuscript: Begg, Wilson, Hamblin, Montembault, Green, Deans, Amour, Worsley, Fantom, Cui, Dear, Ahmed, Kielkowska, Clark, Boyce, Cahn, Hessel.
Footnotes
- Received November 15, 2018.
- Accepted March 15, 2019.
The studies reported in this paper were both funded by GlaxoSmithKline.
↵
 This article has supplemental material available at jpet.aspetjournals.org.

Abbreviations
- BAL
- bronchoalveolar lavage
- CI
- confidence interval
- COPD
- chronic obstructive pulmonary disease
- ELF
- epithelial lining fluid
- GSK2269557
- nemiralisib
- HLQ
- higher limit of quantification
- LLQ
- lower limit of quantification
- PD
- pharmacodynamic
- PIP2
- phosphatidylinositol-(4,5)-bisphosphate
- PIP3
- phosphatidylinositol-(3,4,5)-trisphosphate
- PI3Kδ
- phosphoinositide 3-kinase δ
- PK
- pharmacokinetics
- Copyright © 2019 The Author(s).
This is an open access article distributed under the CC BY Attribution 4.0 International license.


