


Abstract
Hepatofibrosis can progress to cirrhosis and hepatocellular carcinoma (HCC). Prevention, stabilization, and reversal of disease progression are vital for patients with hepatofibrosis, and identifying the risk factors for hepatofibrosis is urgently needed. In this study, we examined the activities of alcohol dehydrogenase (ADH) and acetaldehyde dehydrogenase (ALDH) in the fibrotic livers of HCC patients (n = 88) and comparied these results with activities in patients with normal livers (n = 74). A fibrosis-carcinoma rat model was used to study the activity of ADH in fibrosis and HCC and the relationship between innate ADH activity and the extent of hepatofibrosis or HCC. Substantial interindividual variations were found in the activities of ADH and ALDH in normal livers. The activity levels of total ADH, ADHI, and ADHII in fibrotic livers were significantly higher than those in normal livers (P < 0.001), whereas the activity of ALDH was slightly greater. The positive rates of ADHI and ADHII were 84.1% and 77.3%, respectively; the areas under the receiver operator characteristics (ROC) curve were 0.943 and 0.912, respectively. For the rat model compared with controls, ADH activity in liver was significantly increased at the fibrotic and HCC stages, and no significant difference was noted between ADH activity in the liver at these two stages. The innate activity of ADH in serum was well correlated with the extent of hepatofibrosis as indicated by Masson area%, Ki67+%, proliferating cell nuclear antigen +%, and GST-p average density at fibrotic stage but not at HCC stage. A higher level of activity of ADH is a risk factor for hepatofibrogenesis and might be a prevention target for hepatofibrosis.
Introduction
Hepatofibrosis, a common pathophysiology of chronic liver disease with various causes, leads to abnormal extracellular matrix deposition and ultimately to a pathologic process of liver structural and functional abnormalities (Wheeler et al., 2001; Bataller et al., 2004). Hepatofibrosis is mostly asymptomatic in its early stages, but as it progresses, it disrupts the liver architecture and function, ultimately leading to cirrhosis and even hepatocellular carcinoma (HCC) (Bataller et al., 2004). Early fibrosis is potentially reversible, but it has been widely accepted that liver cirrhosis is irreversible and has no effective therapeutic drug treatment. As the second leading cause of cancer-related death (Beck et al., 2017), HCC is a major global health problem. Prevention, stabilization, or reversal of disease progression is very important for patients with hepatofibrosis, and identification of the risk factors for hepatofibrosis is urgently needed.
Alcohol dehydrogenase (ADH) and acetaldehyde dehydrogenases (ALDH) are responsible for the metabolism of a variety of endogenous and exogenous substrates, including ethanol, retinol, aliphatic alcohols, hydroxysteroids, and lipid aldehyde (Song et al., 2015). Human ADH comprises a family of enzymes that have been grouped into several classes (Maly et al., 1999). In humans, the first two classes are located mainly in the hepatic parenchymal cells. ADH class I (ADHI) is the classic liver ADH, representing up to 95% of the total activity in this organ, and ADH class II (ADHII) is detected only in the liver. Of all these isoenzymes, ADHI is the main one involved in ethanol metabolism. Isoenzymes of ADHI are dimers composed of α, β, and γ subunits, encoded by ADH1A, ADH1B, and ADH1C loci (Maly et al., 1999). Some gene polymorphisms for ADH1B and ADH1C, such as ADH1B polymorphism, have been reported to have a marginal effect on alcohol pharmacokinetics (Marshall et al., 2014). The metabolism of ethanol by ADH produces acetaldehyde, which is metabolized mainly by ALDH to acetate (Lieber, 1997; Zakhari and Li, 2007; Jelski and Szmitkowski, 2008). ALDH can be divided into groups according to their Michaelis constant values for acetaldehyde. Liver mitochondrial ALDHII is mainly responsible for the metabolism of acetaldehyde (Jelski and Szmitkowski, 2008).
According to the International Agency for Research on Cancer, acetaldehyde associated with the consumption of alcoholic beverages belongs to group 1 of human carcinogens. Acetaldehyde can interact with DNA to produce DNA adducts (Yu et al., 2010). The acetaldehyde-DNA adducts can lead to cancer in many tissues, including the liver, esophagus, and gastrointestinal tract (Song et al., 2015). In addition, lack of ADHIII in hepatic stellate cells and natural killer cells has been associated with the inhibition of nonalcoholic hepatofibrosis (Yi et al., 2014). These results suggest that ADH is not only involved in alcohol-induced liver injury through the metabolism of ethanol but also may play a key role in nonalcoholic liver injury.
To date, a number of studies have focused on the relationship between ethanol-metabolizing enzymes (i.e., ADHs and ALDHs) and disease, such as renal cell carcinoma, pancreatic cancer, and brain cancer (Jelski et al., 2007, 2008c, 2014; Laniewska-Dunaj et al., 2013; Orywal et al., 2015, 2016). Interestingly, total ALDH activity is not significantly changed in tissue or serum with these cancers; however, Jelski et al. (2008a) examined the change of ADH and ALDH activity in 44 cases of HCC and found that total ADH, ALDH, and ADHI activities were significantly greater in HCC tissues than in healthy tissues. Jelski et al. (2008b) also reported that ADHI activity in serum was significantly increased in patients with metastatic liver cancer, but there was no change in ALDH activity. So far, changes in ADH activity in fibrotic livers have not yet been reported, nor have changes in ADH activity in serum and liver at different stages of HCC progression. Finally, as ADH and ALDH act sequentially on many substrates, knowledge of the ratio of ADH to ALDH (ADH/ALDH) is likely to be important.
To identify the risk factors for hepatofibrosis, our group obtained normal livers mainly from hepatic hemangioma patients and fibrotic livers from patients with HCC and measured the activities of total ADH, ADHI, ADHII, and ALDH. The fibrosis-carcinoma rat model induced by diethylnitrosamine (DEN) was used to study changes in the activity of ADH in different stages of HCC to determine whether high ADH activity was a risk factor for hepatofibrosis.
Materials and Methods
Experiments with Human Livers
Human Liver Samples.
Human normal liver samples were obtained from 74 patients with normal liver function, and fibrotic liver tissues 2 cm distant from the tumor tissues were obtained from 88 patients with HCC between 2012 and 2014 (Gao et al., 2016, 2017; Zhou et al., 2016) (Table 1). All the liver samples were obtained at First Affiliate Hospital of Zhengzhou University, Affiliated Provincial People’s Hospital of Zheng Zhou University, and Affiliated Cancer Hospital of Zhengzhou University. After excision, the liver samples were frozen in liquid nitrogen within 30 minutes. All patients signed informed consent forms, and this study was approved by the ethics committee of Zhengzhou University. Compared with the normal group, the HCC group comprised more men, smokers, and drinkers (P < 0.01).
Demographic and laboratory data of normal and hepatocellular carcinoma (HCC) patients
S1: Portal area fibrosis expanded and confined in the hepatic sinus and lobule (5); S2: fibrosis around portal area, fibrous septa form, lobule structure maintained (15); S3: fibrous septums and lobule structure disorder, without cirrhosis (23); S4: early stage cirrhosis (45).
Liver samples were assigned four stages from S1 to S4 (Zhou et al., 2016). Among the 88 fibrotic livers, 5 were S1, 15 were S2, 23 were S3, and 45 were S4.
Determination of ADH (Total ADH, ADHI, and ADHII) Activities and Total ALDH Activity.
Liver tissues were homogenized in potassium phosphate buffer (0.1 mol/liter, pH 7.4) and then centrifuged at 1200g for 20 minutes at 4°C. The supernatant was used to determine ADH and ALDH activities. The protein concentration was determined using a Bradford protein quantification kit and performed according to standard procedures provided by the manufacturer (BOSTER Biological Technology, Pleasanton, CA).
The activity of total ADH, ADHI, ADHII, and ALDH was measured according to the method of Skurský et al. (1979), Wierzchowski et al. (1989), and Jelski et al. (2008a). The activities of total ADH, ADHI, and ADHII were determined with p-nitrosodimethylaniline (NDMA), 4-methoxy-1-naphthaldehyde, and 6-methoxy-2-naphthaldehyde as substrates, and the activity of total ALDH was determined with 6-methoxy-2-naphthaldehyde as substrate. Briefly, the reaction mixture contained supernatant, substrate, NAD or NADH, and sodium phosphate buffer. A wavelength of 440 nm for total ADH and emission wavelengths of 370 and 360 nm with an excitation wavelength of 316 nm for ADHI and ADHII were used, respectively. An emission wavelength of 360 nm was used to determine the activity of ALDH; the excitation wavelength was 310 nm.
Experiments with Rats
Establishment of Fibrosis-Carcinoma in a Rat Model.
Fifty-one male Sprague-Dawley rats weighing 180 ± 20 g were maintained at 22°C with a standard 12-hour light/dark cycle with free access to rodent chow and tap water and were randomly divided into two groups: control (n = 10) and model (n = 41). After feeding, the model group was injected i.p. with 50 mg/kg DEN twice weekly for 4 weeks and then injected i.p. with 50 mg/kg DEN once weekly to 14 weeks. Ding et al. (2017) reported that the HCC rat model induced by DEN was characterized by an inflammation stage (weeks 2–6), a fibrosis stage (weeks 8–12), and an HCC stage (weeks 14–20). In this experiment, 20 rats in the model group were randomly assigned and sacrificed at 12 weeks, designated the fibrosis group. The remaining rats in the model group were sacrificed at 19 weeks, and termed the HCC group. The control rats were injected intraperitoneally with normal saline and sacrificed at 19 weeks. The diagnoses of fibrosis and HCC were made based on the results of H&E and Masson staining. The results were studied by a pathologist who was blinded to the study. Histopathologic examination showed centrilobular atypia and multiple larger dysplastic foci, and there was marked collagen deposition as demonstrated by Masson’s trichrome staining in the rats treated with DEN for 12 weeks. In addition, about half of the rats developed HCC by week 19 according to pathology results. Our study was carried out in strict accordance with the Guide for the Care and Use of Laboratory Animals and all the experimental procedures reported here were approved by the Zhengzhou University Animal Care and Use Committee.
Serum from all rats was collected at 0, 8, and 12 weeks, and the sera of control and rats in HCC group were collected at 16 and 19 weeks. The livers were collected after sacrifice.
Preparation of Rat Liver Homogenates.
Two hundred milligrams of liver tissue was homogenized in normal saline and then centrifuged at 2500 r/min for 10 minutes at 4°C. The supernatant was used to determine enzyme activities. The protein concentration was determined by BCA protein quantification kit (BOSTER Biologic Technology).
Determination of Alanine Aminotransferase and Aspartate Aminotransferase (AST) in Serum.
Alanine aminotransferase (ALT) and aspartate aminotransferase (AST) activity in serum was determined using a commercial assay kit from Jiancheng Bioengineering Institute (Nanjing, China) according to standard procedures. Results of serum AST and ALT activities are expressed as units per liter (U/liters).
Histopathology.
Liver specimens for histopathological analysis were obtained from the tissues, fixed with 10% formalin, and embedded in paraffin. Paraffin sections, 5 μm thick, were stained with H&E and Masson staining. Liver specimens were graded according to the Ishak scoring system (Ishak et al., 1995). The percentage of fibrotic area after Masson staining was measured.
Immunohistochemistry.
The altered hepatic foci (Kitahara et al., 1984; Sato et al., 1984) were measured by immunohistochemical analysis of glutathione-S-transferase placental form (GST-p) levels in the liver. Hepatocyte proliferation was quantified by immunohistochemical analysis of proliferating cell nuclear antigen (PCNA) and Ki-67. In addition, the activation of hepatic stellate cell was evaluated by immunohistochemical analysis of α-smooth muscle actin (SMA) and collagen 1.
Anti-Ki67 antibody (ab 15580; Abcam, Cambridge, UK), anti-PCNA antibody (ab 29; Abcam), and anti-GST pi antibody (ab 138491; Abcam) were used for immunohistochemistry. The proportion of positive cells (Ki67+%, PCNA+%) and average density (GST-p) were quantified with image-processing software (Image-Pro Plus 6.0, Media Cybernetics, Rockville, MD). The expression of α-SMA and collagen 1 was assessed by the H-score system (histochemistry score) (Yeo et al., 2015). Briefly, the formula for the H-score is as follows: H-SCORE = ∑(PI × I) = (percentage of cells of weak intensity × 1) + (percentage of cells of moderate intensity × 2) + the percentage of cells of strong intensity × 3).
Determination of the ADH Activity.
The ADH activity in serum and liver homogenates of rats was determined using a commercial assay kit from Jiancheng Bioengineering Institute (Jiangsu, China) according to standard procedures.
Statistical Analysis
Statistical analysis was performed with SPSS 17.0 software (Rockville, MD). The data set of the human liver was not normally distributed; thus, the data were expressed as median and range, and nonparametric methods were generally used for statistical analyses. In the data set from the rat model, statistical differences between different stages were determined using an independent t test or one-way analysis of variance since they were normally distributed. The Pearson correlation was used to determine the correlations between the activity of ADH and liver injury-related indexes. The level of the confidence was set at 0.05.
Results
ADH and ALDH Activities in Human Livers
Activity of ADH and ALDH in Normal Human Livers.
The activity of total ADH, ADHI, ADHII, and total ALDH was detected in 74 normal liver samples using probe drugs known to be specific for each enzyme. The data for these measurements are shown in Table 2, and the results demonstrate substantial individual variations. The two greatest individual variations were evidenced in the activity of ADH and ADH/ALDH, with 450.8 and 809.6-fold differences, followed by that of ADHI/ALDH, ADHII, ALDH, and ADHI, demonstrating changes from 14- to 41-fold. The values for ADH activity at the 5th and the 95th percentiles were 0.38 and 50.4 nmol ⋅ min−1 ⋅ mg−1 protein, respectively, exhibiting about a 132-fold variation. There were six outliers (60.91, 71.70, 72.12, 0.16, 0.27, and 0.34 nmol · min−1 ⋅ mg−1 protein) in total ADH activity.
Activity of alcohol dehydrogenase (ADH) and acetaldehyde dehydrogenase (ALDH) in normal (n = 74) and fibrotic livers (n = 88)
No statistically significant differences (P > 0.05) were seen in the ADH, ADHI, ADHII, and ALDH activities as a function of gender, age, smoking status, or drinking habit (data not shown).
Activity of ADHs and ALDH in Fibrotic Livers.
The median protein concentration in fibrotic livers was significantly lower than that in normal liver tissues (P < 0.05). Total ADH, ADHI, ADHII, and ALDH activities were detected in 88 fibrotic livers and are shown in Table 2. Like in normal livers, there were substantial individual variations; the two greatest individual variations were observed in the activity of ADH and ADH/ALDH, which varied by 36.5- and 69.9-fold. The results show that individual variation is less than that in normal livers. The values of ADH activity at the 5th and the 95th percentiles were 1.9 and 18.8 nmol ⋅ min−1 ⋅ mg−1 protein, respectively, exhibiting about a 9.9-fold variation. As with normal livers, no statistically significant differences (P > 0.05) were found in the ADH, ADHI, ADHII, and ALDH activities as a function of gender, age, smoking status, or drinking habit (data not shown).
Compared with normal livers, total levels of ADH, ADHI, and ADHII activity were significantly increased in fibrotic livers (P < 0.001), with 4.0-, 3.0-, and 2.6-fold changes. The ALDH activity in fibrotic livers was also greater than that of normal livers (P < 0.01), but the rate of increase was relatively small (i.e., 1.3-fold). The ratios of ADH/ALDH and ADH I/ALDH were also increased significantly in fibrotic livers relative to those of controls. These results suggested that fibrotic livers might have a greater capability for ethanol metabolism to acetaldehyde.
Correlation between the Activities of Total ADH, ADHI, ADHII, and ALDH.
Correlations between the activities for total ADH, ADHI, and ADHII were analyzed. Positive correlation was shown for each of them in both normal tissue (Fig. 1A) and fibrotic tissue (Fig. 1B). Strong correlations (r ≥ 0.6) were observed between ADHI and ADHII in normal livers, and the remaining correlations were moderate (0.3 ≤ r < 0.6). The activity of ALDH correlated only with ADHII, which participates actively in the degradation of circulating epinephrine and norepinephrine, in normal livers (P < 0.01). ALDH activity in fibrotic livers showed a weak correlation with ADHI (P < 0.05).
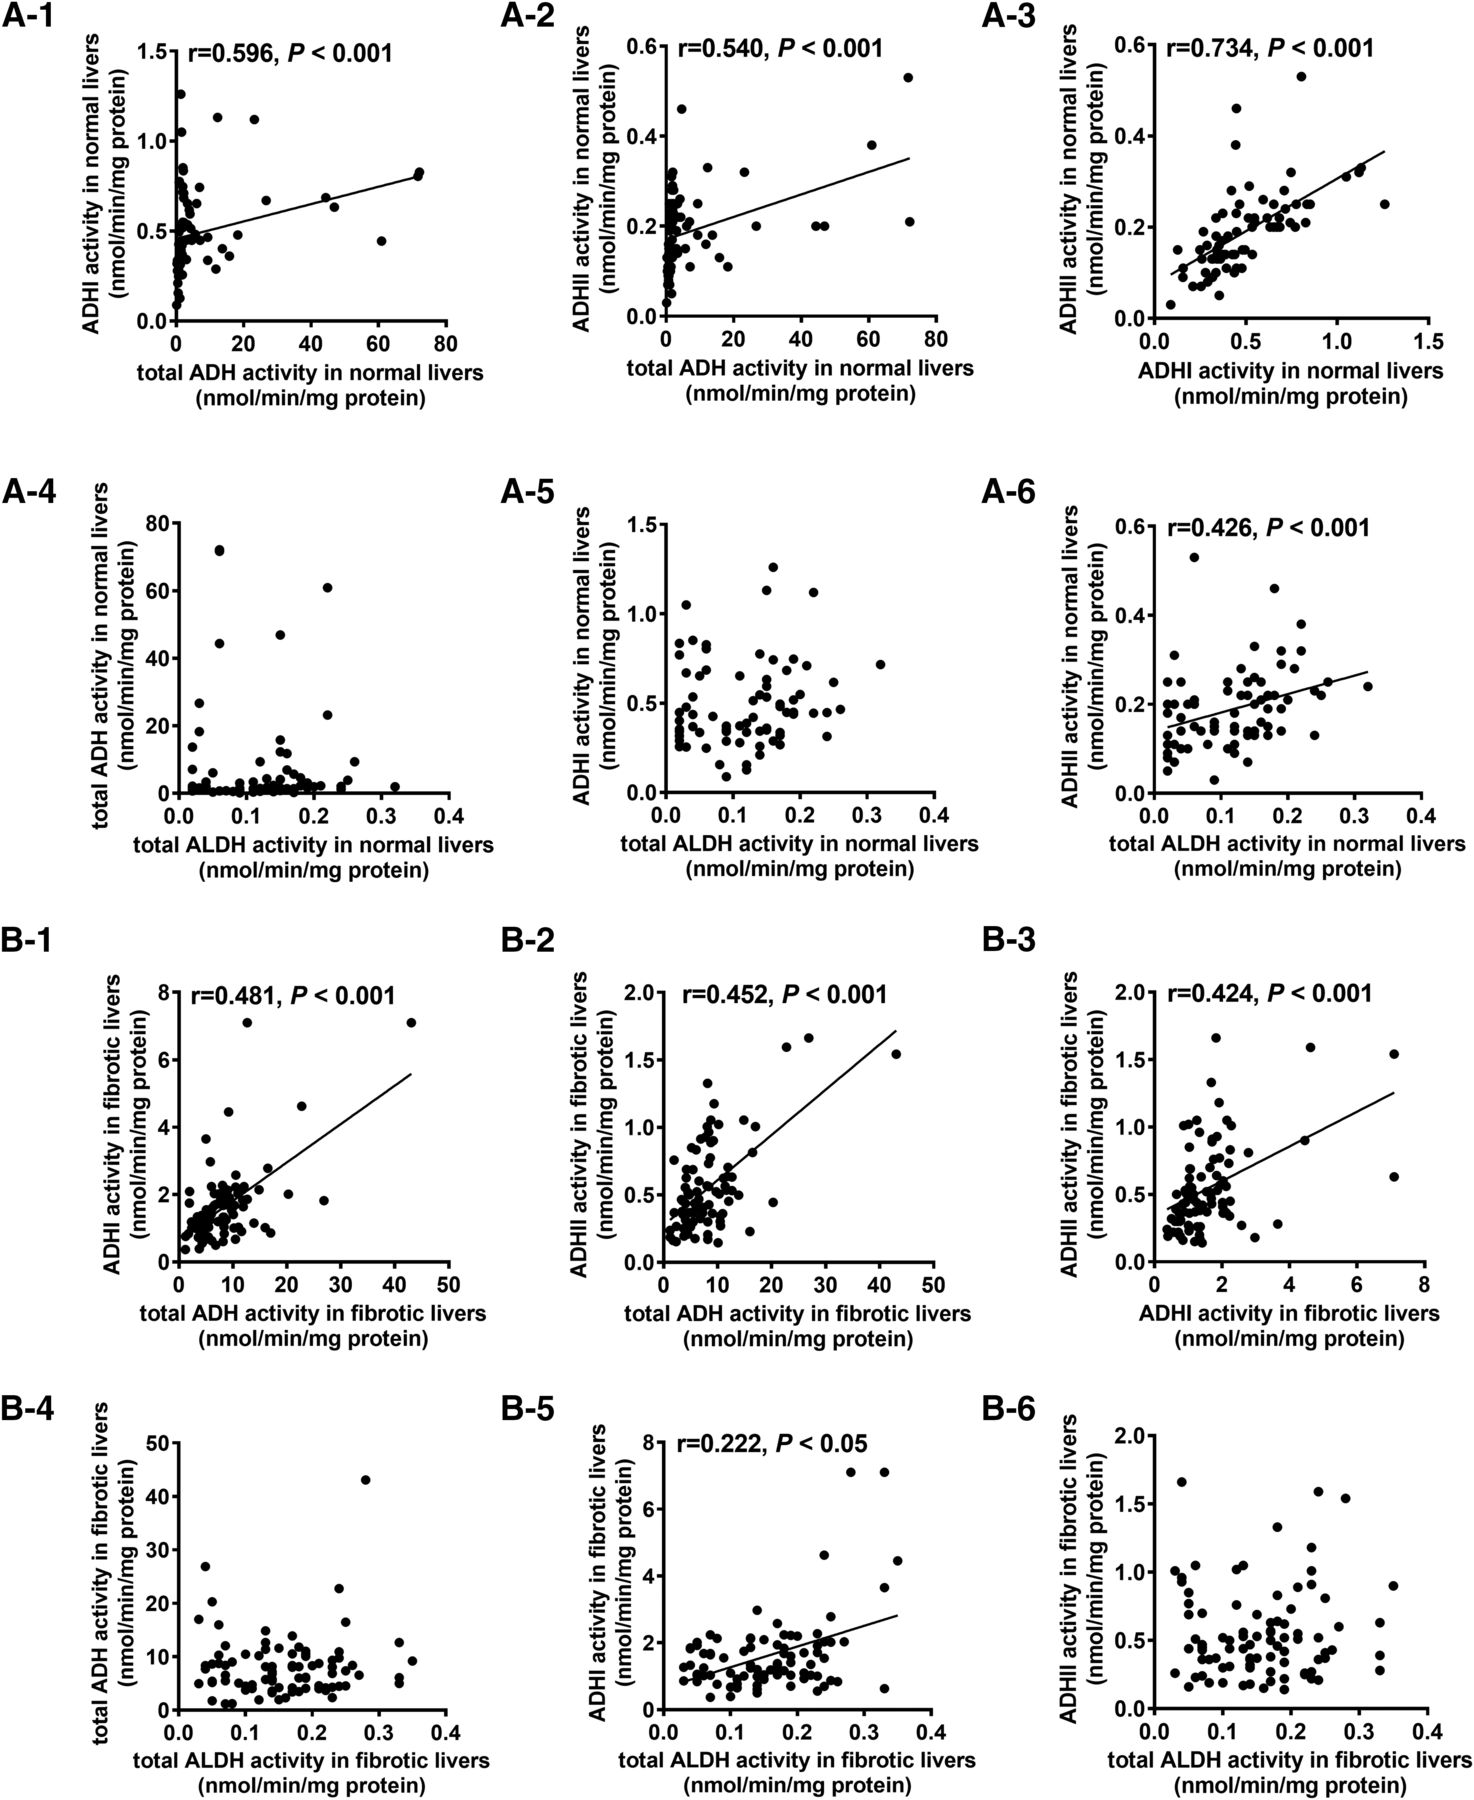
Correlations among the activities of ADH, ADHI, ADHII, and ALDH in normal (A-1 to A-6, n = 74) and fibrotic (B-1 to B-6, n = 88) human livers.
Correlation between the Activities of Total ADH, ADHI, ADHII, and ALDH and the Degree of Hepatofibrosis.
A positive correlation was noted between the activities ADHI, ADHII, and the extent of hepatofibrosis (P < 0.01; Fig. 2, B and C). Total ADH activity had no relationship with the extent of hepatofibrosis (P > 0.05 Fig. 2A). In addition, the ratio of ADHI/ALDH was also positively correlated with the degree of hepatofibrosis (P < 0.001; Fig. 2F). These results suggest that hepatofibrosis might significantly affect the activity of alcohol-metabolizing enzymes.

Correlations between the degree of hepatofibrosis and the activities of ADH (A), ADHI (B), ADHII (C), and ALDH (D), ratio of ADH to ALDH(E), and ratio of ADHI to ALDH (F) in fibrotic human livers (n = 88). S1: Portal area fibrosis expand and is confined in the hepatic sinus and lobule (5). S2: Fibrosis around portal area, fibrous septums form, lobule structure keep (15); S3: Fibrous septums and lobule structure disorder, without cirrhosis (23). S4: Early stage cirrhosis (45).
Positive Rate of Total ADH, ADHI, ADHII, and the Ratio of ADHI/ALDH in Fibrotic Liver Tissues.
To evaluate whether the increased alcohol-metabolizing enzyme activities or ratios might be potential biomarkers, we calculated the positive rates of ADH, ADHI, ADHII, ADH/ALDH, and ADHI/ALDH in fibrotic livers of HCC patients. Values over the P90 (percent 90) of the results for ADH, ADHI, ADHII, ADH/ALDH, and ADHI/ALDH in the normal group were considered positive. The positive rates of ADHI, ADHII, and ADHI/ALDH activities in fibrotic livers from HCC patients were 84.1%, 77.3%, and 19.3%, respectively, although the positive rates of total ADH and ADH/ALDH were quite low. One reason might be the substantial individual variations. The relationship between diagnostic sensitivity and specificity for ADHI and ADHII is illustrated by the receiver operator characteristics (ROC) curve, with the area under the ROC curve values a measure of diagnostic accuracy (Fig. 3), which showed that the area under the ROC curve for ADHI (0.943) and ADHII (0.912) was quite high.

Receiver-operating-characteristic (ROC) curves for ADHI and ADHII activity in human fibrotic livers. The areas under the ROC curve for ADH I and ADHII were 0.943 and 0.912, respectively.
The results indicated that the activities ADHI and ADHII were related to hepatofibrosis and could be good potential biomarkers. It was not clear, however, that the increase in ADH activities was a risk factor or a symptom for hepatofibrosis. To address this question, we established the fibrosis-carcinoma rat model for further study.
ADH Activity in the Rat Model
Establishment of the Fibrosis-Carcinoma Rat Model.
Representative appearances of the liver in the different groups are shown in Fig. 4A. The results of H&E and Masson staining are shown in Fig. 4, B and C. The H&E-stained sections were quantified by the Ishak score, and the Masson-stained sections were quantified by the percentage of fibrotic area. Compared with the control group, the Ishak scores and the Masson area% of the rats in fibrosis and HCC group were significantly increased (P < 0.001). No significant difference in Ishak score and Masson area% was found between the fibrosis and HCC rats (Fig. 4, D and E). Moreover, the values of ALT and AST levels in serum were significantly increased in the model group (Fig. 4F; P < 0.001) compared with controls at different times (8, 12, 16, and 19 weeks).

Macroscopic and histologic hepatic changes in a fibrosis-carcinoma rat model induced by DEN. (A) Representative rat livers. (B and C) Representative H&E (original magnification, 400×) and Masson staining (original magnification, 400×) of liver tissue. (D and E) Ishak score according to H&E staining and quantification of Masson staining area from each rat. (F) Serum ALT (F-1) and AST (F-2) levels. ***Compared with control group P < 0.001. Data represent means ± S.D. Control (n = 10): the rats were treated with normal saline and sacrificed at 19 weeks. Fibrosis group (n = 20): the rats were injected i.p. with 50 mg/kg DEN twice a week for 4 weeks, then injected i.p. with 50 mg/kg DEN once weekly to 12 weeks and sacrificed at 12 weeks. HCC group (n = 21): the rats were injected i.p. with 50 mg/kg DEN twice weekly for 4 weeks, then injected i.p. with 50 mg/kg DEN once a week to 14 weeks and sacrificed at 19 weeks.
Evaluation of Hepatocyte Proliferation.
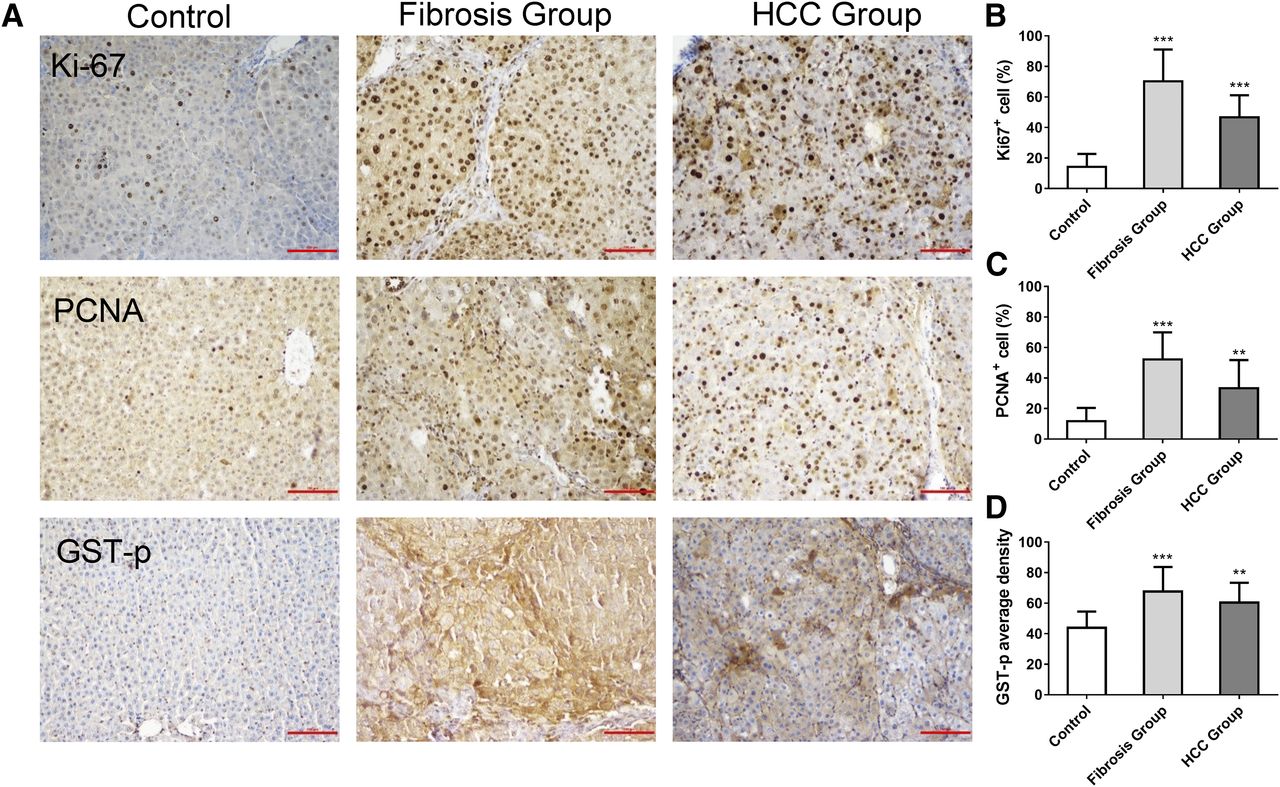
The percentage of Ki67-positive cells and PCNA-positive cells was significantly increased in rats of the fibrosis and HCC groups compared with the control group (Fig. 5, B and C; P < 0.01). Simultaneously, the hepatic GST-p-positive foci were determined. In model groups, the average densities of GST-p-positive foci were also significantly increased compared with controls (Fig. 5D; P < 0.01).

Immunohistochemistry of Ki67, PCNA, and GST-p in a fibrosis-carcinoma rat model induced by DEN. (A) Representative photographs of immunohistochemistry in liver sections stained for Ki67, PCNA, and GST-p in different groups (original magnification, 200×). (B–D) Quantification of Ki67, PCNA, and GST-p staining in different groups. **Versus controls P < 0.01; *** versus controls, P < 0.001. Data represent means ± S.D. Control (n = 10): the rats were treated with normal saline and sacrificed at 19 weeks. Fibrosis group (n = 20): the rats were injected i.p. with 50 mg/kg DEN twice a week for 4 weeks, then injected i.p. with 50 mg/kg DEN once a week to 12 weeks and sacrificed at 12 weeks. HCC group (n = 19): The data for 19 rats in the HCC group were determined. The rats were injected i.p. with 50 mg/kg DEN twice a week for 4 weeks, then injected i.p. with 50 mg/kg DEN once a week to 14 weeks and sacrificed at 19 weeks.
Evaluation of Activation of Hepatic Stellate Cells.
The expression levels of α-SMA and collagen 1 in liver were significantly higher in rats in the fibrosis and HCC groups than in the control group (Fig. 6, P < 0.05), and no significant difference was seen in the expression of α-SMA in rats in the fibrosis and HCC groups (Fig. 6); however, the expression of collagen 1 was significantly greater in HCC group than in the fibrosis group (P < 0.01).

Immunohistochemistry of α-SMA and collagen 1 in a fibrosis-carcinoma rat model induced by DEN. (A) Representative photographs of immunohistochemistry of liver sections stained for α-SMA (original magnification, 100×) and collagen 1α (original magnification, 100×). (B and C) H-score of α-SMA and collagen 1α in different groups. *Versus control, P < 0.05; **Versus control, P < 0.01; ***Versus control, P < 0.001; #Versus fibrosis group, P < 0.05. Data represent means ± S.D. Control (n = 8): rats were treated with normal saline and sacrificed at 19 weeks. Fibrosis group (n = 10): 10 rats were chosen randomly from the fibrosis group. The rats were injected i.p. with 50 mg/kg DEN twice a week for 4 weeks, then injected i.p. with 50 mg/kg DEN once a week to 12 weeks and sacrificed at 12 weeks. HCC group (n = 12): 12 rats were chosen at random from the HCC group. The rats were injected i.p. with 50 mg/kg DEN twice a week for 4 weeks, then injected i.p. with 50 mg/kg DEN once a week to 14 weeks and sacrificed at 19 weeks.
Alteration of ADH Activity in a Rat Model during the Progression of HCC Induced by DEN.
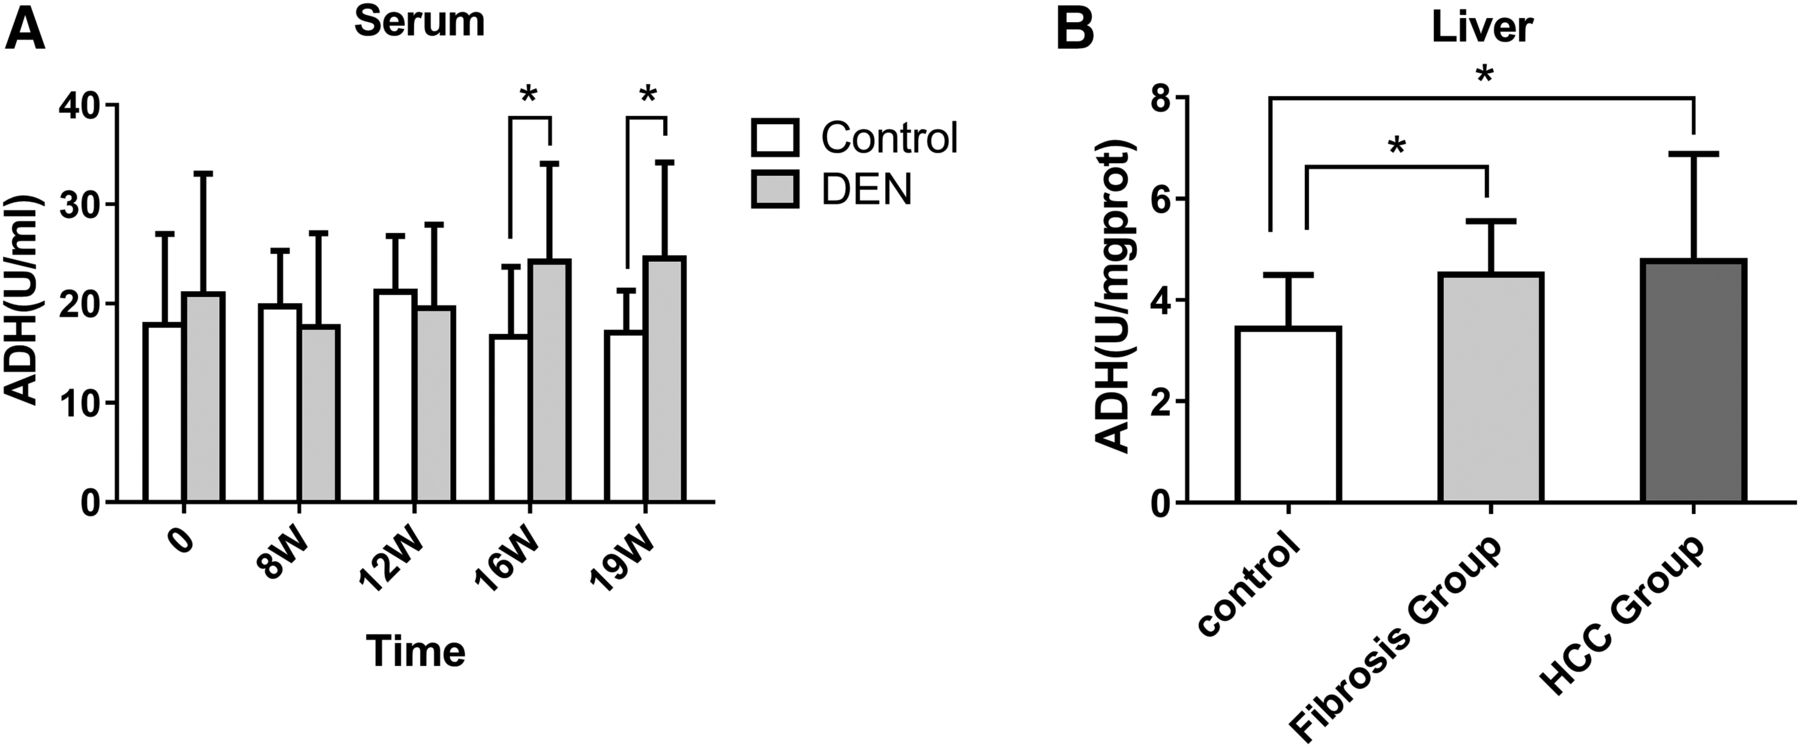
We measured the activities of ADH in the serum and liver. Compared with the control group, the activity of ADH in the serum of rats treated with DEN was significantly increased at the 16th week (24.21 ±9.86 U/ml) and the 19th week (24.56 ± 9.65 U/ml), with no significant change at 8th and 12th weeks (Fig. 7A, P > 0.05).

Activities of ADH in serum (A) and liver tissues (B) in a fibrosis-carcinoma rat model induced by DEN. *Versus control, P < 0.05. Date represent means ± S.D. Control (n = 10): the rats were treated with normal saline and sacrificed at 19 weeks. Fibrosis group (n = 20): the rats were injected i.p. with 50 mg/kg DEN twice a week for 4 weeks, then injected intraperitoneally with 50 mg/kg DEN once a week to 12 weeks and sacrificed at 12 weeks. HCC group (n = 21): the rats were injected i.p. with 50 mg/kg DEN twice weekly for 4 weeks and then injected i.p. with 50 mg/kg DEN once a week to 14 weeks and sacrificed at 19 weeks.
Compared with the control group (3.41 ± 1.12 U/mg protein), the ADH activity in the livers of rats treated with DEN was significantly increased in rats in the fibrosis (4.50 ± 1.05 U/mg protein) and in the HCC groups (4.77 ± 2.11 U/mg protein) (Fig. 7B, P < 0.05). These results suggest that the activity of ADH in livers at the fibrotic stage is greater than that in controls, but from hepatofibrosis to HCC, no significant change in ADH activity was seen. Given that the activity level of ADH was higher in fibrotic livers from HCC patients than that in controls, we conclude that the activities ADHI and ADHII might be good potential biomarkers for hepatofibrosis.
Relationship between ADH Activity and Liver Injury or Hepatocyte Proliferation in Rats.
To confirm that high ADH activity is a risk factor for hepatofibrosis or HCC, we determined the innate activity of ADH in serum. A positive correlation was found between the innate activity of ADH (0 week) in the serum of rats in the fibrosis group and the extent of fibrosis as measured by the four indexes (i.e., Masson area%, Ki67+%, PCNA+%, GST-p average density), and the correlation coefficients were 0.453, 0.512, 0.457, 0.450, respectively (Fig. 8A; P < 0.05). No correlation was established between the innate ADH activity of rats in the HCC group and indices reflecting hepatic lesions (P > 0.05; data not shown). In addition, no significant correlation was found between the innate activity of ADH and the expression of α-SMA and collagen 1 in rats of both the fibrosis and HCC groups (data not shown). The results indicate that rats with higher ADH activity levels were more prone to hepatofibrosis, which suggests that the high activity level might be a risk factor for hepatofibrosis.
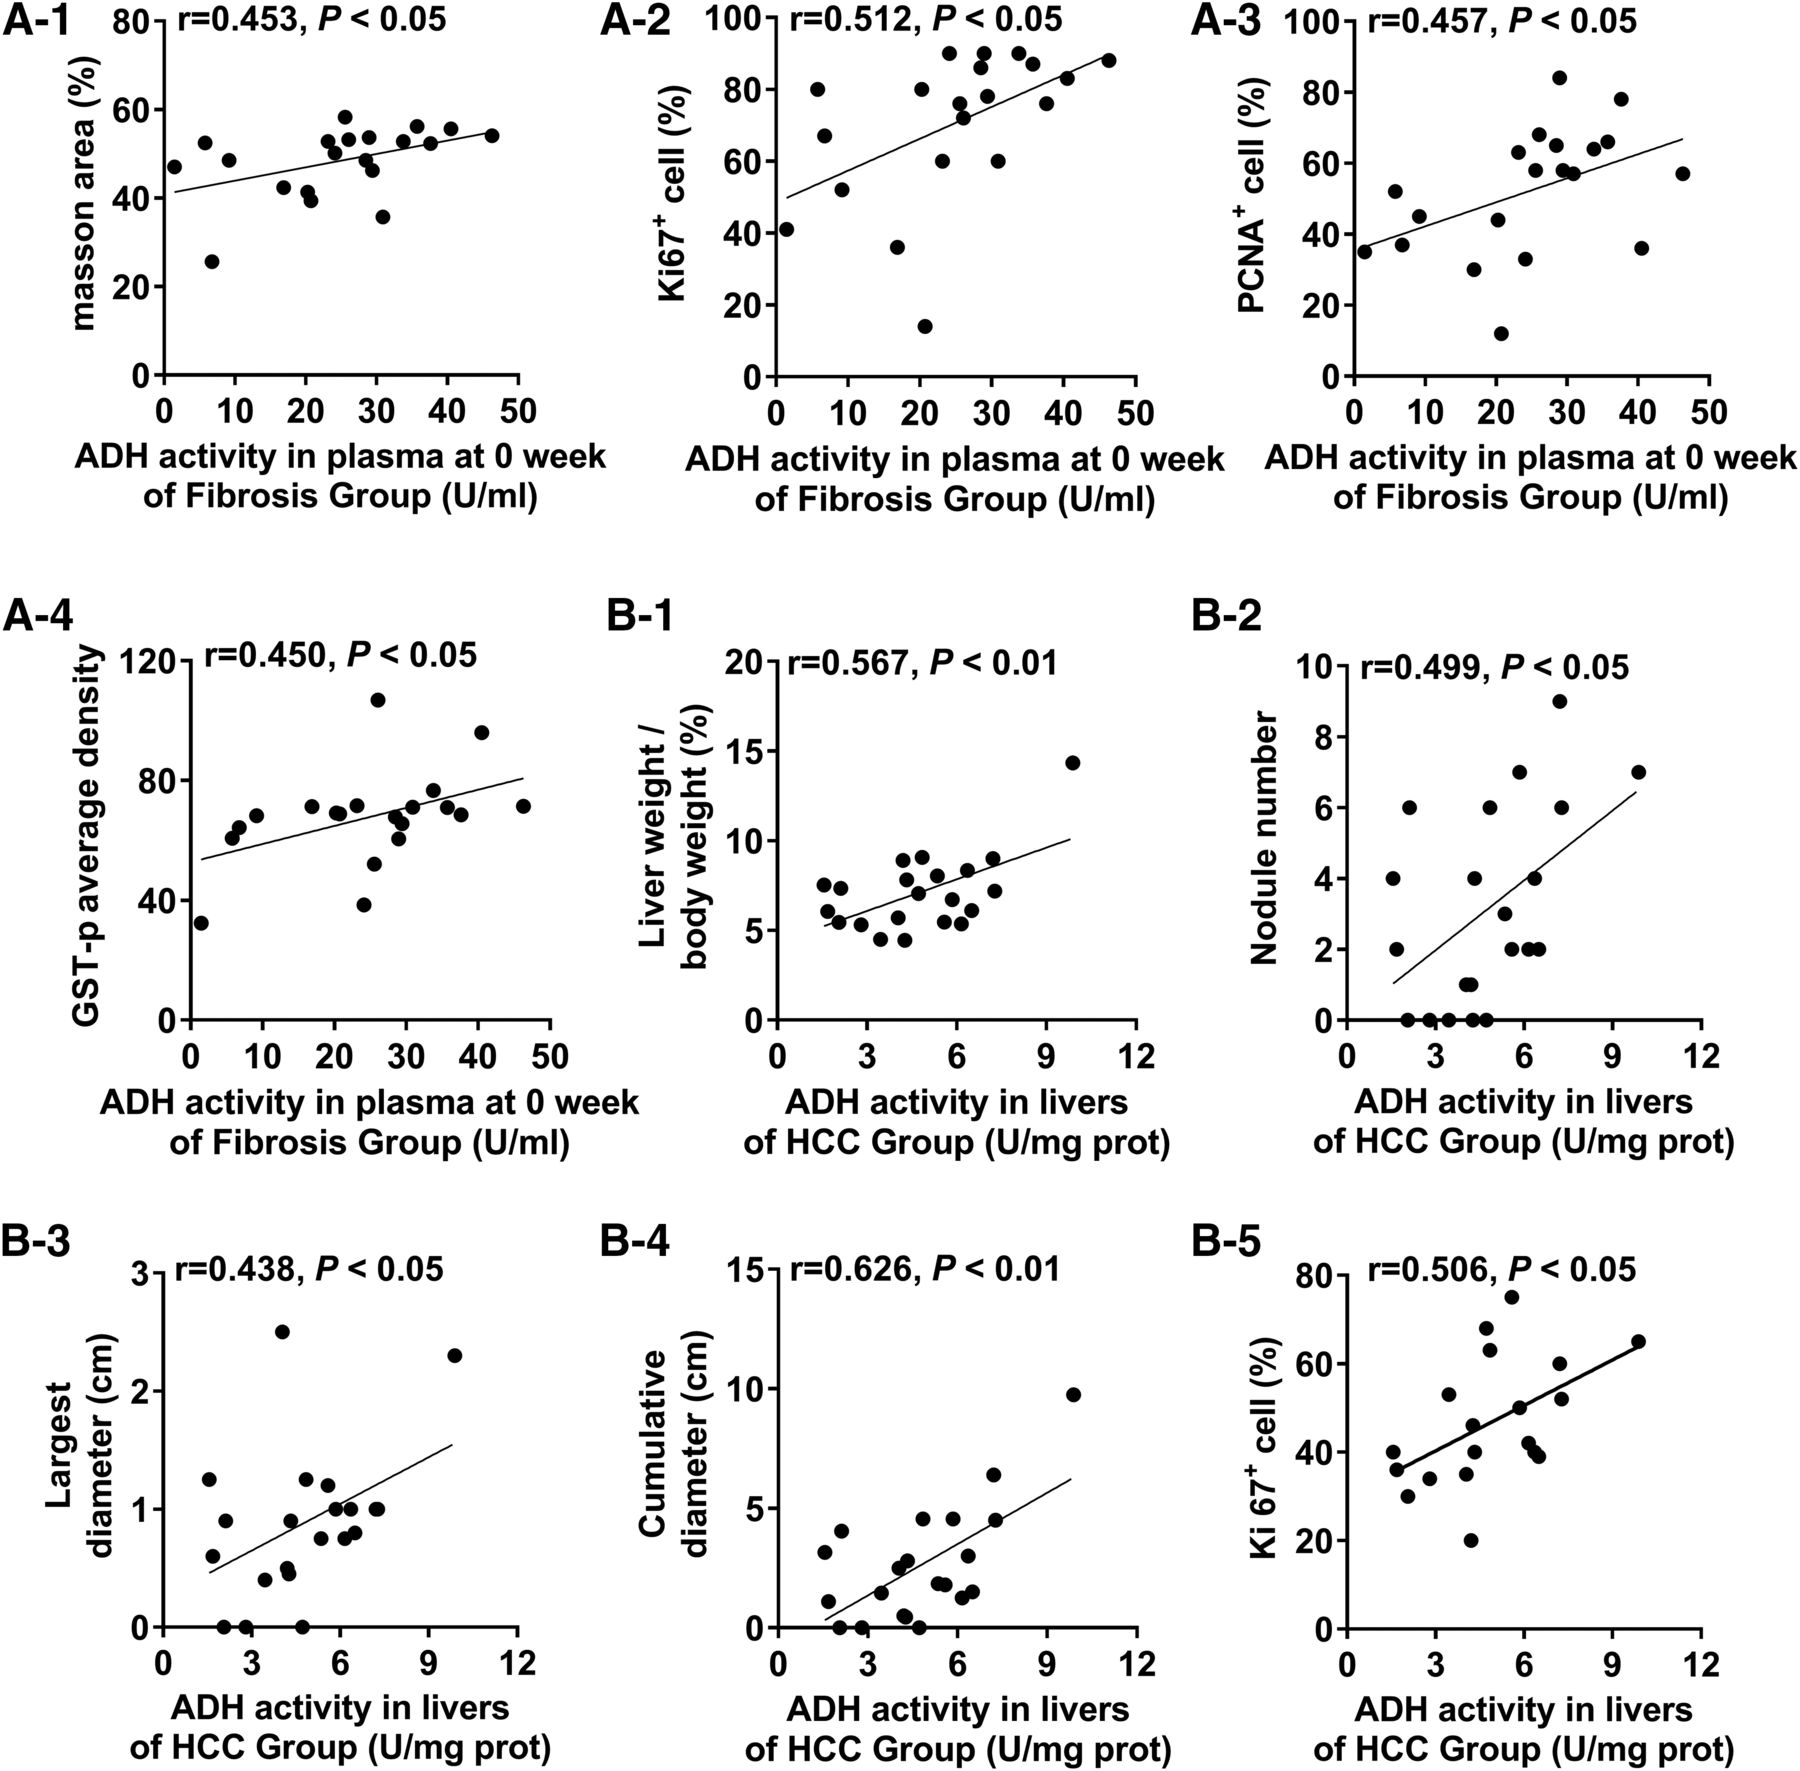
Correlations between index of hepatic lesions and ADH activity in a fibrosis-carcinoma rat model induced by DEN. (A-1 to A-4) Correlations between liver injury-related indicators and ADH activity in serum at week 0 of the fibrosis group. (B-1 to B-5) Correlations between liver injury-related indicators and ADH activity in rat livers from the HCC group. Fibrosis group (n = 20): the rats were injected i.p. with 50 mg/kg DEN twice a week for 4 weeks, then injected i.p. with 50 mg/kg DEN once a week to 12 weeks and sacrificed at 12 weeks. HCC group (n = 21): the rats were injected i.p. with 50 mg/kg DEN twice weekly for 4 weeks, then injected i.p. with 50 mg/kg DEN once weekly to 14 weeks and sacrificed at 19 weeks. The Ki67 of 19 rats in HCC group was determined.
In addition, ADH activity in the liver of rats in the HCC group correlated with the five indexes reflecting hepatic lesions (liver weight/body weight, nodule number, largest diameter of nodule, cumulative diameter of nodule, Ki67+%), and the correlation coefficients were 0.567, 0.499, 0.438, 0.626, 0.506, respectively (Fig. 8B; P < 0.05).
Discussion
This study provides the physiologic values of ADH and ALDH activities along with the ratio ADH to ALDH in human normal livers. Results showed that ADH activity was significantly greater in fibrotic livers. The positive rates of ADHI and ADHII were greater than 70%, and the area under ROC curve was greater than 0.9. The results of the animal experiments further indicated that ADH activity in livers was greater at the fibrotic stage and that there was no significant difference in that measure between fibrosis and the HCC stage. Moreover, significant correlation was found between the innate activity of ADH in serum and the extent of fibrosis as indicated by Masson area%, Ki67+%, PCNA+%, and GST-p average density at fibrosis stage. We conclude that elevated activity of ADH may be a risk factor for hepatofibrosis. Moreover, ADH activity can also be a biomarker for hepatofibrosis.
Drinking alcohol has been recognized as a major risk factor for hepatofibrosis and HCC, together with hepatitis B virus and hepatitis C virus infection (Jelski et al., 2008b). It is accepted that ethanol is metabolized to acetaldehyde by ADH and that acetaldehyde is oxidized by ALDH to acetic acid in the liver. Acetaldehyde, the intermediate product of ethanol, is toxic. Therefore, not only ADH and ALDH, but also the ratio of ADH and ALDH, are very important, especially ADHI/ALDH, owing to ADHI being mainly responsible for ethanol metabolism. To date, there have been no reports on the physiologic values or reference ranges for the activities of the various isozymes of ADH. Hence, determination of the activity level and individual variations in ADH activity over a large number of samples is needed to provide reliable physiologic parameters for in vivo and in vitro research.
Our study was first to report the physiologic values of ADH activity, ALDH activity, and the ratio of ADHI and ALDH in 74 normal human liver samples and found that they vary by 14- to 809-fold in different individuals. Dannenberg et al. (2006) reported that the expression of ADHI in HepG2 cells may be regulated by an epigenetic mechanism, such as methylation and histone deacetylation. We shall explore the factors involved in the activities of ADH in a future study.
Our results show that all ADH isozyme activities in fibrotic livers were significantly greater than that in normal livers. The positive rates of both ADHI and ADHII were greater than 70%. Most HCCs develop from hepatofibrosis, and the potential curative treatment options are limited (Kimhofer et al., 2015), so it is quite important to look for biomarkers for hepatofibrosis. It has been reported that some substances, such as angiopoietin-like protein 2 or serum biglycan, can be biomarkers for liver fibrosis, but the area under the ROC curve for the reports were lower than 0.9 (Ciftciler et al., 2017; Deng et al., 2017). In this study, the area under the ROC curve for ADHI and ADHII was greater than 0.9. Moreover, the value of ADHI showed good correlation with the degree of hepatic fibrosis. As a result, ADHI and ADHII could be potential biomarkers for hepatofibrosis. It is well known that although some substances can be used as a biomarker for some diseases, most cannot be considered a risk factor. In this study, we found that the ADH activity was not only a biomarker but also a risk factor for hepatofibrosis.
We analyzed the correlations among ADH isozymes and ALDH and found significant correlation among total ADH, ADHI, and ADHII in normal and fibrotic livers. Amino acid sequence identity between ADH isozymes was at the 60% level (Jelski and Szmitkowski, 2008). The marked correlations among ADH isozyme activities provided clear evidence for the coregulation of ADH forms. In addition, the correlations between ADH isozymes and ALDH in fibrotic liver were different from that in normal liver. In the normal liver, the activity of ALDH had obvious correlations with ADHII. In fibrotic livers from HCC, it was changed to ADHI, which is mainly responsible for metabolism of ethanol. The results suggested that the liver disease significantly affected the activity of the alcohol-metabolizing enzyme.
To further confirm that higher activity level is a symptom or a susceptibility factor for hepatofibrosis or HCC, we established a hepatic fibrosis-carcinoma rat model induced by DEN. Our results also found that rats treated with DEN at 12 and 19 weeks showed the characteristic histologic changes of fibrosis and HCC, respectively. We also measured some indices of liver injury, including Masson area%, Ki67+%, PCNA+%, and GST-p average density; we found that the innate activity of ADH in serum showed moderate correlations with four indices in the fibrosis stage but not in the HCC stage. Thus, the increase in innate activity of ADH may be a susceptibility factor for hepatic fibrosis but not for HCC. Recent research showed the lack of ADHIII in hepatic stellate cells and natural killer cells to be associated with inhibition of hepatofibrosis (Yi et al., 2014); these findings are similar to our results. In addition, our results indicated that the expression levels of α-SMA and collagen 1 were significantly higher in rats in the fibrosis and HCC groups than those in the control group, similar to the results of Ding et al. (2017); however, no correlation was found between ADH activity and content of α-SMA and collagen 1. The detailed mechanism has not been established and should be further explored.
In summary, total ADH, ADH I, and ADHII activities were significantly greater in human fibrotic livers than in normal livers. In a rat liver model, a causal relationship was found between the innate activity of ADH in serum and hepatofibrosis. The results suggest that the higher activity level of ADH may be a risk factor for hepatic fibrosis, and it is possible for ADH to be viewed as a target for hepatic fibrogenesis.
Authorship Contributions
Participated in research design: Qiao.
Conducted experiments: N. Gao, J. Li, Qi, Z. Wang, G.-J. Wang, J. Gao.
Performed data analysis: N. Gao, J. Li, M.-R. Li.
Wrote or contributed to the writing of the manuscript: N. Gao, J. Li.
Footnotes
- Received March 29, 2018.
- Accepted September 5, 2018.
This work was supported by the National Natural Science Foundation of China (Grants 81473279 and 81673507) and Henan province key program of science and technology (Grant 162102310519) and Foundation for University Key Teacher by Henan province.
Abbreviations
- ADH
- alcohol dehydrogenase
- ALDH
- acetaldehyde dehydrogenase
- ALT
- alanine aminotransferase
- AST
- aspartate aminotransferase
- DEN
- diethylnitrosamine
- GST
- glutathione-S-transferase placental form
- HCC
- hepatocellular carcinoma
- PCNA
- proliferating cell nuclear antigen
- ROC
- receiver operator characteristic
- SMA
- smooth muscle actin
- Copyright © 2018 by The American Society for Pharmacology and Experimental Therapeutics


