


Abstract
In this study, we examined the effects of target expression, neonatal Fc receptor (FcRn) expression in tumors, and pH-dependent target binding on the disposition of monoclonal antibodies (mAbs) in murine models of colorectal cancer. A panel of anti-carcinoembryonic antigen (CEA) mAbs was developed via standard hybridoma technology and then evaluated for pH-dependent CEA binding. Binding was assessed via immunoassay and radioligand binding assays. 10H6, a murine IgG1 mAb with high affinity for CEA at pH = 7.4 (KD = 12.6 ± 1.7 nM) and reduced affinity at pH = 6.0 (KD = 144.6 ± 21.8 nM), and T84.66, which exhibits pH-independent CEA binding (KD = 1.1 ± 0.11 and 1.4 ± 0.16 nM at pH 7.4 and 6.0), were selected for pharmacokinetic investigations. We evaluated pharmacokinetics after intravenous administration to control mice and to mice bearing tumors with (MC38CEA+, LS174T) and without (MC38CEA−) CEA expression and with or without expression of murine FcRn, at doses of 0.1, 1, and 10 mg/kg. 10H6 displayed linear pharmacokinetics in mice bearing MC38CEA+ or MC38CEA− tumors. T84.66 displayed linear pharmacokinetics in mice with MC38CEA− tumors but dose-dependent nonlinear pharmacokinetics in mice bearing MC38CEA+. In addition to the improved plasma pharmacokinetic profile (i.e., linear pharmacokinetics, longer terminal half-life), 10H6 exhibited improved exposure in MC38CEA+ tumors relative to T84.66. In mice bearing tumors with CEA expression, but lacking expression of murine FcRn (LS174T), 10H6 demonstrated nonlinear pharmacokinetics, with rapid clearance at low dose. These data are consistent with the hypothesis that pH-dependent CEA binding allows mAb dissociation from target in acidified endosomes, enabling FcRn-mediated protection from target-mediated elimination in mice bearing MC38CEA+ tumors.
Introduction
Currently, 23 monoclonal antibodies (mAbs) have been approved by the Food and Drug Administration for cancer indications, and many more are in late stages of clinical development (Reichert, 2012, 2016, 2017; Ecker et al., 2015). The market for mAbs is rapidly expanding, with projected worldwide sales of $125 billion by 2020 (Ecker et al., 2015). With increased development of mAb drugs, there is increasing interest in optimization strategies, including efforts to engineer mAbs for improved stability, pharmacokinetics, and pharmacodynamics (Beck et al., 2010). Optimization of pharmacokinetics has focused primarily on engineering mAbs for higher-affinity binding to the Fc receptor of the neonate, FcRn, which protects IgG antibodies from intracellular catabolism (Hinton et al., 2004; Dall’Acqua et al., 2006) or engineering mAb molecular charge (Boswell et al., 2010); however, there has been growing interest in the development of mAbs with pH-dependent target binding that allows efficient target binding at physiologic pH, but where mAb-target binding is substantially reduced at acidic pH. This pH-dependent binding allows mAbs to bind (i.e., “catch”) target in extracellular fluid but also to release target in the acidic environment of endosomes. After release from target, the unbound mAb may be salvaged from intracellular catabolism via transport mediated by FcRn. In some cases, pH-dependent binding decreased the efficiency of target-mediated mAb elimination, decreasing mAb clearance, extending exposure, and enhancing the extent and duration of mAb effects (Igawa et al., 2010; Chaparro-Riggers et al., 2012).
Junghans and Anderson (1996) hypothesized that catch-and-release (CAR) binding and FcRn-mediated recycling of unbound mAb could explain observations made after the administration of anti-interleukin-2 receptor (IL2R) mAbs in wild-type and FcRn-knockout mice (Junghans and Waldmann, 1996). In FcRn-knockout mice, they found that the receptor and the antibody demonstrated similar rates of elimination, but they found that the receptor was eliminated more rapidly than the antibody in wild-type mice (with functional expression of FcRn). They hypothesized that mAb-IL2R complexes are endocytosed, with dissociation of mAb from IL2R in the acidic environment of the endosome. In the presence of functional FcRn, mAb is transported out of the cell, whereas in the absence of functional FcRn, the mAb and receptor are delivered to the lysosome for catabolism.
CAR mAb binding may be mediated through ionization of histidine residues. Histidine has a pKa of ∼6, and it is the only naturally occurring amino acid that protonates in the range of endosomal acidification (pH 7.4–5.5) (Markley, 1975; Geisow and Evans, 1984). This unique behavior makes it critically important to many naturally occurring pH-triggered protein-protein interactions (Vaughn and Bjorkman, 1998). Histidine protonation may act to stabilize or to destabilize mAb-ligand binding sites, either by direct charge attraction or charge repulsion or via less direct effects, perhaps by effects of histidine protonation on the tertiary structure of the protein (Vaughn and Bjorkman, 1998). Several groups have engineered mAbs for CAR binding by replacing residues in or near the mAb-ligand binding pocket with histidine (i.e., “histidine switching”) (Igawa et al., 2010; Chaparro-Riggers et al., 2012). In two recent examples, mAbs were developed for CAR binding to IL6R and to PCSK9, where the mAbs were engineered with a ∼10-fold decrease in affinity at pH of 6.0 relative to pH 7.4. In each case, the CAR mAb demonstrated a dramatic reduction in target mediated elimination compared with “standard” mAb (i.e., mAb that exhibit high affinity binding across the pH range of 5.5–7.4).
Carcinoembryonic antigen (CEA, CEACAM5, or CD66e) is a highly glycosylated 180-kDa cell-surface glycoprotein that is expressed on the luminal side of the colon in healthy adults (Hammarstrom, 1999). The primary role of CEA is thought to be mediation of cellular contact by either homophilic or heterophilic intercellular binding mechanisms (Zheng et al., 2011). CEA can internalize mAbs with an uptake half-life of 10–16 hours (Schmidt et al., 2008). Many types of cancers show a substantial overexpression of CEA (Hammarstrom, 1999), and CEA overexpression has been found in ∼90% of colorectal tumors (Goldstein and Mitchell, 2005). The selective overexpression of CEA has led to significant interest in developing anti-CEA mAb for imaging and treatment (Mach et al., 1981; Rowland et al., 1986; Baum et al., 1989; Kraeber-Bodéré et al., 2006; Shin et al., 2015).
The purpose of the present work is to examine the plasma pharmacokinetics of a newly developed anti-CEA CAR antibody, 10H6, in a mouse model of colorectal cancer, with comparison of results to those found for an anti-CEA mAb that exhibits pH-independent binding (T84.66).
Materials and Methods
CEA Immunization
Three female BALB/c (Harlan, Indianapolis, IN) mice were immunized with 100 µl of emulsified CEA (cat. no. 151-10; Lee Bio Solutions, St. Louis, MO). CEA emulsification was prepared by dilution of 50 µg of CEA in 50 µl of phosphate-buffered saline and subsequent emulsification with an equal volume of Freund’s incomplete adjuvant (cat. no. D2650; Sigma, St. Louis, MO). Mice were boosted with emulsified CEA at 3 and 6 weeks. One week after the last booster injection, mouse blood was sampled, and mouse plasma was assayed for anti-CEA activity with an antigen-capture enzyme-linked immunosorbent assay (ELISA). The mouse with the highest assay signal was chosen for fusion and given a final i.p. injection of 50 µg of CEA in 100 µl of isotonic saline.
Antigen-Capture ELISA for the Detection of Anti-CEA IgG Binding
An antigen (CEA) captured ELISA was developed to quantify anti-CEA antibody in both plasma and cell culture media, as well as to assess pH-dependent binding. Briefly, ELISA plate (cat. no. 62409-002; VWR, Bridgeport, NJ) wells were coated with 250 µl of 3 µg/ml of CEA in 0.02 M Na2HPO4 (no pH adjustment) for 2 hours at 37°C. ELISA plates were washed three times with 0.05% Tween in 0.02 M Na2HPO4 and then three times with diH2O. Samples (100 µl of either plasma diluted 100-fold in pH 7.4 1 × phosphate-buffered saline (PBS) or 100 µl of cell culture media) were then dispensed on the plate and allowed to incubate for 2 hours at room temperature. Plates were washed as described previously and then incubated for 1 hour with PB-Tween (20 mM Na2PO4, 0.05% Tween) containing 0.2% v/v alkaline phosphatase (AP) conjugated to murine Fc-specific goat secondary IgG and 3% v/v bovine serum albumin (BSA) (30% v/v, cat. no. A1317; US Biologic, Salem, MA). After the final plate wash, 200 µl of freshly prepared 4 mg/ml p-nitro phenyl phosphate (PNPP) (cat. no. 34045; Pierce, Rockford, IL) in pH 9.8 diethanolamine buffer (cat. no. 34064; Pierce) was added to each well. The change in absorbance with time (dA/dt) at 405 nm was assessed using a Spectra Max 340 plate reader (Molecular Devices, Sunnyvale, CA).
Anti-CEA Hybridoma Development
The mouse with the highest level of anti-CEA IgG in plasma was selected for hybridoma development. Briefly, 5 × 10⁶ SP 2/0-Ag 14 myeloma cells (ATC, Manassas, VA) were transferred to RPMI1640 (cat. no. 11875; Life Technologies, Grand Island, NY), containing 20% fetal bovine serum (FBS) (cat. no. 10082147; Life Technologies), and 2× oxaloacetate pyruvate insulin media supplement (OPI; cat. no. O5003; Sigma). Three days after the intraperitoneal booster dose, the mouse was euthanized, and the spleen was removed aseptically. Spleen tissue was teased apart with an 18-gauge needle, and the disrupted tissue was then mixed with 10 ml of warmed RPMI1640 media. After centrifuging the spleen cell suspension and the myeloma cell suspension at 500g for 5 minutes, both pellets were resuspended in warmed RPMI1640 media. The resuspended cells were then combined and centrifuged at 800g for 5 minutes, and 1 ml of 50% polyethylene glycol (cat. no. P7181; Sigma) was added dropwise to the pellet and then gently mixed before the addition of 10 ml of prewarmed RPMI1640, which was slowly added and gently mixed over the course of 3 minutes. The mixture was then centrifuged, and the pellet was resuspended with 200 ml of RPMI1640 media containing 20% FBS, 1× OPI, HAT (hypoxanthine, aminopterin, and thymidine) (cat. no. H0262; Sigma), and 5 mg/liter of gentamicin (cat no. 15710072; Life Technologies). The media was then dispensed (175 µl/well) into 96-well plates.
Hybridoma Screening and Cloning
The cell media supernatant of every well was tested via the antigen-capture ELISA for anti-CEA IgG. In initial testing, media were pooled from eight wells. In cases where the pooled media provided a positive assay response (defined as a dA/dt >3×blank media), individual wells were subsequently screened. Individual hybridoma colonies identified as positive for anti-CEA IgG were then cloned by the method of single-cell picking. Briefly, a small portion of cells from each well containing uncloned anti-CEA IgG-positive hybridoma cells was diluted and transferred to a sterile 96-well plate lid. Single cells were identified under 40× magnification and transferred with a 2.5-µl pipettor to individual wells of a 96-well plate (containing 175 µl of fresh RPMI1640 cell culture media, with 20% FBS and 1× OPI). Individual cells divided until colonies became visible (10–14 days) before testing cell culture supernatant for anti-CEA IgG. This cloning process was then repeated to ensure monoclonality.
Screening for pH-Dependent Antigen Binding
Anti-CEA IgG antibodies were tested for pH-dependent CEA binding with the use of the antigen capture ELISA. Hybridoma cell culture media for each antibody were pH adjusted to either 7.0 or 5.5 and then tested, in triplicate, for binding to CEA. Antibodies that showed a significant reduction in binding with decreased pH were then neutralized and retested. Briefly, antibody containing media was pH-adjusted to 7.0 and 5.5. After 30 minutes, a portion of the pH 5.5 media was pH-adjusted back to 7.0. These samples were then tested via ELISA in triplicate. Results were compared by Student’s two-tailed t test, with statistical significance assumed when P ≤ 0.05.
Antibodies that demonstrated reversible pH-dependent binding were then more fully characterized over a range of pH. Hybridoma cell culture media were adjusted to pH 5.5, 6.0, 6.5, and 7.8, with each pH tested by antigen capture ELISA in triplicate.
IgG Protein G Purification
A BioLogic medium-pressure chromatography system (Bio-Rad, Hercules, CA), using a 5-ml HiTrap Protein G HP column (GE Healthcare, Uppsala, Sweden), was used to purify anti-CEA mAbs from hybridoma cell culture media. Cell culture media was loaded onto the Protein G column, and then 20 mM Na2HPO4 buffer (pH 7.0) was used to wash the column. IgG was then eluted from the column with 100 mM glycine buffer (pH 2.8), and 3-ml fractions collected in glass test tubes were immediately neutralized with 100 µl of 1 M Tris buffer. A 10K MWCO Slide-A-Lyzer dialysis cassette (Pierce Biotechnology) was then used to buffer exchange purified IgG into 1× PBS (pH 7.4).
Analysis of 10H6 Cellular CEA Binding by Flow Cytometry
To test 10H6 for binding to membrane-bound cellular CEA, flow cytometry analyses were conducted. Two cell lines that express CEA were used: LS174T (no. CL-188; American Type Culture Collection, Manassas, VA), a human colon cancer cell line, and MC38CEA+ (received as a gift from Dr. Abdul-Wahid from the University of Toronto), a murine colorectal cancer cell line that is stably transfected with human CEA. Nontransfected MC38 (MC38CEA−) was used within this experiment as a negative control. The high affinity anti-CEA IgG1κ mAb T84.66 (#HB-8747; ATCC,) was used as a positive control for CEA binding. 8C2, an anti-topotecan IgG1κ (Chen and Balthasar, 2007; Shah and Balthasar, 2014), was used as a nonbinding isotype control. Flow cytometry experiments were conducted at room temperature and pH 7.4 unless otherwise noted.
Briefly, cell lines were grown to ∼50% confluency, trypsinized, and harvested. After two successive washes with PBS containing 1 mM EDTA, cells were counted and dispensed into ∼1 × 10⁶ cell aliquots. Cells were then pelleted by centrifugation (400g) and resuspended into 300 µl of PBS containing 1 mM EDTA and 1% v/v BSA to block nonspecific binding and incubated at 37°C for 15 minutes. After washing, cells were resuspended in 300 µl of PBS with 1 mM EDTA spiked with 1 µg of primary antibody (10H6, T84.66, 8C2, or blank), gently agitated, and incubated for 30 minutes. Cells were then washed and blocked with PBS containing 1% v/v goat serum (cat. no. 16210-064; Life Technologies) for 15 minutes at 37°C. Cells were washed and then labeled with 300 µl of PBS containing 1 mM EDTA and phycoerythrin-conjugated goat anti-mouse IgG Fc (cat. no. 31861; Thermo Fisher Scientific, Rockford, IL) diluted 200:1 v/v for 30 minutes. Samples were washed and stored in 1 ml of PBS with 1 mM EDTA on ice and protected from light until flow cytometry analysis. A BD Fortessa SORP (BD Biosciences, San Jose, CA) flow cytometer was used to analyze all samples.
Competitive ELISA to Assess pH-Dependent Binding
A competitive ELISA was developed to assess the pH-dependent binding of purified antibody. 10H6 and T84.66 were labeled with AP using a commercial kit from Abcam (Abcam, Cambridge, MA cat. no. ab102850). Nunc MaxiSorp flat-bottom 96-well ELISA plates were coated with 250 µl of 1 µg/ml recombinant CEA overnight at 4°C. After incubation, plates were washed with phosphate-buffered Tween three times followed by two washes of diH2O. Experimental solutions of antibody were spiked with AP conjugate (1:5000–10,000). Samples were then added to each well in an amount of 250 µl, followed by a 2-hour incubation at room temperature. After incubation, plates were washed according to the steps provided here. A solution of 4 mg/ml pNPP was made in 1× diethanolamine substrate buffer, pH 9.8. Lastly, 250 µl of pNPP solution was added to each well. Absorbance was measured at 405 nm immediately after the addition of pNPP mixture using the kinetic setting on a SpectraMax 340PC. Data were then fit to an inhibition function using ADAPT 5 (Biomedical Simulations Resource, USC, Los Angeles, CA) to obtain KD values in eq. 1:
 (1)
(1)Preparation of 125I-T84.66 and 125I-10H6
T84.66 and 10H6 were radiolabeled with 125I with the modified chloramine-T method described previously (Garg and Balthasar, 2007). Briefly, 40 µl of antibody (1 mg/ml in pH 7.4 PBS) was combined with 10 µl of Na125I (100 mCi/ml) (PerkinElmer, Waltham, MA) and subsequently reacted with 20 µl of chloramine-T (1 mg/ml in pH 7.4 PBS). After 90 seconds, the reaction was terminated by the addition of 40 µl of 10 mg/ml potassium iodide. Immediately after the reaction, gel filtration (Sephadex G-25 column; GE Healthcare Bio-Sciences, Pittsburgh, PA) was performed to separate 125I-labeled intact antibody from the mixture. A γ-counter was used (LKB Wallac 1272; Wallac, Turku, Finland) to count the fraction containing 10H6-conjugated 125I. Thin-layer chromatography (PE SiL-G; Whatman Ltd, Kent, England) was used immediately before pharmacokinetic experiments to confirm that >99% of protein was associated with 125I.
Evaluation of 10H6 Cellular Dissociation Kinetics
We assessed the dissociation kinetics of 10H6 to CEA at pH 5.0 and pH 7.4 using a radioligand assay. Approximately 106 LS174T cells were incubated to equilibrium with 10 nM concentration 10H6 at pH 7.4 and 5.0 in PBS/1% BSA for 90 minutes at 4°C. A concentration of 1 nM 125I-10H6 was spiked into each incubation solution to monitor binding of 10H6 to cells. After incubation, cells were pelleted by centrifugation at 1500g for 5 minutes and washed three times with cold PBS/1% BSA, pH 7.4. Kinetic analyses were conducted by resuspending cells in 1 μM 10H6, pH 7.4 or 5.0. Remaining CEA-bound 125I-10H6 was measured over 4 hours at various time points (5–240 minutes). Binding reactions were quenched by centrifuging cells at 14,000g for 20 seconds and immediately washing three times with PBS/1% BSA, pH 7.4. Samples were then counted for gamma radiation. Monoexponential and biexponential decay equations were used to assess koff at both pH levels.
Animals
Swiss-Webster and C57 BL/6 male mice aged 2 to 3 weeks were purchased from Harlan Laboratories. Athymic nude mice (Crl:NU(NCr)-Foxn1nu) aged 2 to 3 weeks were purchased from Charles Rivers Laboratories (Charles Rivers Laboratories, Wilmington, MA). Male mice were used because of the ease and reliability of intravenous drug administration via the penile vein. Mice were housed in a temperature and humidity-controlled environment with a standard light/dark cycle, where they had access to water and food. All animal protocols complied with the Institutional Animal Care and Use Committee of the State University of New York at Buffalo Animal Facility regulations.
10H6 and T84.66 Plasma Pharmacokinetics in Healthy Swiss-Webster Mice
Two days before dosing, KI (0.2 g/l) was added to the drinking water of all mice to block thyroid uptake of 125I. A dose of 1 mg/kg 10H6 or T84.66 with respective 400 µCi 125I-10H6 or 125I-T84.66 tracer doses were administered by penile vein injection to male Swiss-Webster mice (n = 5/group). For each mouse, 20 μl of blood was serially collected from the retroorbital plexus or the saphenous vein. All samples were centrifuged at 2000g, and plasma was collected. To remove free and catabolite-associated 125I, samples were precipitated by a trichloroacetic acid (TCA) (Sigma Life Sciences) method described earlier (Abuqayyas and Balthasar, 2012b). Briefly, plasma samples (5 μl) were added to 200 μl of 1% v/v BSA and 10% w/v TCA in PBS and allowed to precipitate on ice for 15 minutes. Precipitated samples were then centrifuged at 14,000g for 5 minutes to pellet the precipitate. The supernatant was discarded, and the pellet was then washed three times with PBS. The precipitated samples were then γ-counted to determine the concentration of anti-CEA mAb in plasma.
Quantification of Shed Plasma CEA in MC38CEA+ Tumor-Bearing C57BL/6 Mice
Soluble shed plasma CEA was measured in the MC38CEA+ tumor mouse model to address the potential impact of soluble plasma antigen on anti-CEA mAb pharmacokinetics. Briefly, MC38CEA+ tumors were grown in five male C57BL/6 mice, as described previously. Three mice bearing MC38CEA− tumors were used as negative controls. Terminal plasma samples were collected from each mouse when the tumor size was between 1000 and 2000 mm3 and stored at −20°C until analysis.
Soluble CEA in plasma was measured by a validated ELISA developed previously within the laboratory (Urva et al., 2009). The lower limit of detection for the assay was determined by eq. 2 (Swartz and Krull, 2012):
 (2)
(2)where DL is the detection limit, σ is the S.D. of five blank samples, and S is the slope of the standard curve.
10H6 and T84.66 Plasma Pharmacokinetics in a Mouse Model of Colorectal Cancer
C57BL/6 and athymic nude male mice were injected subcutaneously with MC38CEA− (C57BL/6), MC38CEA+ (C57BL/6), or LS174T (nude mice). Mice were given KI (0.2 g/l) in their drinking water to block nonspecific thyroid uptake of 125I. Pharmacokinetic studies were initialized when the tumor size reached 200−300 mm3. Doses of 0.1, 1, and 10 mg/kg 10H6 or T84.66 (MC38 tumor-bearing animals only) with 400 μCi/kg of 125I-10H6 or 125I -T84.66 were administered intravenously. Blood was serially collected via the retroorbital plexus or saphenous vein. Plasma samples were centrifuged at 2000g, and plasma was collected. Samples were TCA-precipitated as described previously, and γ-counted to determine plasma concentration of 10H6 or T84.66.
Pharmacokinetic Data Analysis
Pharmacokinetic data were analyzed by standard noncompartmental analysis (NCA) in Phoenix WinNonlin 6.1. Individual parameter estimates were stratified by treatment group, and parameter means and variability were calculated. Statistical significance for pharmacokinetic parameters between treatment groups was determined by Student’s two-tailed t test (P ≤ 0.05), with the assumption of equal variance (confirmed by F-test). Statistical difference in NCA parameters with dose and tumor target status (CEA+ or CEA−) was determined by two-way analysis of variance (ANOVA) (P ≤ 0.05).
Western Blot Confirmation of FcRn Expression
Protein Extraction.
Total protein was extracted from MC38CEA+, MC38CEA−, and LS174T cells using RIPA buffer. Briefly, cells were grown in T-75 flasks until approximately 100% confluence. Cells were then detached from the flask using Trypsin-EDTA (ThermoFisher, Grand Island, NY) and collected in conical tubes. Cells were then pelleted and washed three times by resuspending in PBS. After washing, a volume of 1 ml RIPA buffer (ThermoFisher) with protease inhibitor (Sigma-Aldrich) was added to the cell pellets and vortexed to suspend the cells. The suspended cells were incubated at 4°C with constant agitation for 15 minutes. After the incubation, undissolved cellular debris was pelleted by centrifuging at 14,000g for 20 minutes. Supernatant was collected where protein concentration was measured using a Bradford assay (Sigma-Aldrich).
Western Blot.
MC38CEA+, MC38CEA−, and LS174T cell lysate, along with positive and negative control samples, were prepared in PBS and reducing sample buffer (ThermoFisher). Prepared samples were heated in water bath at 95°C for 5 minutes. Heated samples, along with positive and negative control samples, were loaded onto 12% Precise Tris-HEPES gels (ThermoFisher). Loaded samples were separated at 100 V for 45 minutes. SDS-PAGE gels were equilibrated in Western blot transfer buffer (25 mM Tris-/190 mM glycine buffer with 20% methanol) for 5 minutes. Polyvinylidene fluoride membranes were briefly soaked in 100% methanol and then equilibrated in transfer buffer for 5 minutes. Transfer of protein from SDS-PAGE gel to polyvinylidene fluoride membrane was performed at 40 V for 90 minutes. After transfer, the membranes were blocked in TBST (0.1% Tween-20) with 5% milk for 1 hour at room temperature. After blocking, the membrane was probed with 2 μg/ml of goat anti-mFcRn antibody (R&D Systems, Inc, Minneapolis, MN) or 5 μg/ml of 7E9 (inhouse mouse anti-hFcRn antibody) in blocking solution overnight at 4°C. After incubation, the membrane was washed four times with TBST and probed with horseradish peroxidase–conjugated donkey anti-goat IgG antibody at 1:1000 dilution (EMD Millipore, Billerica, MA) or 0.5 μg/ml of horseradish peroxidase–conjugated goat anti-mouse IgG antibody (Millipore) in blocking solution for 1.5 hours at room temperature. After secondary antibody probing, membranes were washed five times with TBST and incubated in SuperSignal West Pico Chemiluminescent Substrate (Thermo Scientific) for 5 minutes. Finally, membranes were analyzed with the use of a ChemiDOC XRS system (Bio-Rad).
Tumor Pharmacokinetics of Anti-CEA mAbs.
We assessed the pharmacokinetics of anti-CEA mAbs 10H6 and T84.66 in MC38CEA+ tumors using liquid chromatography-tandem mass spectrometry (LC-MS/MS). MC38CEA+ xenograft tumors were established as previously described. Because of limitations in limit of quantification (LOQ)/limit of detection of LC-MS/MS, a 0.5-mg/kg dose was selected to elucidate the effects of pH-dependent antigen binding on tumor pharmacokinetics. mAbs were administered intravenously via the penile vein. Terminal sacrificing by cardiac puncture (n = 3 mice per time point) was used to collect blood and tumor samples. Blood samples were centrifuged at 2000g for 10 minutes to separate out plasma and stored at −20°C. Tumor samples were frozen in liquid N2 immediately after harvest and then stored at −80°C until LC-MS/MS analysis.
LC-MS/MS
Tissue Sample Processing.
Frozen tumors were ground into fine powder in the presence of liquid nitrogen using a pestle and mortar. An aliquot of 50.0 mg of tissue powder was suspended in 500 μl of lysis buffer (50 mM Tris, 150 mM NaCl, 0.5% sodium deoxycholate, 2% SDS, 2% NP-40, pH was adjusted to 8.0 by formic acid) and homogenized in an ice bath using a Polytron homogenizer (Kinematica, Lucerne, Switzerland). After sonication for 30 seconds, the homogenates were centrifuged at 20,000g for 30 minutes at 4°C, and the supernatants were isolated for digestion. Plasma and tumor samples were prepared using a previously established and validated method (An et al., 2015).
T-μLC-MS.
An UltiMate 3000 LC system (containing SRD-3400 degasser, NCS-3500RS CAP pumps and a high-flow tertiary gradient pump, and WPS-3000TBRS autosampler with a 250-μl loop) coupled to a TSQ Quantiva triple-quadrupole mass spectrometer (MS) or a Orbitrap Fusion MS (Thermo Fisher Scientific, Santa Clara, CA) was used for selected reaction monitoring (SRM) SRM and high-resolution selected ion monitoring (SIM) SIM analysis, respectively. Sample trapping was conducted on a C8 column (15 × 2.1 mm, 3.5-µm particle size, 100 Å; Agilent, Agilent Technologies, Wilmington, DE) at flow rate of 1 ml/min using the tertiary pump. High-flow loading mobile phase for Atrapping and Btrapping were water:acetonitrile of 98:2 and 5:95 (v/v) containing 1 mM ammonium formate (pH = 9.0, adjusted by ammonium hydroxide). A microflow selector (5–50 µl/min) was used for μLC-MS. The separation column was a Zorbax C18 stable bond column (150 × 0.5 mm, 3.5 μm, 100 Å; Agilent) at a flow rate of 25 μl/min. Low-flow MP Aanalysis and Banalysis for μLC were water:acetonitrile:formic acid of 98:2:0.1 and 5:95:0.1 (v/v/v, pH = 3.0). After MCX SPE enrichment, 10 µl of sample was loaded for analysis. The separation temperature was controlled at 40°C. The Spray voltage was 3.5 kV, vaporizer temperature was 50°C, Sheath gas was 15.0 Arb, Aux gas was 2.0 Arb, and the capillary temperature was maintained at 325°C. Isolation window was set to 0.2 Th for Q1, and 0.7 Th for Q3 on the triple-quadrupole MS for SRM analysis (T84.66). Resolution of 500,000 was used on Orbitrap Fusion for high-resolution SIM analysis (10H6, CEA). Experimentally selected signature peptides were quantified for the targets: 1) 10H6: SGAGSLVHSDGNTYLEWYLQKPGQSPK and SLEWLGYLSCYNQTSYNQK and 2) T84.66: ASNLESGIPVR and QRPEQGLEWIGR.
Calibration and Validation.
Standard proteins were spiked into pooled blank matrices to prepare calibration curves. The standard calibrator samples were diluted with blank matrix to a range of concentrations. Hybrid calibration strategy was used in this study as specified previously (Nouri-Nigjeh et al., 2014). SIL-peptide I.S. was spiked after digestion of the calibration samples. Calibration curves were established by plotting extracted ion current peak area ratio of the analyte/I.S. as a function of analyte concentration. For the quantification of the target proteins in biologic samples, weighted least-squares linear regression analysis of the standard curves was used. For validation, a batch of quality control (QC) samples were prepared containing low, medium, and high concentrations of target protein in biomatrices, and this sample set was compared with independently prepared calibration standards. Precision of the assay was calculated by repeated analysis of spiked QC samples, and CV% of the replicate measurements was calculated to determine variability. Quantitative accuracies of the QC samples at each concentration level were calculated against nominated concentrations.
Results
Anti-CEA mAb Development and Characterization.
The mouse producing the highest signal from the antigen capture ELISA was selected for fusion. After a period of 10 days, hybridoma colonies were readily visible in ∼75% of the wells. The process of identifying anti-CEA IgG pooled cell culture media (eight wells/pool) and subsequently testing the individual wells of pooled media that returned ELISA signals of greater than three times baseline led to the identification of seven anti-CEA IgG producing hybridoma cell lines (data not shown). The method of single-cell picks was performed in two successive cycles to produce monoclonal hybridoma cell lines.
To test for pH-dependent target binding, the antigen capture ELISA was applied to filtered cell culture media containing anti-CEA antibodies (Fig. 1A). Except for 10H6, the panel of anti-CEA antibodies did not exhibit a dramatic decrease in ELISA signal with acidification of media. For 10H6, the assay signal at pH 5.5 was 5% of the signal observed at pH 7.0. To confirm that the pH-dependent binding phenomenon was reversible within this assay, a portion of acidified media was adjusted to pH 7.0, and the assay was repeated (Fig. 1B). No statistically significant difference was found between pH 7.0 media, and media incubated at pH 5.5 that was neutralized (P = 0.15, Student’s two tailed t test). With characterization at more pH values, we found a monotonic decline in signal with pH, where the assay response was decreased by ∼50% at 6.0 and by ∼90% at pH 5.0 (Fig. 1C).

Analysis of pH-dependent binding of anti-CEA antibodies by using an antigen capture ELISA. (A) Assay response (dA/dt) at pH 7.0 and pH 5.5 for a panel of anti-CEA antibodies. 10H6 shows a dramatic reduction in equilibrium binding at pH 5.5 relative to pH 7.0. (B) Reversibility of binding within this assay was demonstrated by assaying pH 5.5 10H6 media that was neutralized back to pH 7.0 (10H6, pH 7.0*). Assay measurements of pH 7.0 10H6 and neutralized pH 7.0 media suggested no statistical difference in signal. (C) 10H6 anti-CEA antibody tested over a range of pH demonstrated pH-sensitive binding. Data points represent the mean of three ELISA measurements; error bars denote the standard deviation of the mean.
Further characterization of pH-dependent properties of anti-CEA mAbs was completed using a competitive ELISA. Binding of CEA by anti-CEA mAb was competed with by the respective AP-mAb conjugate. Owing to sensitivity issues at low pH, binding of anti-CEA mAbs was evaluated at pH 7.4 and pH 6.0. For 10H6, model fitting of data with an inhibition function resulted in an equilibrium dissociation constant at pH 7.4 of 12.57 ± 1.682 and 144.6 ± 21.79 nM at pH 6.0. For T84.66, equilibrium dissociation constants at pH 7.4 and 6.0 were 1.095 ± 0.1103 and 1.363 ± 0.1584 nM, respectively (Fig. 2). A pH-dependent difference was found between the equilibrium dissociation constant for 10H6 (P = 0.0005), but not for T84.66 (P = 0.074). Between group statistical analysis, evaluated with one-way ANOVA, determined statistical significance between 10H6 and T84.66 at pH 6.0 (P < 0.0001) and no statistical difference at pH 7.4 (P = 0.7336). The resulting KD ratio between pH 6.0 and 7.4 for 10H6 is 11.5. This ratio is consistent with previously constructed pH-dependent antibodies in literature (Igawa et al., 2010; Chaparro-Riggers et al., 2012).

Analysis of pH-dependent binding of anti-CEA antibodies by using competitive ELISA. The left panel displays responses of unlabeled 10H6 competing with AP-conjugated 10H6 at pH 7.4 and 6.0. The right panel displays the responses for T84.66 at both described pH levels. Data were fit using an inhibition model to determine equilibrium binding dissociation constants.
Results from flow cytometry experiments indicated that 10H6 binds cellular CEA in a solvent accessible region in two cell lines (Fig. 3). Experiments with MC38CEA− cells (isotype control, secondary antibody only, positive control T84.66, and 10H6) show no visual shift in the mean fluorescence intensity (MFI) histogram and no substantial change in the geometric mean of the MFI. The CEA-expressing cell lines MC38CEA+ and LS174T both exhibited a near baseline shift in MFI for T84.66 and 10H6 relative to controls. For MC38CEA+, there was a 13.3- and 19.6-fold increase in MFI geometric mean relative to isotype control for T84.66 and 10H6. In LS174T cells, there was a measured 123- and 243-fold increase in geometric mean for T84.66 and 10H6, respectively.

Measurement of T84.66 and 10H6 binding to MC38CEA− (gray), MC38CEA+ (blue), and LS174T (red) by flow cytometry. MC38CEA− has no detectable shift in the distribution of mean fluorescence intensity for either T84.66 or 10H6 compared with controls, indicating no detectable binding of the anti-CEA antibodies to the antigen-free cell line. The CEA-expressing cell lines MC38CEA+ and LS174T both show large shift in the distribution to higher mean fluorescence intensity relative to controls, indicating specific binding of antibody to antigen in the cell-based system.
Cellular binding constants were elucidated using a radioligand binding assay with LS174T cells at physiologic and acidic pH. Radiolabled 10H6 was spiked into solution containing unlabeled concentrations of 10H6 and ∼106 LS174T cells. After incubation to equilibrium at pH 7.4, kinetic dissociation rate constants (koff) were evaluated by resuspending LS174T cells in pH 7.4 or 5.0 buffer containing 1.0 μM unlabeled 10H6. Bound 125I-10H6 was measured over time after resuspension. Values for koff were determined by fitting decay equations to percent bound over time data. The koff values at pH 7.4 and pH 5.0 were 0.01331 ± 0.001909 minute−1 and 0.8729 ± 0.1970 minute−1, respectively (Fig. 4). As shown in Fig. 4, nearly 100% of 10H6 dissociated from the membrane of LS174T cells after 5-minute incubation in pH 5.0 buffer. The observed koff values correspond to dissociation half-lives of 60.1 and 0.79 minutes at pH 7.4 and 5.0, respectively.

Evaluation of 10H6 dissociation kinetics from membrane-bound CEA on LS174T cells at physiologic pH (7.4, circles) and endosomal pH (5.0, squares). Data were fit using monoexponential and biexponential decay kinetics for pH 7.4 and 5.0 data, respectively. The dissociation rate constant (koff) for pH 5.0 is expressed as the α-phase rate.
Pharmacokinetics of T84.66 and 10H6 in Swiss-Webster Mice.
To assess the suitability of T84.66 as an IgG1κ control in pharmacokinetic studies, the plasma pharmacokinetics of T84.66 and 10H6 were measured in male Swiss-Webster mice after a single 1-mg/kg dose. The plasma pharmacokinetics of T84.66 and 10H6 are shown in Fig. 5. Both mAbs exhibit biexponential pharmacokinetics, with a clearance of 8–8.5 ml/day per kilogram (Table 1). No statistical difference (Student’s unpaired t test) was seen in the mean plasma clearance (P = 0.62); however, the 10H6 calculated mean volume of distribution at steady state (Vss) was significantly greater than the mean Vss found for T84.66 (P = 0.042).

Pharmacokinetics of T84.66 and 10H6 after an i.v. 1 mg/kg dose in healthy male Swiss-Webster mice. Data points represent the mean plasma concentration (n = 4 to 5), and error bars denote the standard deviation of the mean.
Noncompartmental analysis (NCA)–derived pharmacokinetic parameters for T84.66 or 10H6 after an intravenous dose in mouse models
VSS is NCA-determined volume of distribution at steady state. It is recognized that this value is not appropriately determined at dose-levels associated with non-linear pharmacokinetics. CL refers to the time-averaged systemic clearance, determined as dose/AUC.
Pharmacokinetics of T84.66 and 10H6 in MC38CEA+ and MC38CEA− Tumor-Bearing C57BL/6 Mice.
The plasma pharmacokinetics of anti-CEA mAbs 10H6 and T84.66 were assessed in male C57BL/6 mice bearing MC38CEA+ and MC38CEA− tumors after i.v. bolus doses of 0.1, 1, or 10 mg/kg. Fig. 6, A and B, shows the plasma pharmacokinetic profiles for T84.66 and 10H6 in tumor-bearing mice, with dose-normalized data shown in Fig. 6, C and D. T84.66 and 10H6 display biexponential pharmacokinetics in MC38CEA− tumor-bearing mice. Two-way ANOVA grouped by anti-CEA mAb and dose provides no evidence of statistical differences in plasma clearance or VSS in the MC38CEA− mouse model (Fig. 7). In MC38CEA+ mice, all dose levels of 10H6 visually overlay the corresponding dose in MC38CEA− control mice, with similar biexponential pharmacokinetics. In contrast, the data for T84.66 show clear dose-dependencies in pharmacokinetics in mice bearing MC38CEA+ tumors. Inspection of the dose-normalized T84.66 data (Fig. 6C) shows a decreased terminal half-life for the 0.1 and 1 mg/kg doses in mice with MC38CEA+ tumors and a decreased relative exposure compared with dose-matched MC38CEA− controls. The pharmacokinetic parameters for each group were estimated by noncompartmental analysis (Table 1). No statistical difference was found by two-way ANOVA in 10H6 plasma clearance or VSS in MC38CEA+ or MC38CEA− tumor bearing mice, at each dose level, suggesting that the presence of target (i.e., CEA) does not substantially affect the pharmacokinetics for this anti-CEA CAR mAb (Fig. 7, B and D). Conversely, statistical analysis of T84.66 plasma pharmacokinetics revealed significant differences for plasma clearance and VSS for comparisons by tumor type and by dose (two-way ANOVA, P ≤ 0.05) (Fig. 7, A and C). Although the 1 mg/kg T84.66 dose in MC38CEA+ mice shows a terminal half-life that is 2-fold less than the dose-matched control (in MC38CEA− mice), and there appears to be visual evidence of a trend toward nonlinear pharmacokinetics (Fig. 6C), the plasma clearance was not statistically different between the two groups (Student’s t test, P = 0.095). At the lowest dose level (0.1 mg/kg), T84.66 pharmacokinetics exhibited clear nonlinearity in MC38CEA+-bearing mice (Fig. 6C). Statistical comparisons for T84.66 at the 0.1 mg/kg dose in MC38CEA− and MC38CEA+ mice demonstrated significant differences for plasma clearance (P = 0.012) and VSS (P = 0.001), indicating that the presence of target influences the pharmacokinetics of T84.66 at this dose (Fig. 7, A and C).
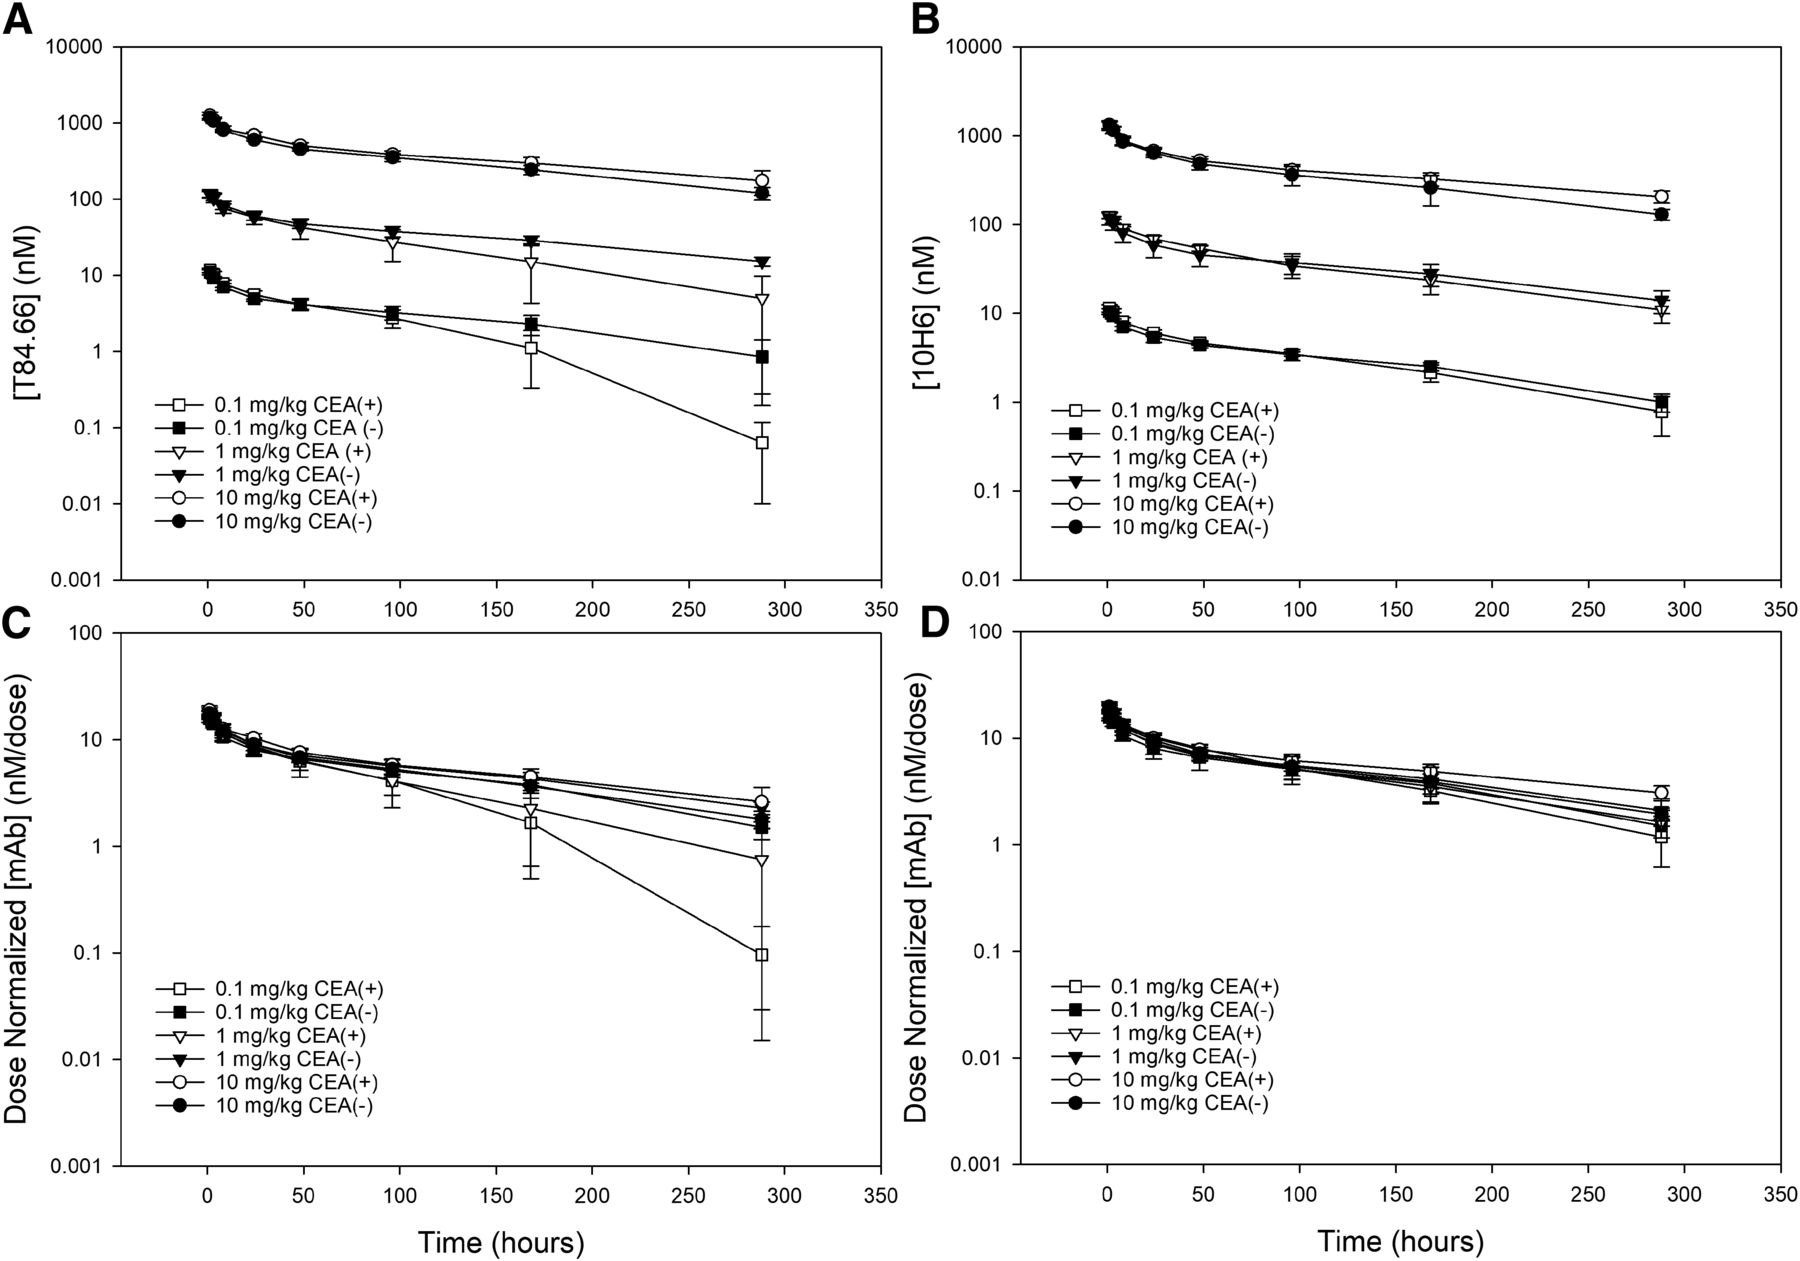
Pharmacokinetics of (A) T84.66 and (B) 10H6 after an i.v. 0.1 (square), 1 (triangle), or 10 mg/kg (circle) dose in C57 BL/6 male mice bearing MC38CEA− (closed symbols) or MC38CEA+ (open symbols) tumors. Dose normalization of (C) T84.66 and (D) 10H6 data suggests an increased elimination rate for T84.66 at 0.1 and 1 mg/kg doses in CEA-bearing mice. Data points represent the mean plasma concentration (n = 4 to 5), and error bars denote the standard deviation of the mean.

NCA-derived plasma clearance (CL), steady-state volume of distribution (VSS), and dose-normalized exposure (AUClast) in mice dosed with 0.1, 1, or 10 mg/kg of T84.66 (black bars) or 10H6 (gray bars). (A) T84.66 plasma CL was significantly increased (P ≤ 0.05, Student’s unpaired t test) in mice with CEA+ tumors, relative to control at the 0.1 mg/kg dose level. (B) 10H6 plasma CL was not significantly different in the dose range tested. (C) T84.66 VSS increased significantly in mice with CEA+ tumors relative to control. (D) 10H6 VSS had no significant difference in the dose range tested. AUClast was not statistically different any of the measured doses for (E) T84.66 or (F) 10H6. Bars represent the parameter mean (n = 4 to 5), and error bars denote the standard deviation of the mean.
To assess the possibility of shed soluble CEA in plasma in mice bearing large MC38CEA+ tumors, terminal plasma samples were taken from tumor-bearing mice, where soluble CEA concentrations were quantified via ELISA. All samples tested in either control or tumor-bearing mice exhibited plasma CEA concentrations below the calculated lower limit of detection (3.8 ng/ml or 0.021 nM).
Pharmacokinetics of 10H6 in LS174T Xenograft Athymic Nude Mice.
To assess the influence of FcRn on 10H6 pharmacokinetics, a human-derived tumor cell line (LS174T) that expresses hCEA, but lacks expression of mFcRn, was used to establish a xenograft tumor model. 10H6 plasma concentrations were analyzed in athymic nude mice bearing LS174T tumors after an i.v. dose of 0.1, 1.0, and 10 mg/kg. Figure 8A shows the plasma concentration-time profiles for 10H6 in LS174T tumor-bearing mice, with dose-normalized data shown in Fig. 8B. 10H6 terminal phases of 1.0 and 10 mg/kg exhibited apparent similarity, but the 0.1 mg/kg dose demonstrated a rapid increase in the terminal-phase slope, indicating an increased elimination rate. Upon dose normalization of plasma concentrations, there is a clear discrepancy between the 0.1 mg/kg dose group and the two higher doses, consistent with target-mediated elimination. Pharmacokinetic parameters were calculated using noncompartmental analysis. Plasma clearances at each dose were assessed based on the pharmacokinetic equation CL = Dose/AUCinf. The resulting time-averaged plasma CL for 10H6 in athymic nude mice bearing LS174T tumors at 0.1-, 1.0-, and 10-mg/kg doses are displayed in Table 1. Statistical analysis determined no significant difference between 1.0 and 10 mg/kg (P = 0.298). In contrast, the plasma clearance of the 0.1 mg/kg dose group was statistically significant from 1 to 10 mg/kg dose groups (P = 0.004 and P = 0.003). These results are consistent with target-mediated elimination of antibody.

(A) Pharmacokinetics of 10H6 after an i.v. dose of 0.1 (square), 1 (triangle), or 10 mg/kg (circle) in athymic nude male mice bearing LS174T tumors. (B) Dose normalization of 10H6 data suggests an increased elimination rate at 0.1 mg/kg dose in LS174T tumor–bearing mice. Data points represent the mean plasma concentration (n = 3), and error bars denote the standard deviation of the mean.
Tumor Pharmacokinetics of Anti-CEA mAbs.
Comparing 10H6 plasma clearances with the pH-independent antibody, T84.66, in the presence of CEA and mFcRn in MC38CEA+ tumors, 10H6 and T84.66 have statistically different plasma clearances at low doses (0.1 mg/kg, P = 0.016), where target-mediated effects are most prominent. By minimizing target-mediated elimination, we hypothesized that 10H6 would exhibit greater tumor exposure (as well as increased plasma exposure). To examine this hypothesis, tumor pharmacokinetics of the two anti-CEA mAbs, with and without CAR properties, were evaluated in C57BL/6 male mice bearing MC38CEA+ tumors, with analysis via LC-MS/MS. Plasma concentration versus time profiles for T84.66 and 10H6 (Fig. 9A) were consistent with prior work, where T84.66 exhibits a greater terminal-phase slope than 10H6 in MC38CEA+ tumor-bearing mice. The plasma AUC0–t values for T84.66 and 10H6 were 69.32 ± 7.810 and 166.4 ± 6.685 nM · day, respectively. Estimates for plasma CL were obtained from the equation Dose/AUC0–t. Clearance values were calculated as 48.09 ± 5.42 and 20.04 ± 0.81 ml/day per kilogram for T84.66 and 10H6. Applying the modified Bailer-Satterthwaite method (Nedelman et al., 1995), confidence intervals for AUC determined a significant difference, P < 0.05. Plasma CL was also deemed significantly different after statistical analysis using propagation of error method (Motulsky, 1995). These data suggest that 10H6 exhibits a greater plasma exposure than T84.66 in an MC38CEA+ xenograft mouse model owing to the slower clearance from systemic circulation.

(A) Plasma and (B) MC38CEA+ tumor pharmacokinetics of T84.66 (○) and 10H6 (□) after a 0.5-mg/kg i.v. dose. Horizontal lines represent lower limits of quantification of the LC-MS/MS method. For plasma, LOQs for 10H6 and T84.66 were 0.02 (0.13 nM) and 0.005 μg/ml (0.033 nM). For tumor, LOQs for 10H6 and T84.66 were 0.2 (1.3 nM) and 0.05 μg/ml (0.33 nM).
MC38CEA+ tumor concentration-time profiles of T84.66 and 10H6 are shown in Fig. 9B. Data analysis was carried out using the same methods as for the plasma pharmacokinetics. Tumor tissue AUC0–t for T84.66 was 75.69 ± 5.060 and 98.35 ± 6.510 nM · day for 10H6. Comparison of T84.66 and 10H6 tumor AUC, through application of the modified Bailer-Satterthwaite method, showed that 10H6 tumor exposure was statistically different from (i.e., greater than) T84.66 tumor exposure (P < 0.05), supporting the hypothesis that CAR pH-dependent binding improves tumor exposure for anti-CEA mAb.
Western Blot Confirmation of FcRn Expression.
A previously validated Western blot for mouse and human FcRn was used to identify the expression of FcRn within tumor cell lines used in these studies. Detection of mFcRn in MC38 tumor cells was accomplished using a commercialized anti-mFcRn antibody. The commercial antibody was successful in identifying recombinant FcRn (MW = 35 kDa) as well as FcRn expressed within liver tissue samples of male Swiss-Webster mice (Fig. 10A). No hFcRn was detected from recombinant expressed product or from hFcRn transgenic mice liver tissue samples using this antibody (data not shown). MC38CEA+ cell lysates were probed with anti-mFcRn revealed a band at approximately 53 kDa (Fig. 10A, Lane 4), whereas a band at this molecular weight was absent in MC38CEA− cell lysate. This band was consistent with mFcRn expressed within wild-type mouse liver tissue samples, indicating MC38CEA+ tumor cells express mFcRn. Detection of hFcRn in LS174T cells was accomplished using an in-house anti-hFcRn antibody, 7E9. This antibody was successful in identifying positive controls of recombinant hFcRn and hFcRn from transgenic mice liver tissue (Fig. 10B). LS174T cell lysate was probed with 7E9 revealed a band at approximately 47 kDa, consistent with hFcRn molecular weight. These data demonstrate that MC38 cells express mFcRn, but not hFcRn, and that LS174T cells express hFcRn, but not mFcRn (as expected based on their species of origin).

Western blot analysis for (A) mFcRn and (B) hFcRn in tumor cell lines. (A) Lane 1: Molecular weight ladder. Lane 2: Positive control (23 fmol of recombinant mFcRn protein). Lane 3: Negative control (220 fmol recombinant hFcRn protein). Lane 4: 20 μg of extracted protein from MC38CEA+ cells. Lane 5: 20 μg of extracted protein from MC38CEA− cells. Lane 6: Positive control (2.5 μg of extracted protein from Swiss-Webster mouse liver tissue). Lane 7: Negative control (18 μg of extracted protein from hFcRn transgenic mouse liver tissue). (B) Lane 1: Molecular weight ladder. Lane 2: Positive control (220 fmol recombinant hFcRn protein). Lane 3: Negative control (23 fmol of recombinant mFcRn protein). Lane 4: 5 μg of extracted protein from LS174T cells. Lane 5: Positive control (18 μg of extracted protein from hFcRn transgenic mouse liver tissue). Lane 6: Negative control (2.5 μg of extracted protein from Swiss-Webster mouse liver tissue).
Discussion
CAR mAbs are a promising new subclass of antibody drugs that have been shown to exhibit decreased target-mediated elimination relative to “standard” mAbs (where target binding is relatively stable within the pH range of 5.5–7.4). This study details the development and evaluation of the first reported CAR mAb (10H6) with affinity for a cancer-associated antigen. We found that 10H6 exhibits linear pharmacokinetics in a mouse tumor model of colorectal cancer, whereas a standard anti-CEA mAb (T84.66) demonstrates dose-dependent, nonlinear pharmacokinetics in the same animal model.
A Swiss-Webster mouse model, absent of target, was used for initial assessment of the pharmacokinetics of T84.66 and 10H6. Although the CAR mAb (10H6) and control standard binding mAb (T84.66) are of the same isotype (IgG1κ), additional factors may influence the rate of mAb catabolism in a target free system. For example, FcRn binding (Wani et al., 2006; Datta-Mannan et al., 2007; Yeung et al., 2009), glycosylation (Goetze et al., 2011), immunogenicity (Kuus-Reichel et al., 1994), and charge (Boswell et al., 2010; Schoch et al., 2015) have all been demonstrated to contribute to the pharmacokinetics of mAbs in target-free systems. Here, we found no significant differences in the plasma clearance of 10H6 and T84.66 in healthy male mice. Further, in MC38CEA− tumor-bearing mice, which also lack expression of CEA, there was no significant difference in the plasma clearance of 10H6 and T84.66.
To evaluate properly the pharmacokinetic benefits of CAR binding to CEA, it was necessary to select a model with expression of the target on cells that are capable of FcRn-mediated mAb binding and transport. 10H6, a murine IgG1 mAb, is not expected to bind to human FcRn (Ober et al., 2001). As such, commonly used human tumor lines that express CEAs (e.g., LS174T, HT29) were not suitable to evaluate the beneficial effect of CAR mAbs. Consequently, we selected the MC38CEA+ cell line for use in our initial investigations; this cell line is of murine origin and expresses murine FcRn with affinity for murine IgG (including T84.66 and 10H6) based on Western blot analysis. MC38CEA+ cells have been transfected to express our target of interest (human CEA), and internalization of anti-CEA mAbs by the MC38CEA+ cell line has been previously verified (Orava et al., 2010). The expression level of CEA in MC38CEA+ tumors has been estimated at ∼50 nM (Robbins et al., 1991).
T84.66, which binds to CEA with similar activity at pH 5.5 and at pH 7.4. (Fig. 1A and Fig. 2), has been shown in prior work to exhibit nonlinear, target-mediated disposition in mouse xenograft models (Urva and Balthasar, 2010; Urva et al., 2010; Abuqayyas and Balthasar, 2012a). In athymic male mice bearing LS174T xenografts, T84.66 dosed at 1, 10, and 25 mg/kg shows a dose-dependent decrease in plasma clearance and an increase in dose-normalized exposure with increasing dose (Urva and Balthasar, 2010; Abuqayyas and Balthasar, 2012a). In mice with HT29 xenografts, we studied T84.66 plasma pharmacokinetics at doses ranging from 0.025 to 25 mg/kg. Again, nonlinear pharmacokinetics were observed, with rapid clearance at 0.025 and 0.1 mg/kg, and with slower elimination and dose-proportional pharmacokinetics over the dose range of 1–25 mg/kg (Abuqayyas and Balthasar, 2012a). The observation of nonlinear pharmacokinetics at higher dose levels in the LS174T mouse model may be explained, in part, by CEA target expression. The LS174T cell line has a 10- and 20-fold greater measured CEA protein expression than HT29 and MC38CEA+ cells (Shi et al., 1983). Other factors that play a role in the extent of target-mediated elimination include antigen-mAb turnover rate, leakiness of the tumor vasculature, and tumor blood flow rates. Here, we evaluated the effect of FcRn recycling on the pharmacokinetics of anti-CEA mAbs. As demonstrated using Western blot, mice bearing MC38CEA+ tumors express mFcRn, resulting in linear pharmacokinetics of 10H6 and nonlinear pharmacokinetics of T84.66. On the other hand, in a mouse model system where tumors lack expression of mFcRn (e.g., LS174T tumors), both antibodies would be expected to exhibit target-mediated elimination. As shown in this and prior work in our laboratory, 10H6 and T84.66 both demonstrate target-mediated elimination in mice bearing LS174T tumors, presumably owing to the internalization of mAb-CEA complexes and the lack of mFcRn-mediated rescue from intracellular catabolism. These studies, combined with our cellular binding assays, support our hypothesis that linear pharmacokinetics observed within MC38CEA+ mice can be attributed to pH-dependent release of CEA by 10H6, association with mFcRn, and recycling out of the cell.
Shed antigen in plasma has often been associated with increased mAb elimination and decreased mAb exposure. For example, 64% of patients with HER2+ breast cancer exhibited elevated levels of antigen (extracellular domain of HER2) in plasma (Treish et al., 2000). These patients were more likely to have decreased trough concentrations of trastuzumab relative to patients with no detectable shed antigen in plasma (Treish et al., 2000). CEA is well recognized as a shed antigen, and plasma CEA concentrations are used clinically as a diagnostic marker (Goldstein and Mitchell, 2005). Recognizing that shed CEA may be an important contributing factor in the plasma pharmacokinetics of anti-CEA mAbs, the determination of shed antigen concentration in model animal systems is of interest. In previous work with the LS174T xenograft mouse model, with mice bearing tumors up to ∼2000 mm3, the plasma concentrations of CEA were below the limit of quantification (<2 ng/ml) (Urva et al., 2009). Consistent with these findings, none of the C57BL/6 mice bearing subcutaneous MC38CEA+ tumors (1000–2000 mm3) had detectable (>3.8 ng/ml) levels of soluble plasma CEA (data not shown). The lower limit of detection of CEA in our assay was more than 3-fold lower than the lowest (molar) mean concentration measured for either T84.66 or 10H6, suggesting that soluble CEA was unlikely to have a substantial effect on the plasma pharmacokinetics of anti-CEA mAbs in this study. In human colorectal cancer, plasma concentrations of CEA increase with disease progression (i.e., increasing from an average of <1 ng/ml in Duke stage A disease to an average of 72 ng/ml [∼1 nM] in Duke stage D disease (Wanebo et al., 1978; Bombski et al., 2002)). In comparison, based on expectations for typical mAb pharmacokinetics in humans, the plasma concentrations of an anti-CEA CAR mAb, after an i.v. dose of 0.1 mg/kg, may be expected to exceed 15 nM for >2 weeks. Considering the relative concentrations of antibody and soluble antigen, it is unlikely that soluble CEA would be an important determinant of the pharmacokinetics of CAR anti-CEA mAb in most cancer patients. Nonetheless, the effects of soluble CEA on the pharmacokinetics of anti-CEA CAR mAb in patients may merit future clinical evaluation.
In contrast to the standard binding mAb T84.66, this work demonstrates no significant differences, as a function of dose, in NCA-derived pharmacokinetic parameters for 10H6 in mice bearing MC38CEA− or MC38CEA+ tumors. Previously, CAR mAbs directed against PCSK9 (Chaparro-Riggers et al., 2012) or IL-6R (Igawa et al., 2010) demonstrated reduced target-mediated elimination (relative to their respective “standard binding” parent antibodies). Unlike the highly accessible PCSK9 and IL-6R antigens, the cancer-associated membrane target CEA is found within the relatively inaccessible interstitium of solid tumors. To access target, the CAR mAb must extravasate the tumor vasculature into the tumor interstitium, distribute to the target site, and finally bind the target (Schmidt et al., 2008). Solid tumors often have high internal pressure, poor vascularization, and an abnormally dense extracellular matrix, limiting the ability of mAbs to both penetrate and exit the tumor (Jain, 2001). To escape target-mediated elimination, a CAR mAb must not only escape intracellular lysosomal catabolism, it must also escape the target site. As the accessibility of the target site decreases, it is likely that the effect of pH-dependent target release on target-mediated elimination will also decrease, giving rise to greater exposure in plasma and tumor. To further support for this hypothesis, plasma and tumor pharmacokinetics by LC-MS/MS demonstrated that pH-dependent binding of 10H6 resulted in greater plasma and tumor exposure (i.e., AUC) than pH-independent T84.66. It is interesting to note that the data showed a larger difference between 10H6 and T84.66 in plasma versus tumor exposure (i.e., AUCplasma,10H6/AUCplasma,T84.66 > AUCtumor,10H6/AUCtumor,T84.66). Although this difference has not yet been thoroughly explored, we speculate that this finding reflects differences between 10H6 and T84.66 with respect to relationships between tumor binding and the efficiency of target-mediated elimination. For example, in the condition where tumor mAb concentrations exceed the KD for CEA binding, tumor concentrations may be expected to approach a plateau (i.e., where cell-surface CEA is nearly saturated with 10H6 or T84.66). Owing to the benefit of CAR binding within tumor endosomes, however, the tumor-associated target-mediated elimination of 10H6 would be expected to be less efficient than that of T84.66. Given the significance of target-mediated elimination of anti-CEA mAb in this model, the reduced efficiency of 10H6 tumor-associated clearance, relative to T84.66, would explain the observed differences in plasma exposure. Importantly, the magnitude of therapeutic benefit of CAR binding of antitumor mAb may be expected to be dependent on dose and on the pharmacodynamics associated with antitumor effects. Given the saturable nature of tumor binding and tumor-associated antibody elimination, we speculate that CAR binding will provide the greatest benefit for mAb therapies that act by mechanisms where anticancer activity is achieved at low levels of target occupancy (e.g., antibody-drug conjugates, antibodies acting by antibody-dependent cell cytotoxicity).
Here, a new anti-CEA monoclonal antibody, 10H6, has been developed and characterized. This antibody demonstrates pH-dependent binding, consistent with CAR activity, with a dramatic decrease in CEA-binding as pH is reduced from 7.4 to 5.0. 10H6 bound to extracellular domains of CEA on LS174T and MC38CEA+ tumor cells. Investigations of 10H6 pharmacokinetics revealed linear, biexponential disposition kinetics in mice bearing no tumor and in mice bearing CEA- and CEA+ tumors. In contrast, T84.66, a monoclonal antibody of the same isotype as 10H6 (IgG1k), but with pH-independent CEA binding, demonstrates nonlinear pharmacokinetics in mice bearing MC38CEA+ tumors. Furthermore, in a human-derived LS174T tumor model, both antibodies exhibit nonlinear pharmacokinetics (consistent with a lack recycling of murine IgG by hFcRn). Collectively, the data are consistent with the hypothesis that CAR mAbs offer unique pharmacokinetic advantages over traditional therapeutic antibodies. Clinical application of this strategy will require the development of CAR mAbs with human or humanized Fc domains that enable binding to human FcRn. Humanized versions of 10H6 may find utility in the treatment of CEA+ tumors, with improved disposition and exposure relative to anti-CEA mAbs that exhibit pH-independent binding; however, it is clear that the therapeutic impact of the observed pharmacokinetic advantages of CAR mAb will be dependent on multiple determinants of mAb efficacy, including the mechanisms and concentration dependencies associated with mAb pharmacodynamics. Further investigation of the pharmacokinetics and pharmacodynamics of anticancer CAR mAb and conjugates appears to be warranted.
Authorship Contributions
Participated in research design: Engler, Polli, Li, An, Qu, Otteneder, Balthasar.
Conducted experiments: Engler, Polli, Li, An.
Contributed new reagents or analytic tools: Engler, Polli, Li, An, Qu, Balthasar.
Performed data analysis: Engler, Polli, Li, Balthasar.
Wrote or contributed to the writing of the manuscript: Engler, Polli, Li, An, Qu, Balthasar.
Footnotes
- Received December 2, 2017.
- Accepted May 1, 2018.
This work was funded by the National Institutes of Health/National Cancer Institute [Grant 1R01CA204192] and by F. Hoffmann-La Roche Ltd.
Abbreviations
- ANOVA
- analysis of variance
- AP
- alkaline phosphatase
- BSA
- bovine serum albumin
- CAR
- catch-and-release
- CEA
- carcinoembryonic antigen
- CL
- clearance
- ELISA
- enzyme-linked immunosorbent assay
- FcRn
- neonatal Fc receptor
- IL2R
- interleukin-2 receptor
- KD
- equilibrium binding dissociation constant
- LC-MS/MS
- liquid chromatography-tandem mass spectrometry
- LOQ
- limit of quantification
- mAb
- monoclonal antibody
- MFI
- mean fluorescence intensity
- NCA
- noncompartmental analysis
- PBS
- phosphate-buffered saline
- PNPP
- p-nitro phenyl phosphate
- QC
- quality control
- TCA
- trichloroacetic acid
- Vss
- volume of distribution at steady-state
- Copyright © 2018 by The American Society for Pharmacology and Experimental Therapeutics


