


Article Figures & Data
Figures
- Fig. 1.
Rat breathing response to increasing bolus dose of intravenous TRH. Normalized minute ventilation in orotracheally intubated rats, spontaneously breathing 1.5% isoflurane in air before and after intravenous TRH bolus (down arrow). Data were normalized to the averaged 15 minutes of baseline breathing prior to TRH administration. Each data point is the average of four animals, using 1 minute of averaged data from each animal (n = 4 ± S.E.M.). Asterisks (*, **, and ***) indicate statistical significance (P < 0.05, P < 0.01, and P < 0.001, respectively; one-way analysis of variance with Dunnett’s post-test) relative to the data point just prior to TRH administration. Dotted red line indicates the 100% level for reference only. In (A–D) baseline minute ventilation was 23 ± 0.4 ml/min per 100 gram (n = 16 ± S.E.M.).
- Fig. 2.
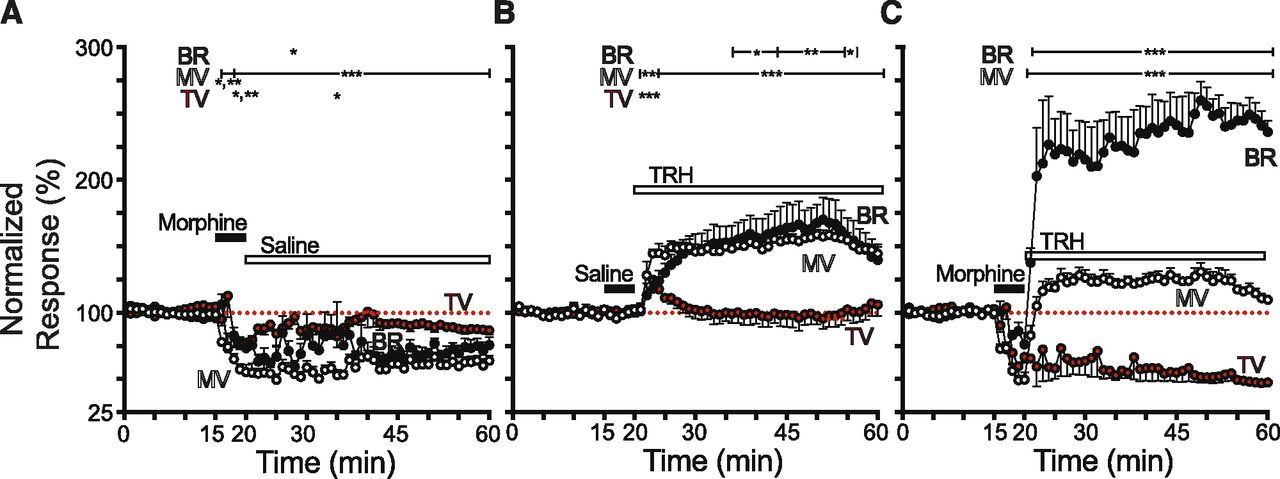
Intravenous TRH reverses morphine-induced respiratory depression. Normalized minute ventilation [(MV); white circles], breathing rate [(BR); black circles], and tidal volume [(TV); red circles] in orotracheally intubated rats, spontaneously breathing 1.5% isoflurane in air before and after intravenous morphine administration [(A and C); 5 mg/kg over 5 minutes; black bar] or saline [(B); control; black bar], followed by intravenous TRH [(B and C); 1 mg/kg bolus followed by 5 mg/kg/h infusion; white bar] or saline [(A); control; white bar]. Data were normalized as in Fig. 1. Each data point is the average of four to five animals, using 1 minute of averaged data from each animal (n = 4 to 5 ± S.E.M.). Asterisks (*, **, and ***) indicate statistical significance (P < 0.05, P < 0.01, and P < 0.001, respectively; one-way analysis of variance with Dunnett’s post-test) relative to the data point just prior to morphine in (A) and TRH in (B and C). In (A–C) baseline MV, BR, and TV were 30 ± 2 ml/min per 100 gram, 70 ± 1 minute−1, and 0.4 ± 0.03 ml per 100 g, respectively (n = 13 ± S.E.M.).
- Fig. 3.
Effect of intravenous morphine, TRH, and taltirelin on changes in arterial blood pH, gas, and lactate levels. Data are from the same experiment/animals represented in Figs. 2 and 4 and depict the change (Δ) in arterial blood pH, carbon dioxide, oxygen, and lactate levels (A–D) from baseline at 15 and 30 minutes (15′ and 30′) after first administration of TRH, taltirelin, or saline (control). Data are shown for saline followed by TRH (gray bars; see Fig. 2B), morphine followed by saline (black bars; see Fig. 2A), morphine followed by TRH (white bars; see Fig. 2C), and morphine followed by taltirelin (blue bars; see Fig. 4B). Each column represents the average change in blood gas values from n = 3–5 animals ± S.E.M. Asterisks (*, **, and ***) indicate statistical significance (P < 0.05, P < 0.01, and P < 0.001, respectively; ns denotes not statistically significant; one-way analysis of variance with a Sidak’s post-test) relative to animals treated with morphine only (black bars). Baseline blood gas values were pH, 7.40 ± 0.01; PaO2, 70 ± 3 mm Hg; PaCO2, 45 ± 1 mm Hg; and lactate, 1 ± 0.1 mM (n = 18 ± S.E.M.).
- Fig. 4.
Intravenous taltirelin reverses morphine-induced respiratory depression. Normalized minute ventilation [(MV); white circles], breathing rate [(BR); black circles], and tidal volume [(TV); red circles] in orotracheally intubated rats, spontaneously breathing 1.5% isoflurane in air before and after intravenous saline [(A); black bar] or intravenous morphine administration [(B); 5 mg/kg, i.v., over 1 minute; black bar], followed by intravenous taltirelin (1 mg/kg, i.v. bolus; down arrow). Data were normalized as in Fig. 1. Each data point is the average of four animals, using 1 minute of averaged data from each animal (n = 4 ± S.E.M.). Asterisks (*, **, and ***) indicate statistical significance (P < 0.05, P < 0.01, and P < 0.001, respectively; one-way analysis of variance with Dunnett’s post-test) relative to the data point immediately prior to taltirelin injection. Baseline MV, BR, and TV were 28 ± 2 ml/min per 100 gram, 71 ± 5 minute−1, and 0.4 ± 0.04 ml per 100 g, respectively (n = 8 ± S.E.M.).
- Fig. 5.
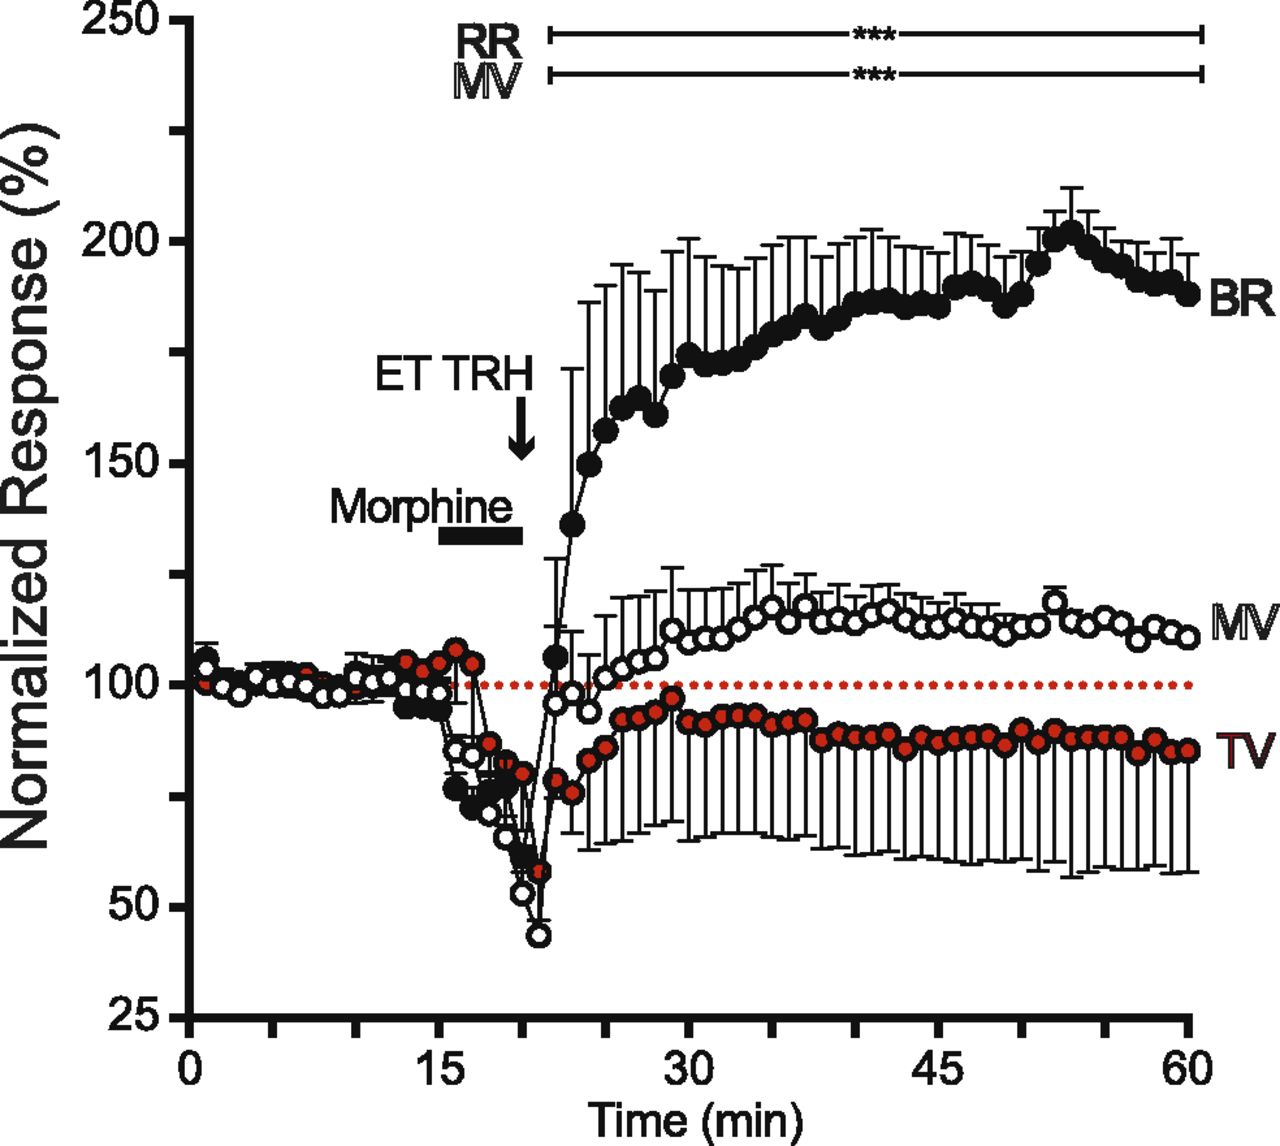
TRH reverses lethal apnea induced by high-dose, rapid intravenous morphine administration. Normalized minute ventilation [(MV); white circles], breathing rate [(BR); black circles], and tidal volume [(TV); red circles] in orotracheally intubated rats, spontaneously breathing 1.5% isoflurane in air before and after high-dose, rapid intravenous morphine administration (5 mg/kg/min, i.v., until apnea; first down arrow), followed by intravenous TRH (2 mg/kg, i.v. bolus; second down arrow) and naloxone (0.4 mg/kg, i.v. bolus; third down arrow). Rats received, on average, 21 ± 5 mg/kg of intravenous morphine in less than 5 minutes. Data were normalized as in Fig. 1. Each data point is the average of four animals, using 1 minute of averaged data from each animal (n = 4 ± S.E.M.). Since each animal incurred apnea at a slightly different time point after start of morphine infusion, time at which TRH and naloxone where administered relative to start of morphine differed slightly between animals. Baseline MV, BR, and TV were 26 ± 1 ml/min per 100 gram, 66 ± 3 minute−1, and 0.4 ± 0.04 ml per 100 g, respectively (n = 4 ± S.E.M.).
- Fig. 6.
Intratracheally administered TRH reverses morphine-induced respiratory depression. Normalized minute ventilation [(MV); white circles], breathing rate [(BR); black circles], and tidal volume [(TV); red circles] in orotracheally intubated rats, spontaneously breathing 1.5% isoflurane in air before and after intravenous morphine administration (5 mg/kg over 5 minutes; black bar), followed by intratracheal (IT) TRH (5 mg/kg, IT bolus; white bar). Data were normalized as in Fig. 1. Each data point is the average of four animals, using 1 minute of averaged data from each animal (n = 4 ± S.E.M.). Asterisks (***) indicate statistical significance (P < 0.001; one-way analysis of variance with Dunnett’s post-test) relative to the data point just prior to TRH administration. Baseline MV, BR, and TV were 26 ± 1 ml/min per 100 gram, 66 ± 3 minute−1, and 0.4 ± 0.01 ml per 100 g, respectively (n = 4 ± S.E.M.).


Additional Files
Data Supplement
- Supplemental Figures -
1. Gas flow configuration and pneumotachometer signal processing required for estimating rat ventilation.
2. Effect of intravenous bolus TRH on breathing rate (BR; black) and tidal volume (TV; red).
3. Effect of intravenous morphine, TRH, and taltirelin on heart rate (HR; black) and mean blood pressure (BP; white).
4. Intravenous TRH prevents morphine-induced respiratory depression.
- Supplemental Figures -


