


Abstract
Long-term in vitro liver models are now widely explored for human hepatic metabolic clearance prediction, enzyme phenotyping, cross-species metabolism, comparison of low clearance drugs, and induction studies. Here, we present studies using a long-term liver model, which show how metabolism and active transport, drug-drug interactions, and enzyme induction in healthy and diseased states, such as hepatitis B virus (HBV) infection, may be assessed in a single test system to enable effective data integration for physiologically based pharmacokinetic (PBPK) modeling. The approach is exemplified in the case of (3S)-4-[[(4R)-4-(2-Chloro-4-fluorophenyl)-5-methoxycarbonyl-2-thiazol-2-yl-1,4-dihydropyrimidin-6-yl]methyl]morpholine-3-carboxylic acid RO6889678, a novel inhibitor of HBV with a complex absorption, distribution, metabolism, and excretion (ADME) profile. RO6889678 showed an intracellular enrichment of 78-fold in hepatocytes, with an apparent intrinsic clearance of 5.2 µl/min per mg protein and uptake and biliary clearances of 2.6 and 1.6 µl/min per mg protein, respectively. When apparent intrinsic clearance was incorporated into a PBPK model, the simulated oral human profiles were in good agreement with observed data at low doses but were underestimated at high doses due to unexpected overproportional increases in exposure with dose. In addition, the induction potential of RO6889678 on cytochrome P450 (P450) enzymes and transporters at steady state was assessed and cotreatment with ritonavir revealed a complex drug-drug interaction with concurrent P450 inhibition and moderate UDP-glucuronosyltransferase induction. Furthermore, we report on the first evaluation of in vitro pharmacokinetics studies using HBV-infected HepatoPac cocultures. Thus, long-term liver models have great potential as translational research tools exploring pharmacokinetics of novel drugs in vitro in health and disease.
Introduction
Human hepatocytes, cultured in the short term either in suspension or as plated cells, have become one of the main tools used in drug metabolism studies. Applications include the assessment of metabolic stability (McGinnity et al., 2004; Hutzler et al., 2015), metabolite identification (MetID, Gómez-Lechón et al., 2004), reactive metabolite formation (Dong and Smith, 2009), enzyme phenotyping (Desbans et al., 2014), enzyme inhibition (McGinnity et al., 2006; Mao et al., 2011), active uptake (Bi et al., 2017), and active efflux (Kimoto et al., 2017). Physiologically based pharmacokinetic (PBPK) modeling and simulation tools are typically used to bring the data from the different assays together and provide an integrated picture of the likely human pharmacokinetics (PK), pharmacodynamics, and drug-drug interaction (DDI) potential. Although this approach has been successfully applied for many pharmaceutical applications, there remain areas in which in vitro to in vivo extrapolation via PBPK modeling is considered to be too uncertain. Such areas include transported molecules and molecules in which enzyme induction or time-dependent inhibition is present (Jones et al., 2015). One contributory factor to the poor predictions may be that although the various in vitro assays are nominally similar, the cellularity, buffer conditions, incubation times, and enzyme/transporter activities vary between hepatocyte test systems and hepatocyte batches used, with each system having been optimized for a particular readout. Furthermore, the potency of compounds at their pharmacological target is very often assessed in different in vitro systems, which are less well characterized for metabolism and transport. In hepatitis B virus (HBV) drug research, for example, various hepatoma cell lines [HepG2.2.15, HepG2–sodium taurocholate cotransporting polypeptide (NTCP), and HepaRG] are commonly employed for assessing compound activity on HBV DNA (Witt-Kehati et al., 2016). These hepatoma cell lines, in particular HepG2, showed poor similarity to primary human hepatocytes (Uhlén et al., 2015), the ultimate disease-relevant assay for HBV. However, the routine use of primary hepatocytes in HBV assays is very limited due to donor-to-donor variability and its rapid dedifferentiation in monolayer culture. Overall, this makes effective integration of the data for PBPK modeling and human dose prediction of drug candidates for HBV challenging.
Long-term hepatocyte coculture model systems have recently been developed, which allow the activities of human hepatocytes to be maintained for up to 4 weeks. Such systems find application in the study of highly metabolically stable compounds in which extended incubation times are required to allow measurable turnover to occur and hence enable prediction of human clearance in vivo (Chan et al., 2013; Ramsden et al., 2014; Bonn et al., 2016; Lin et al., 2016; Hultman et al., 2016; Schaefer et al., 2016; Kratochwil et al., 2017). Associated applications, such as the determination of metabolism products (Ballard et al., 2016; Hultman et al., 2016) and the measurement of induction effects (Dixit et al., 2016; Moore et al., 2016), have also been developed. In addition, the long-term hepatocyte models have allowed system parameters such as enzyme degradation rate constants to be determined, enhancing our understanding of the physiologic situation (Ramsden et al., 2015; Takahashi et al., 2017).
While long-term hepatocyte cultures can clearly be applied to the measurement of individual drug metabolism parameters, they have the potential to deliver new insights such as combined effects of different processes within a single test system under the same experimental conditions. For instance, Moore et al. (2016) recently reported that the apparent potency of rifampicin was higher in the long-term hepatocyte test system than traditionally observed using monoculture plated hepatocyte cultures, likely due to the action of uptake transporters.
RO6889678 is a highly potent inhibitor of HBV capsid formation, with attributes that are favorable for targeting the liver while maintaining moderate peripheral exposure. Indeed, RO6889678 displays high solubility (>1 mg/ml) and low passive permeability (0.2 × 10⁻⁶ cm/s) and undergoes active hepatic uptake via organic anion transporting polypeptides OATP1B1 and OATP1B3, classifying it as a Biopharmaceutics Drug Disposition Classification System class 3 drug (Benet et al., 2011). RO6889678 is also metabolized by a combination of CYP3A4-mediated oxidation and UDP-glucuronosyltransferase UGT1A3- and UGT1A1-mediated direct glucuronidation. It is also a substrate of ATP-binding cassette ABCG2 [breast cancer resistance protein (BCRP)], but not ABCB1 [P-glycoprotein (P-gp)], which may be responsible for its biliary efflux. Furthermore, RO6889678 is a potent inducer of CYP3A4 and coregulated proteins in human hepatocytes.
Using RO6889678 as an example, this study aimed to show how a long-term hepatocyte system can be used to deliver multiple diverse absorption, distribution, metabolism, and excretion (ADME) readouts, as well as to illustrate the interplay of different processes (e.g., active transport, metabolism, and induction) on the disposition of a candidate drug molecule enabling effective data integration via PBPK modeling for human PK prediction.
Materials and Methods
Materials.
Midazolam, 1′-hydroxymidazolam, and Roche compound RO6889678 (acid, molecular weight 494.9 g/mol) were synthesized at F. Hoffmann–La Roche Ltd. (Shanghai, China). Rifamycin (catalog no. R8626), rosuvastatin (Y0001719), ritonavir (R1692), dextromethorphan (D-2531), diclofenac (D-6899), bupropion (B-102), quinidine (Q-3625), dextrophan (D127), 4-hydroxydiclofenac (H3661), chlorpromazine hydrochloride (C8138), trypan blue (T8154), Williams’ E medium (W-1878), hydrocortisone (H-0888), insulin (I-1882), penicillin/streptomycin (P-0781), 2 mg/ml bovine serum albumin (BSA) standard (BCA ampules, no. 2320; Pierce, Rockford, IL), BCA protein assay reagents A and B (no. 23223 and 23224, respectively; Pierce), BSA (10775835001), human serum albumin (A3782), and flat-bottom Nunc 96-well plates were purchased from Sigma-Aldrich (St. Louis, MO). SN-38 [4,11-diethyl-4,9-dihydroxy-(4S)-1H-pyrano[3′,4′:6,7]indolizino[1,2-b]quinoline-3,14(4H,12H)-dione] (S589950), SN-38 glucuronide (S589980), hydroxybuproprion (H830675), and hydroxytacrine (A629900) were purchased from Toronto Research Chemicals (Toronto, ON, Canada). Tacrine (70240; Cayman Chemical, Ann Arbor, MI) and gentamycin (4-07F00-H; Amimed, London, UK) were purchased from different sources. Penicillin/streptomycin (catalog no. 15140-122), GlutaMAX-I (31966), l-glutamine (25030-024), fetal calf serum (16000), and collagen I–coated 96-well plates (A11428-03) were purchased from Gibco/Life Technologies (Grand Island, NY). For urea quantification, the urea nitrogen test (catalog no. 0580-250; StanBio Laboratory, Boerne, TX) was used. For human albumin quantification, the two-site enzyme-linked immunosorbent assay (GenWay Biotech Inc., San Diego, CA) was employed. Human HepatoPac cultures were acquired from Ascendance Corporation (Medford, MA) and prepared from a lot (unpooled) of cryoplateable hepatocytes (lot 3121A, lot TLQ; BioreclamationIVT, New Cassel, NY). Pooled and frozen human plasma (lot PLA022C0AK113) was obtained from BioreclamationIVT. The Teflon equilibrium dialysis plate (96-well, 150 µl, half-cell capacity) and cellulose membranes (12–14 kDa molecular weight cutoff) were purchased from HT-Dialysis (Gales Ferry, CT). Human fresh blood was obtained internally (F. Hoffmann–La Roche Ltd., Basel, Switzerland). Dimethylsulfoxide stock solutions for the compounds were used with final dimethylsulfoxide concentrations of 0.1% in the incubation samples. Hepatitis B surface antigen (HBsAg) and hepatitis B e antigen (HBeAg) chemiluminescent immunoassays (CLIAs; AutoBio Diagnostics Co. Ltd., Zhengzhou, China) were used to determine levels of HBV antigens. The Image-iT Fixation/Permeabilization Kit (R37602; Thermo Fisher Scientific, Waltham, MA) was used for immunostaining of HBV-infected cells. Hoechst 33342 (10 mg/ml trihydrochloride, trihydrate in water, H3570) and Dulbecco’s phosphate-buffered saline (DPBS; 21300058) were purchased from Thermo Fisher Scientific. For antibody staining, a Roche anti-HBsAg monoclonal antibody (IgG isotype; F. Hoffmann–La Roche Ltd., Rotkreuz, Switzerland), rabbit anti-core antibody (B0586; Thermo Fisher Scientific), goat anti-rabbit IgG (H+L) cross-adsorbed secondary antibody, Alexa Fluor 594 (A-11012; Thermo Fisher Scientific), and goat anti-mouse IgG (H+L) cross-adsorbed secondary antibody Alexa Fluor 488 (A-11001; Thermo Fisher Scientific) were used. The Zeiss AxioVision SE64 Rel. 4.9.1 microscope (Carl Zeiss AG Corporate, Oberkochen, Germany) was used for cell immunofluorescence imaging. For mRNA isolation and quantification, the PureLink Pro 96 RNA isolation kit (12173011A) and the RNA primer probe sets were purchased from Thermo Fisher Scientific [ABCG2 (BCRP), Hs01053790_m1; AKR1C4, Hs00559542_m1; aldehyde oxidase 1, Hs00154079_m1; CYP1A2, Hs00167927_m1; CYP2B6, Hs04183483_g1; CYP2C9, Hs02383631_s1; CYP2D6, Hs03043788_g1; CYP3A4, Hs00604506_m1; flavin monooxygenase FMO3, Hs00199368_m1; FMO4, Hs00157614_m1; FMO5, Hs00356233_m1; glyceraldehyde3-phosphate dehydrogenase, Hs02786624_g1; N-acetyl transferase NAT1, Hs00265080_s1; NAT2, Hs01854954_s1; ABCB1 (P-gp), Hs00864157_g1; SLC10A1 (NTCP), Hs00161820_m1; SLCO1B1 (OATP1B1), Hs00272374_m1; SLCO1B3 (OATP1B3), Hs00251986_m1; UGT1A1, Hs02511055_s1; and UGT1A3, Hs04194492_g1].
HepatoPac.
HepatoPac cultures were received from Ascendance Corporation and allowed to recover for 2 days after shipment by changing the medium and keeping them in a 10% CO2 atmosphere at 37°C. The hepatic functionality of the HepatoPac cultures was assessed in detail previously by Khetani and Bhatia (2008). For donor lot 3121A, albumin and urea production was provided in the Ascendance specification sheet (e.g., 32 µg/day per Mio cell for albumin and 290 µg/day per Mio cell for urea at day 8 of culture). Similar results for albumin and urea production were found after receiving the HepatoPac cultures after shipment using an enzyme-linked immunosorbent assay for albumin quantification and a standard urea nitrogen kit for urea quantification. Prior to the addition of test substances, the cultures were washed with 64 µl serum-free Dulbecco’s modified Eagle’s medium specially formulated for HepatoPac cultures (Ascendance Corporation). Incubations containing only mouse fibroblast cells served as controls, which occupy 75% of the surface area of the HepatoPac format (Khetani and Bhatia, 2008). The micropatterned HepatoPac coculture plates contained 3200 (in a 96-well plate) hepatocytes per well [donor specification (3121A) sheet provided by the supplier]. A total hepatocyte protein content of 0.05 mg/ml (0.0032 mg/well) was therefore applied for the 96-well HepatoPac format.
HBV Infection of HepatoPac (Diseased State).
HBV particles purified from the serum of an individual with chronic HBV using an OptiPrep gradient were used to infect 24-well HepatoPac cultures at 40 viral genome equivalents (vge)/cell. HBV infection was conducted in Dulbecco’s modified Eagle’s medium specially formulated for HepatoPac cultures (Maintenance Medium; Ascendance Corporation) and supplemented with 10% fetal calf serum. After overnight incubation, the virus inoculum was removed and fresh medium was added. Cells were incubated for another 24 hours before RO6889678 treatment.
HBV Antigen Level Determination.
HBsAg and HBeAg CLIAs were used to determine levels of HBV antigens secreted in culture media. This direct sandwich CLIA was performed using 50 µl supernatant. All tests were carried out with positive and negative controls including HBsAg and HBeAg standards, which were used to quantify the respective levels of antigen secretion in nanograms per milliliter.
HBV Infection Imaging.
At 12 days postinfection, the culture medium was removed and cells were fixed in 1 ml fixative solution (Image-iT Fixation/Permeabilization Kit) for 15 minutes at room temperature (RT) and then washed three times. Primary antibody staining was performed using an anti-HBsAg monoclonal antibody at 1.25 and 0.1 µg/ml rabbit anti-core antibody diluted in 3% BSA in DPBS for 1 hour at RT. After three washing steps, cells were incubated with a secondary antibody (Alexa Fluor 594 or Alexa Fluor 488, both at 2 µg/ml) diluted in 3% BSA in DPBS for 1 hour at RT. The secondary antibody was removed and cells were washed three times with 2 ml wash buffer. Nuclear staining was performed with Hoechst 33342 at 1 µg/ml diluted in 3% BSA for 15 minutes at RT. Nuclear staining solution was removed and cells were washed three times with 2 ml wash buffer. Wells were filled with 100 µl wash buffer and imaged using a Zeiss Axio Vision SE64 Rel. 4.9.1 microscope.
In Vitro Clearance.
For the in vitro studies, incubations of the reference compound (quinidine) and RO6889678 at different concentrations were performed in the 96-well human HepatoPac format (5% CO2 atmosphere and at 37°C) in the presence and absence of 2 µM ritonavir, a cytochrome P450 (P450) inhibitor. After the samples were drawn, concentrations of the compounds were quantified by liquid chromatography (LC)–tandem mass spectrometry (MS/MS). Fibroblast control plates were treated in the same manner as the HepatoPac plates. To determine the intrinsic clearance, PK modeling using a nonlinear mixed-effects approach was applied in Monolix software (version 4.33; Lixoft–Incuballiance, Orsay, France). The statistical unit was the well and interwell variability on the derived parameters was explored. Details for the intrinsic clearance determination and the in vitro to in vivo scaling of clearance including plasma protein binding, blood-to-plasma ratios, and logD and pKa determinations are given elsewhere (Kratochwil et al., 2017). The logD7.4 values, pKa values, plasma protein binding, and blood-to-plasma ratios of RO6889678 were 0.07, 2.3 (acid) and 5.8 (base), 0.07 (albumin is major binding protein) and 0.7, respectively.
Hepatocyte Enrichment.
Incubations of RO6889678 at different concentrations were performed in 96-well plates with human HepatoPac cocultures (5% CO2 atmosphere and at 37°C) in the presence and absence of 2 µM ritonavir, a P450 inhibitor. At defined time points, the cell lysate samples were retrieved and the compounds were quantified by LC-MS/MS. Fibroblast control plates were treated in the same manner as the HepatoPac plates. The intracellular concentrations of RO6889678 were corrected for fibroblast binding. The hepatocyte-specific amount (in picomoles) was calculated by multiplying the amount of RO6889678 (in picomolar values) determined from the fibroblast lysate by 0.75 and then subtracting it from the values determined in HepatoPac plates. This amount was then converted into an intracellular hepatocyte concentration (in picomoles per milliliter) by means of the hepatocyte intracellular volume of 0.021 µl for 3200 hepatocytes in a HepatoPac 96-well format. For this hepatocyte intracellular volume calculation, a hepatocyte volume of 6.48 pl/hepatocyte was used (Ramsden et al., 2014). To derive the hepatocyte enrichment (tissue partition coefficient Kp values), the intracellular concentration was divided by the extracellular concentration determined in the in vitro clearance study.
Uptake.
Incubations of the reference compound (rosuvastatin for active uptake) and RO6889678 were performed at different concentrations in the 96-well human HepatoPac format (5% CO2 atmosphere and at 37°C) in the presence and absence of 2 µM rifamycin as an OATP inhibitor. At different time points (up to 60 minutes), the concentrations of the compounds in the cell lysates were quantified by LC-MS/MS. Fibroblast control plates were treated in the same manner as the HepatoPac plates. The determined concentrations of the compounds were plotted against time and a linear fit was made to the data with emphasis on the initial linear rate. The linear rate was then used to derive the uptake rates (in picomoles per minute per milligram protein) after normalization by the protein content of the cells. Uptake rates were also determined in mouse embryonic 3T3 fibroblast control plates only and then subtracted from those in the HepatoPac incubations after multiplying by 0.75.
Biliary Efflux.
For the in vitro efflux study, the 96-well HepatoPac cocultures were incubated with either Hanks’ balanced salt solution (Ca2+ and Mg2+; HBSS+/+) or HBSS (Ca2+ and Mg2+ free; HBSS−/−) buffer for 10 minutes and then washed once with HBSS+/+ buffer before the test compounds, rosuvastatin and RO6889678, were applied. At different time points (up to 20 minutes), samples were retrieved and the compounds were quantified by LC-MS/MS. For the efflux studies, the efflux rate was calculated by subtracting the uptake rate (in picomoles per minute per milligram protein) in HBSS+/+ buffer by the uptake rate in HBSS−/− buffer.
Metabolic Enzyme Activity.
To determine metabolic enzyme activity, the enzyme markers midazolam (CYP3A4, 1 µM), dextromethorphan (CYP2D6, 1 µM), diclofenac (CYP2C9, 1 µM), bupropion (CYP2B6, 1 µM), tacrine (CYP1A2, 1 µM), amodiaquine (CYP2C8, 20 µM), and SN-38 (UGT1A1, 50 µM) were incubated in the 96-well human HepatoPac format (5% CO2 atmosphere and at 37°C). At different time points, the samples were drawn and concentrations of the metabolites (e.g., 1′-hydroxymidazolam, dextrorphan, 4-hydroxydiclofenac, hydroxybupropion hydroxytacrine, N-desethylamodiaquine, and SN-38 glucuronide) were quantified by LC-MS/MS. To derive the metabolic rates, the determined concentrations of the metabolites were plotted against time and a linear fit was made to the data with emphasis on the initial linear rate. The linear rate was then used to derive the metabolite formation rate (in picomoles per minute per milligram protein) after normalization by the protein content of the cells. Metabolic rates were also determined in mouse embryonic 3T3 fibroblast control plates only and then subtracted from those in the HepatoPac incubations after multiplying by 0.75. The details are given elsewhere (Kratochwil et al., 2017).
Bioanalytics of In Vitro Samples.
LC-MS/MS was used for quantification of the reference compounds and RO6889678. At defined time points, either an aliquot of the cell incubation medium or cell lysates (after washing with PBS three times) were then quenched with one or two volume ratios [1:1 or 1:2 (v/v)] of ice-cold acetonitrile containing 0.1% (v/v) formic acid and internal standard (0.1 mM). Samples were then cooled and centrifuged before analysis by LC-MS/MS. The high-performance LC system consisted of Shimadzu pumps (Kyoto, Japan). API6500, QTRAP 5500, or QTRAP4000 AB Sciex mass spectrometers (Framingham, MA) equipped with a TurboIonSpray source (IonSpray voltage of 5500 V in positive mode and −4500 V in negative mode) and a HTS CTC PAL autosampler (Thermo Fisher Scientific, Bremen, Germany) were used. The analytical column was a 20-cm × 2.1-mm Supelco (Sigma-Aldrich) Ascentis Express C18 with 2.7 µm particle size at different temperatures for RO6889678, quinidine, and rosuvastatin. Mobile phase A was 0.5% formic acid in 95:5 water/methanol, and mobile phase B was methanol for RO6889678 and rosuvastatin. For quinidine, mobile phase A was 20 mM ammonium bicarbonate with 95:5 methanol and mobile phase B was 100% methanol. A 50- × 2-mm Phenomenex (Torrance, CA) Gemini C18 110A resin analytical column with 5 μm particle size was used for 1′-hydroxymidazolam, SN-38 glucuronide, hydroxybupropion, 4-hydroxydiclofenac, dextrorphan, and hydroxytacrine. Mobile phase A was 0.2% formic acid in water and mobile phase B was 0.1% formic acid in 95:5 water/methanol. Aliquots of 1 or 5 µl of the centrifuged sample solutions were injected and transferred to the analytical column at flow rates between 500 and 600 µl/min. To elute the compounds, high-pressure linear gradients were applied. Detections were achieved in positive ion multiple reaction monitoring modes with the following Q1 mass (mass / charge number [m/z]), Q3 mass (m/z), and collision energy (in volts) parameter settings for RO6889678 (502.1, 358.1, and 29), 1′-hydroxymidazolam (342.0, 323.9, and 35), 4-hydroxydiclofenac (312.0, 230.4, and 40), dextromethorphan (272.1, 215.2, and 35), dextrorphan (258.2, 157.1, and 51), diclofenac (294.1, 250.0, and 17), hydroxybupropion (256.2, 238.2, and 19), hydroxytacrine (215.1, 197.0, and 25), quinidine (325.2, 81.2, and 45), rosuvastatin (482.1, 258.1, and 45), and SN-38 glucuronide (569.1, 393.0, and 45). Data analysis was performed using quadratic regression with 1/x2 weighting on peak area ratios. The precision and accuracy of the standard and quality control samples was between 80% and 120%. Analyst software (version 1.6.2; AB Sciex) was used for data processing.
MetID.
For the MetID studies, the incubation samples of RO6889678 (10 µM) in the 96-well human HepatoPac kit (5% CO2 atmosphere and at 37°C) for 96 hours were analyzed by mass spectrometry (MS) and MS/MS using a Q-Exactive linear quadrupole Orbitrap hybrid mass spectrometer (Thermo Fisher Scientific) equipped with the Xcalibur 2.2 software package, coupled to a Dionex LC system equipped with a CTC XL PAL autosampler (Thermo Fisher Scientific). The mass spectrometer was operated using positive electrospray ionization with a capillary temperature of 320°C, source/ion spray voltage of 3.5 kV, S-lens of 50 V, capillary voltage at 40 V, and ion source gases with 35, 10, and 0 arbitrary units for sheath, auxiliary, and sweep gas, respectively. The probe heater temperature was set to 350°C. MS/MS analysis was achieved using a normalized collision energy of 30% in Higher energy collision dissociation mode (activation time, 30 milliseconds). Full-scan mass spectra (m/z 150 to m/z 800) were acquired at a resolving power of 70,000. Five data-dependent MS/MS events were triggered by the full-scan data: The five most intense ions from a precursor list or the most intense ions, if no parent masses were found, triggered MS/MS scanning in the Fourier transform detector at a resolving power of 35,000. Exact mass measurement was performed after external calibration using the Thermo Fisher calibration mix solution prior to LC/MS investigations, according to the manufacturer’s methodology. Separation of the metabolites was achieved using a Waters Xselect CSH C18 column (Waters, Manchester, UK) with a 150- × 2.1-mm internal dimension and particle size of 3.5 μm at a flow rate of 400 µl/min. The injection volume was set to 10 µl, and the column oven temperature was 40°C. The mobile phase consisted of water with 0.1% (v/v) formic acid (mobile phase A) and acetonitrile (mobile phase B). The following gradient was applied: 0–5 minutes, linear isocratic at 15%–25% B; from 5 to 26 minutes, 25%–35% B; from 26 to 32 minutes, 35%–60% B; from 32 to 32.1 minutes, 60%–95% B; from 32.1 to 34 minutes, isocratic at 95% B; and from 34.1 to 39 minutes, re-equilibration at 15% B. Metabolites were identified by comparison with control samples. MetID was performed by comparison of product ion spectra of reference compounds with that of found metabolites and/or by interpretation of product ion spectra of found metabolites. The elemental composition of the product ions was matched with that of the proposed fragment structure. The semiquantitative abundance of metabolites was assessed on the basis of peak areas of extracted ion chromatograms with a mass tolerance of 3 ppm.
Enzyme Induction.
For the induction studies, RO6889678 was incubated for defined time points and then the cells were washed once with phosphate-buffered saline (PBS) (Ca2+ and Mg2+ free; PBS−/−) and lysed with 150 µl PureLink Pro lysis buffer. mRNA was isolated using the PureLink Pro 96 RNA isolation kit according to the manufacturer’s manual. RNA levels of drug-metabolizing enzymes and transporters were determined via one-step quantitative reverse transcription polymerase chain reaction (07083173001, LightCycler Multiplex RNA Virus Master; Roche, Indianapolis, IN) using the primer probe sets. The obtained data were normalized to glyceraldehyde-3-phosphate dehydrogenase using the ΔΔ threshold cycle method. The fold changes in mRNA levels of metabolic enzymes and transporters were derived by normalizing against the corresponding controls on the same day. EC50 and Emax values were derived by fitting the concentration-response (E) curves to a three-parameter sigmoid (Hill) model, according to eq. 1:  (1)where C represents concentration and γ is the Hill coefficient. The baseline value of induction (E0) was fixed to 1. Data fitting was done using GraphPad Prism 5.0 software (GraphPad Inc., La Jolla, CA).
Prediction of Oral PK Profiles in Humans Using Physiologically Based Modeling.
To predict the human PK of RO6889678, a published strategy using physiologically based modeling (Jones et al., 2006; Lavé et al., 2009) was followed using GastroPlus software (Simulations Plus, Lancaster, CA). Although a full description of the preclinical modeling and the clinical PK determined in phase I studies is beyond the scope of this article, we highlight here how the data generated in HepatoPac were used to 1) predict the importance of hepatic distribution on volume of distribution and 2) estimate the total hepatic clearance. In PBPK models, the volume of distribution is often predicted from tissue partition coefficients (Kp) estimated using mechanistic equations based on drug physicochemical properties and protein binding and assuming passive diffusion across membranes (Rodgers and Rowland, 2007). However, for RO6889678, active transport is important for hepatic distribution and this is not captured in these equations. Therefore, we used the liver partitioning measured in HepatoPac as the input for the human liver Kp and predicted human volume of distribution according to eq. 2:  (2)where Vp is the volume of plasma, Ve is erythrocyte volume, E/P is the erythrocyte to plasma concentration ratio (calculated from the blood/plasma concentration ratio and hematocrit), Vt is tissue volume, Kpt is the tissue/plasma partition coefficient, and ERt is the extraction ratio for a given tissue (Rowland, 1985).
The intrinsic apparent clearance from HepatoPac was incorporated into the well stirred liver compartment in the model using the hepatocellularity-based scaling approach previously described (Kratochwil et al., 2017). In this way, it was assumed that the apparent clearance measured in vitro captures the combination of uptake, metabolism, and biliary efflux and no empirical scaling factors were applied. Oral absorption was simulated based on measured aqueous solubility which was high (>1 mg/ml at pH from 1 to 9) and on apparent permeability measured in a Caco2 assay (0.2 × 10⁻⁶ cm/s). The in vitro permeability was converted to human intestinal permeability of 0.25 × 10⁻⁴ cm/s using in-house correlation with reference drugs (Parrott and Lavé, 2008). The clinical data for RO6889678 were obtained after single oral doses of 30–2000 mg administered as tablets under fasted conditions to healthy volunteers.
Error Margins.
Error margins are given as ±S.E. throughout this article.
Results
The design of the single and multiple dosing in vitro studies for RO6889678 are given in Fig. 1. In the single-dose study, intrinsic clearance, hepatocyte enrichment, transport, efflux, MetID, and DDIs were assessed for RO6889678. For the clearance, enrichment, and MetID studies, the concentration-time profiles of RO6889678 and its major metabolites were determined up to 6 days after single dosing. The transport studies (Fig. 1A; T indicates transport) were conducted at day 0. Before and at days 2, 4, and 6 after a single dose, the metabolic activity (Fig. 1A; E indicates enzyme activity) was assessed by using phase I and II enzyme markers.

(A–C) Design of single (A) and multiple dosing in vitro PK studies (B and C) for RO6889678 in the coculture long-term liver model HepatoPac. (A) In the single-dose study, intrinsic clearance, hepatocyte enrichment, transport, efflux, MetID, and DDIs were assessed for RO6889678. The transport studies were conducted at day 0. At days 0, 2, 4, and 6 after a single dose, metabolic activity was assessed by using phase I and II enzyme markers. (B) The induction study was conducted under steady-state conditions by dosing RO6889678 every second day and determining mRNA and metabolic enzyme activities at days 0, 4 (after two treatments with RO6889678), and 10 (after five treatments with RO6889678). (C) The ADME profile of RO6889678 was explored in the disease state. The HepatoPac cocultures were infected with HBV on day −2 and then dosed with RO6889678 at days 0, 2, and 4 before different endpoints were measured at day 10. E, enzyme activity; RO, RO6889678; T, transport.
In Vitro PK and Hepatocyte Partition Coefficient (Kp, Hepatocyte Enrichment).
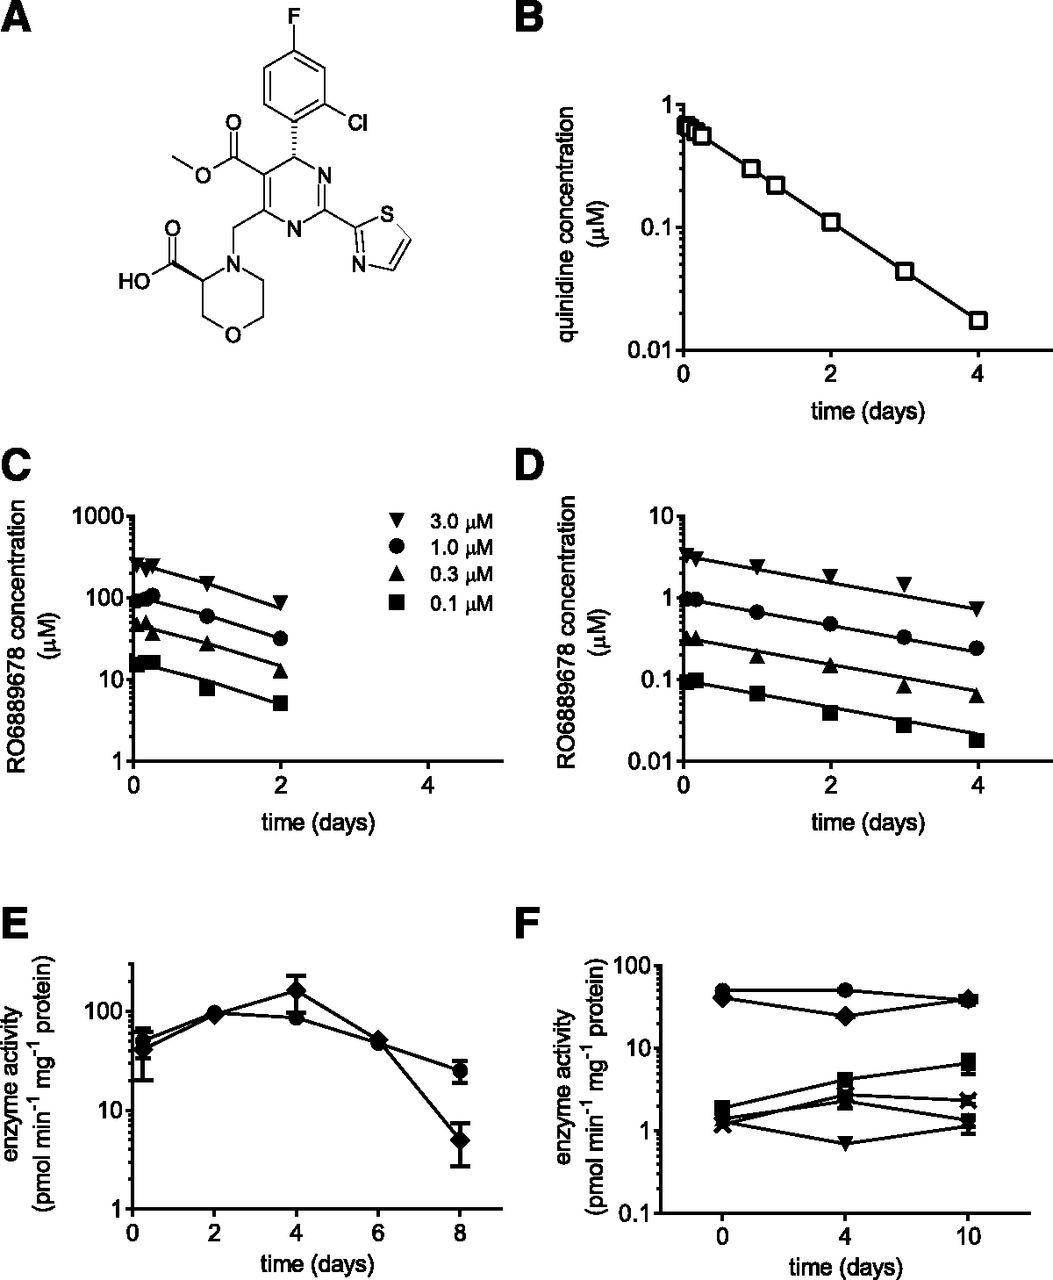
The intracellular and extracellular (cell medium) concentration-time profiles of RO6889678 were determined using initial concentrations of 0.1, 0.3, 1, and 3 µM (Fig. 2, C and D) in the HepatoPac in vitro long-term liver coculture model. The chemical structure of RO6889678 is given in Fig. 2A. Quinidine, mainly metabolized by CYP3A4, was used as the reference for the in vitro PK study. The extracellular concentration-time profile of quinidine at a concentration of 1 µM is shown in Fig. 2B, giving rise to an intrinsic clearance value of 12.8 ± 0.3 µl/min per mg protein. In Fig. 2, C and D, the concentration-time profiles for RO6889678 show linear clearance, with an apparent extracellular intrinsic clearance of 5.2 ± 0.2 µl/min per mg protein. The intracellular concentrations were corrected by those found in the fibroblast control cultures to address nonspecific binding to these feeder cells. As shown in Fig. 2C, the intracellular concentration of RO6889678 was dramatically increased compared with the extracellular concentration with a ratio of 78 ± 6 (Fig. 2D). After day 2, the hepatocyte enrichment could not be determined because the intracellular concentrations were below the lower limit of quantification. The observed enrichment (Kp value of 78) of RO6889678 clearly indicated that RO6889678 was actively taken up by hepatocytes. The study design (no medium change after dosing) for clearance determination affects the long-term viability of the hepatocytes in the HepatoPac coculture model and limits the study time window to 6 days after dosing. This is exemplified in Fig. 2E for the CYP3A4 and CYP2C8 activities, which decline after day 6 compared with day 0 (<50% at day 8 of the activity at day 0). The P450 activities were, however, stable between days 4 and 10 when the medium was renewed every second day (steady-state study design), as shown for the enzyme markers for CYP3A4, CYP2C8, CYP2C9, CYP1A2, CYP2B6, and CYP2D6 in Fig. 2F.

In vitro PK and hepatocyte enrichment. (A) Chemical structure of RO6889678. (B–D) Time concentration profiles of extracellular quinidine (B) (e.g., in cell medium) at a concentration of 1 µM and intracellular (C) and extracellular (D) RO6889678 at concentrations of 0.3, 1, 3, and 10 µM in the HepatoPac in vitro long-term liver coculture model. The apparent intrinsic clearance values were 12.8 and 5.2 µl/min per mg protein for quinidine and RO6889678, respectively. The hepatocyte enrichment of RO6889678 was 78. (E and F) P450 enzyme activities of the coculture HepatoPac model as a function of time after single (E) and multiple medium changes (every 48 hours) (F). Activities of CYP3A4 (circles), CYP1A2 (stars), CYP2B6 (upward triangles), CYP2C8 (diamonds), CYP2C9 (squares), and CYP2D6 (downward triangles) were assessed by quantification of 1′-hydroxymidazolam, hydroxytacrine, hydroxybupropion, N-desethylamodiaquine, 4-hydroxydiclofenac, and dextrorphan by LC-MS/MS and by determining metabolite formation rates (in picomoles per minute per milligram protein). The error bars present the S.E. P450 enzyme activities in the HepatoPac model were stable for up to 10 days when medium was changed every 48 hours (F) (Fig. 1, B and C). Without renewal of the medium, however, a decline in P450 activities was observed after day 6 (clearance determination) (Fig. 1A). The chemical structure of quinidine is available from PubChem (identifier CID 441074; https://pubchem.ncbi.nlm.nih.gov/compound/441074). CYP, cytochrome P450.
In Vitro Transport.
To confirm the active uptake of RO6889678 in hepatocytes, the uptake rates at different concentrations of RO6889678 were determined in the HepatoPac coculture model and in the fibroblast control cultures. Figure 3C shows the active uptake rates at different RO6889678 concentrations (solid squares) and the inhibition of the uptake in the presence of 100 µM rifamycin (open circles), an OATP inhibitor. The uptake rates shown in Fig. 3C were corrected by the uptake rates found in the fibroblast control cultures. The derived uptake clearance of RO6889678 was 2.6 ± 0.1 µl/min per mg protein. Inhibition of the uptake by rifamycin indicated the involvement of OATP transporters in the uptake of carboxylic acid RO6889678. The inhibitory potential of rifamycin was also observed by using rosuvastatin, a known substrate of OATP transporters, as a reference. The uptake of rosuvastatin at 5 µM (21.3 ± 5 pmol/min per mg protein) could be inhibited by 81% in the presence of rifamycin at a concentration of 2 µM (Fig. 3A). These findings demonstrated that OATPs are active in the HepatoPac coculture model and are responsible for the observed hepatocyte enrichment of RO6889678. To determine whether the biliary efflux transporters were also active in this model, the efflux of rosuvastatin, which is known to be biliary cleared, was studied in cell culture medium with Ca2+ (intact bile pockets) and without Ca2+ (leaky bile pockets). Figure 3B shows uptake rates of 23.6 ± 5 and 13.2 ± 4 pmol/min per mg protein for rosuvastatin at 5 µM with and without Ca2+, respectively. The derived biliary efflux rate for rosuvstatin was 10.4 pmol/min per mg protein. For RO6889678, the biliary efflux was studied at concentrations of 1, 3, and 10 µM. Figure 3D shows the efflux rates versus RO6889678 concentrations, giving rise to a biliary clearance of 1.6 ± 0.1 µl/min per mg protein. Thus, these results showed that uptake and efflux transporters were functionally active during the in vitro PK study of RO6889678.
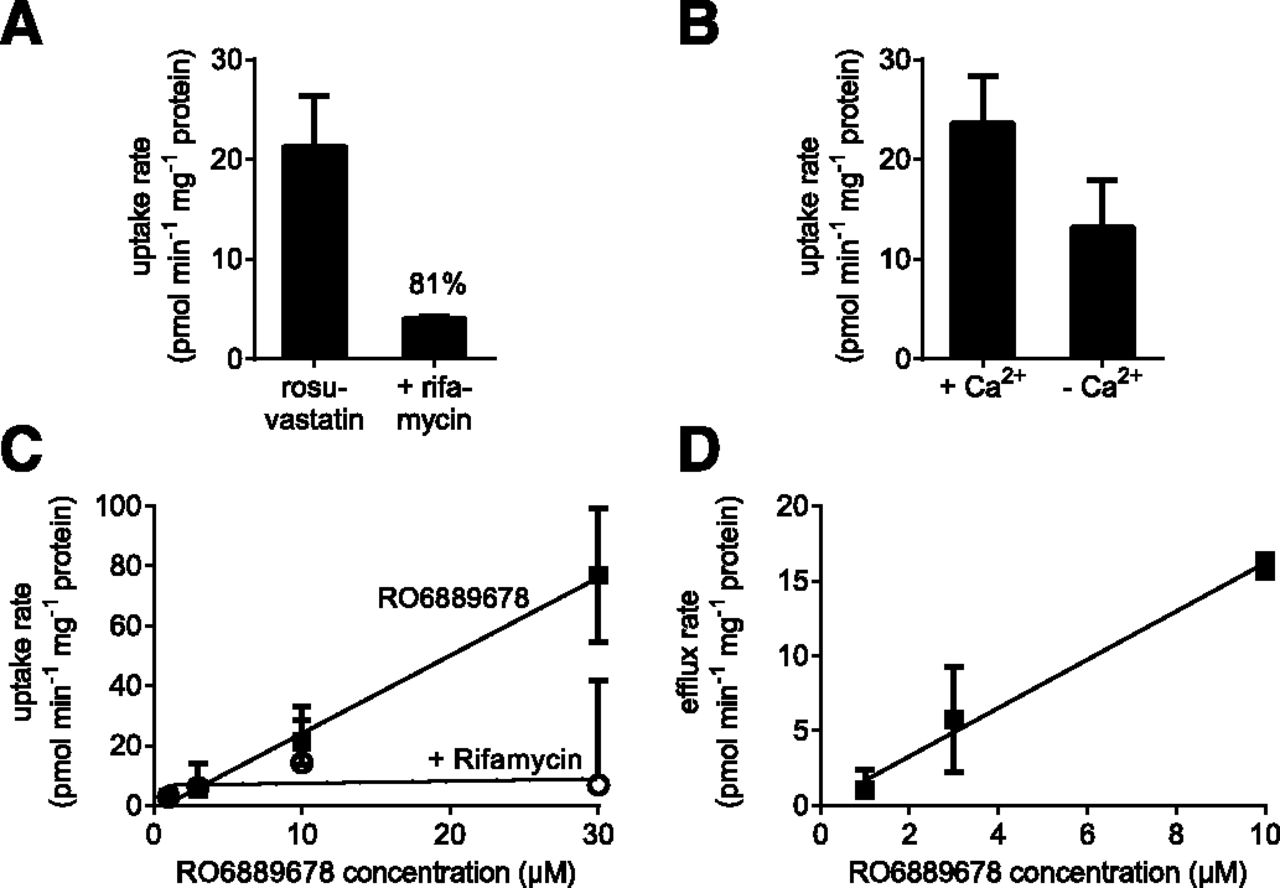
In vitro transport. (A and C) Uptake rate of rosuvastatin (A) at a concentration of 5 µM and RO6889678 (C) at different concentrations in the presence (circles) and absence (squares) of rifamycin, an OATP inhibitor. The rifamycin concentration was 2 µM. Error bars present the S.D. The derived uptake clearance of RO6889678 was 2.6 µl/min per mg protein. RO6889678 and rosuvastatin were actively taken up by OATP transporters, which could be inhibited by rifamycin, demonstrating that the OATP transporters were functional in the HepatoPac coculture model. (B) Uptake rates for rosuvastatin at a concentration of 5 µM with Ca2+ (intact bile pockets) and without Ca2+ (leaky bile pockets). The derived biliary efflux rate for rosuvastatin was 10.4 pmol/mg protein. (D) Biliary efflux rates of RO6889678 as a function of concentrations. The efflux rates increased with concentrations, showing that RO6889678 is actively exported into the bile pockets, which are formed in the HepatoPac coculture model. The derived biliary clearance of RO6889678 was 1.6 µl/min per mg protein. The chemical structure of rosuvastatin is available from PubChem (identifier CID 446157; https://pubchem.ncbi.nlm.nih.gov/compound/446157).
In Vitro MetID.
Unchanged RO6889678 was the single most abundant drug-related component detected in the human HepatoPac coculture model, estimated as approximately 24% of drug-related material in the 96-hour incubation samples (percentage of drug-related material estimated on the basis of equivalent MS response for the parent and metabolites). Consistent with short-term suspension culture hepatocyte experiments using radiolabeled RO6889678 (in which glucuronidation accounted for 85% of metabolism), RO6889678 glucuronidation was the major route of metabolism (approximately 60% of total drug-related material estimated). Significant acyl migration was observed over the timescale of the incubations employed, resulting in multiple acyl glucuronide conjugate isomers being detected. The half-life of synthesized RO6889678-glucuronide in phosphate buffer, pH 7.4, was subsequently established as 6.6 hours (data not shown), indicating low potential for clinically relevant acyl glucuronide reactivity and consistent with the half-life of the glucuronides of many carboxylic acid–containing drugs (Sawamura et al., 2010). Several less abundant oxidative metabolites together with a glucuronide of an ester hydrolysis metabolite were also detected across all time points (details in Supplemental Fig. 1).
These in vitro uptake, PK, and MetID studies in the long-term in vitro system, HepatoPac, enabled a detailed understanding of the major clearance pathways for RO6889678 in hepatocytes. Figure 4A summarizes the clearance pathways and their derived parameters for RO6889678 in the HepatoPac coculture liver model.

(A) Summary of the major clearance pathways and their derived parameters for a HBV capsid inhibitor, RO6889678, in the HepatoPac coculture long-term liver model. (B) Measured plasma concentrations (symbols) in six healthy male subjects after oral application of a 100 mg dose. The line represents the PBPK modeling prediction at this dose. (C) Predicted maximal concentrations plotted against the observed values across the tested dose range of 30–2000 mg. The straight line presents the line of unity and the 2-fold error margins are given by dashed lines. CL, clearance; CYP, cytochrome P450; Ppass, inf, sinusoidal influx clearance by passive diffusion; RO, RO6889678.
PBPK Modeling for PK Prediction in Humans.
The human PK of RO6889678 were predicted by integrating the measured intrinsic apparent clearance and the hepatocyte enrichment from the HepatoPac system in a PBPK model. The human volume of distribution (Vss) predicted based on tissue partitioning estimated from physicochemical properties and assuming passive distribution was 0.15 l/kg. However, when accounting for the 78-fold hepatocyte enrichment measured in HepatoPac, a Vss in humans of 1 l/kg was predicted. This was close to the volume of distribution measured in animal studies, which increased the confidence in the prediction. The apparent intrinsic clearance (5.2 µl/min per mg protein) measured in HepatoPac was approximately 2-fold higher than the value measured in the standard suspension hepatocyte assay. Because it had been demonstrated that both active uptake and biliary efflux were present in HepatoPac, it was assumed that the HepatoPac model better captured the in vivo–relevant contributions of uptake, metabolism, and biliary efflux. The HepatoPac intrinsic clearance value scaled to give a total hepatic plasma clearance of 7.4 ml/min per kg. Absorption simulated based on measured solubility and permeability was found to be limited by intestinal permeability and constant across the dose range at 63%. The model assumed no intestinal first pass and hepatic extraction was predicted as the ratio of blood clearance to hepatic blood flow, giving a value of 35%. This predicted a bioavailability of 41%. The plasma concentrations measured at a dose of 100 mg RO6889678 in six individuals compared with the predicted profile are shown in Fig. 4B. At this dose, the predicted maximal concentration (Cmax) and area under the curve were both within 1.5-fold of observed values. However, for doses of 300 mg RO6889678 and above (Fig. 4C), the observed plasma concentrations were higher than predicted (approximately 17-fold at the highest dose) due to a more than proportional increase in exposures with dose. At the dose of 100 mg, the predicted oral clearance of 90 l/h was in exact agreement with the observations; however, at the highest dose of 2000 mg, the observed oral clearance was reduced to 12 l/h.
In Vitro DDIs.
Ritonavir is used clinically as a boosting agent for antiviral drugs, such as by increasing the exposure of the drug compound by inhibiting the P450-mediated metabolism. It was therefore of interest to explore whether the DDI potential of RO6889678 in combination with and without ritonavir could be assessed in the HepatoPac coculture model. Phenotyping studies with microsomes and suspension culture hepatocytes showed that RO6889678 was mainly metabolized by UGTs and CYP3A4. In the DDI assessment of RO6889678 and ritonavir, enzyme activities were determined in the HepatoPac coculture model by measuring the metabolite formation rates of the CYP3A4 and UGT1A1 enzyme markers, midazolam and SN-38, respectively. A 2-fold induction of CYP3A4 activity was observed between days 4 and 6 compared with the vehicle group after a single dose of RO6889678. No CYP3A4 activity was found in the fibroblast culture controls (data not shown). Coincubation of ritonavir (2 µM) and RO6889678 (1 µM) decreased the CYP3A4 activity to 10% of the activity observed with RO6889678 alone. The intrinsic clearance of RO6889678 of 5.2 ± 0.2 µl/min per mg protein decreased to 0.9 ± 0.1 µl/min per mg protein in the presence of ritonavir, while the hepatocyte enrichment factor of 64 remained close to the value without ritonavir. The inhibition of CYP3A4 activity by ritonavir in the in vitro long-term liver model was further demonstrated by a 90% reduction of the intrinsic clearance of the reference compound, quinidine (1 µM) (e.g., from 13.6 ± 2.0 µl/min per mg protein to 1.1 ± 0.2 µl/min per mg protein, respectively). Thus, both CYP3A4 induction and inhibition could be observed in the long-term liver HepatoPac model. UGT1A1 exhibited high activity in RO6889678 metabolism and UGT1A1 activity was also assessed over time. Treatment with RO6889678 alone did not change UGT1A1 activity compared with the vehicle group, but cotreatment with ritonavir induced UGT1A1 activity 2-fold from day 2 onward after subtraction of the activities of the fibroblast control cultures (34% of the UGT1A1 SN-38 glucuronidation activity and its induction in the HepatoPac coculture model). In conclusion, concurrent P450 inhibition and moderate UGT induction with cotreatment with RO6889678 and ritonavir was observed.
In Vitro Induction after Multiple Dosing of RO6889678.
For the induction study under steady-state conditions, RO6889678 was dosed every second day in the replacement cell culture medium (as shown in Fig. 1B). At days 4 and 10, the mRNA levels of P450 enzymes and transporters were assessed after two and five RO6889678 treatments, respectively. In addition, the metabolic activities of P450 enzymes were determined. P450 mRNA levels and activities were compared at days 4 and 10 after multiple dosing at different concentrations (0.002–20 µM) of RO6889678. The dose-response curves for activity and mRNA were fitted to a sigmoidal Emax model. Table 1 lists the Emax and EC50 values for mRNA of metabolic enzymes and transporters and metabolic enzyme activity after multiple treatments with RO6889678 for 4 or 10 days in the HepatoPac cocultures. The Emax and EC50 values represent the maximal fold induction and the compound concentration where 50% of the maximal induction is observed, respectively. Robust, concentration-dependent elevation of CYP3A4, CYP2B6, CYP2C8, CYP2C9, and CYP1A2 expressions and activities were observed relative to untreated cells. The differences in Emax and EC50 values for CYP3A4, CYP2B6, CYP2C8, CYP2C9 and CYP1A2 mRNA levels were on average 2- to 3-fold (higher for Emax and lower for EC50 values) between day 4 (after two treatments) and day 10 (after five RO6889678 treatments), which suggests that the maximal induction effect of the compound was not yet reached in this in vitro liver model on day 4. In addition, an increase in mRNA levels of the transporters OATP1B1, OATP1B3, and ABCG2 (BCRP) was seen at day 10 only. No induction (<2-fold) by RO6889678 was found for CYP2D6, UGT1A1, UGT1A3, and NTCP in the studied time and concentration range (curves could not be fit to a sigmoidal Emax model, data not shown). Comparing P450 activities and mRNA expression, the Emax and EC50 values for P450 mRNA and activities were in general very similar. In conclusion, RO6889678 showed induction liability >4-fold for CYP3A4, CYP2B6, CYP2C8, CYP2C9, and CYP1A2. This result shows that long-term induction effects can now be studied in vitro with advanced cell culture models such as HepatoPac.
Emax and EC50 values for mRNA and activity of metabolic enzymes and transporters after multiple treatment with RO6889678 for 4 and 10 days in HepatoPac
Data are the mean of three determinations ± S.E.
Diseased State.
Because RO6889678 was developed as a drug candidate for HBV infection, it was interesting to explore whether the ADME profile of RO6889678 changes in the long-term liver model infected with HBV (diseased state) versus the healthy state. HepatoPac cocultures were infected with patient-derived HBV on day −2 and then RO6889678 was dosed at days 0, 2, and 4 before different endpoints were measured at day 10 (see Fig. 1C). Figure 5D shows the immunostaining of HBV-infected HepatoPac at day 12 postinfection. With the condition of 40 vge/cell used, approximately 30% of the hepatocytes were infected. Figure 5A shows that the albumin production of the hepatocytes, a viability marker, was not affected by HBV infection. Figure 5, B and C, shows that HBeAg and HBsAg levels increased with time, whereas the controls (e.g., mock-infected hepatocytes and mock- and HBV-infected fibroblasts) did not. These results demonstrate that hepatocytes in the HepatoPac model could be successfully infected with patient-derived HBV. To explore whether the diseased state influenced the induction potential of RO6889678, the mRNA levels of selected drug transporters and metabolic enzymes were determined in healthy and diseased states at day 12 postinfection. Figure 5, E and F, shows that there were no differences between healthy and diseased states in terms of mRNA levels. In the healthy state, RO6889678 increased the OATP and ABCG2 (BCRP) mRNA levels 2- to 4-fold, but not those for ABCB1 (P-gp) and NTCP (<1.5-fold). The diseased state at day 12 postinfection did not change these induced transporter expression levels further. No differences in induction potential of RO6889678 in healthy and diseased states were observed for the metabolic enzymes in respect to expression and enzyme activity (data not shown). Furthermore, hepatocyte enrichment and intrinsic clearance were assessed in the diseased state with no significant changes compared with the healthy state (e.g., 76 ± 14 and 5.5 ± 0.3, respectively). In summary, no difference could be found in the ADME profile of RO6889678 between healthy and diseased states at a HBV infection level of approximately 30% using 40 vge/cell.

Influence of diseased state on ADME profile of RO6889678. (A) Albumin production of hepatocytes in the coculture HepatoPac model in healthy and (hepatitis B virus HBV)-infected states. No influence of HBV infection on albumin production of hepatocytes could be observed with time (infected hepatocytes, circles; and mock-infected hepatocytes, squares). In the controls, mock-infected fibroblasts (downward triangles), and HBV-infected fibroblasts (upward triangles), only very low albumin levels (background signal) were observed. (B and C) Levels of HBeAg (B) and HBsAg (C) versus time in the HBV-infected coculture HepatoPac model (circles). In the controls, mock-infected hepatocytes (squares), mock-infected fibroblasts (downward triangles), and HBV-infected fibroblasts (upward triangles), no antigen levels (background signal) were observed. (D) Immunostaining of HBV infection in HepatoPac (day 12 postinfection). Nuclear staining was performed with Hoechst 33342 (blue). Immunostaining of HBsAg protein (green) and HB core (red) with secondary Alexa Fluor antibodies. (E and F) Induction potential of RO6889678 in healthy and diseased states (HBV-infected hepatocytes). The fold changes of mRNA expression levels are shown in diseased versus healthy states and after multiple treatments with RO6889678 compound (at day 12 postinfection). (E) Transporter mRNA expression levels of OATP and ABCG2 (BCRP) were increased 2- to 3-fold in healthy and diseased states after RO6889678 treatment. (F) Metabolic enzyme mRNA levels. Two- to 3-fold elevation of CYP3A4, CYP2B6, CYP2C8, CYP2C9, and CYP1A2 expression was observed relative to untreated cells in healthy and disease states. Changes in expression levels (≤2-fold) were found for CYP2D6, UGTs (UGT1A1, UGT1A3), FMOs (FMO3, FMO4, and FMO5), NAT monooxygenases (NAT1 and NAT2), aldehyde oxidase, and aldo-keto reductase. Thus, no changes in induction potential of RO6889678 could be observed comparing healthy and diseased states. D, diseased; H, healthy; RO, RO6889678.
Discussion
Studies using long-term hepatocyte cultures have typically targeted single, long timescale endpoints to determine intrinsic clearance, metabolite generation, or enzyme induction (Dixit et al., 2016; Moore et al., 2016). In addition, enzyme activity, active uptake, and active efflux studies as short-term single point assessments were reported to monitor system changes with time, allowing DDI (inhibition, inactivation, and induction) effects to be examined.
In this study, multiple endpoints were assessed in the same in vitro liver system with the view to translate the data using PBPK modeling to predict human PK. RO6889678, a Biopharmaceutics Drug Disposition Classification System class 3 drug candidate, was actively taken up in HepatoPac with an uptake clearance of 2.6 µl/min per mg protein and was shown to be an OATP1B1 and OATP1B3 substrate in separate studies. RO6889678 is not a lipophilic basic compound likely to accumulate in lysosomes and the uptake could be inhibited by rifamycin, confirming the role of active transport in cellular accumulation and giving a result analogous to that reported for faldaprevir (Ramsden et al., 2014). The half-life of RO6889678 in both media and cells was essentially the same (1.9 days), with an apparent intrinsic clearance of 5.2 µl/min per mg protein and cellular enrichment of 78-fold. Furthermore, RO6889678 was actively secreted in the HepatoPac bile pockets, with a biliary clearance of 1.6 µl/min per mg protein. In separate in vitro metabolism studies, glucuronidation was identified as the major metabolic route of RO6889678, with oxidation as a minor route. Due to the low metabolic clearance of RO6889678 (<10 µl/min per mg protein in microsomes, which is beyond the assay-sensitive range), the total intrinsic clearance (metabolism and biliary clearance) could not be calculated and the sinusoidal influx clearance by passive diffusion derived by OATP inhibition showed high variability.
Prediction of Human PK from Long-Term Hepatocyte Cultures Using PBPK.
The PBPK modeling strategy for the PK prediction of RO6889678 in humans followed a holistic approach, assuming that the apparent, intrinsic clearance of 5.2 µl/min per mg protein in the cell medium represented all of the in vivo–relevant cellular clearance rates including uptake and efflux. Using a direct scaling approach, the total hepatic plasma clearance was predicted to be 7.4 ml/min per kg. A “bottom-up” integration of in vitro parameters for the various hepatic disposition processes via a permeability-limited physiologically based liver model was not pursued due to the limited confidence in the derived total intrinsic clearance and sinusoidal influx clearance by passive diffusion values for RO6889678 (Umehara and Camenisch, 2012; Varma et al., 2015; Camenisch 2016). At low dose, the scaled clearance and the predicted Vss accounting for the hepatic partition coefficient (∼78-fold) seemed to be accurate, as the observed oral clearance and Cmax values were in good agreement with the prediction. However, without intravenous PK data, a definitive statement on the accuracy of the prediction is not possible. Furthermore, higher oral doses showed a more than proportional increase in exposures, suggesting saturation of one or more active processes.
To date, an apparent disconnect in the in vitro to in vivo extrapolation of transport kinetics has limited PBPK modeling strategies for the prediction of PK of transported molecules (Barton et al., 2013; Galetin, 2014; Jones et al., 2015). In particular, a marked underprediction of active uptake (58-fold) and an overprediction of biliary efflux (16-fold) have been reported when using sandwich-cultured hepatocytes to generate input parameters for PBPK simulations of seven diverse OATP substrates (Jones et al., 2012). In this study, the human PK of RO6889678 at low doses was predicted well from the long-term hepatocyte cultures. This is encouraging, especially since uptake and efflux were measurable in the long-term system and the determined parameters were close to the apparent clearance, which when scaled delivered a good match to observed oral clearance at a low dose. However, as the saturation seen in vivo was not observed in vitro for RO6889678 and there is limited validation reported in the literature (Ramsden et al., 2014), further work is needed to explore the potential for HepatoPac for human PK projections of transported molecules.
Adaptive Effects of Long-Term Hepatocyte Cultures to Drug Treatment.
Maintenance of the correct ratio of different enzyme activities is essential if metabolism data are to be used to inform enzyme phenotyping and DDI risk assessments. Enzyme-selective marker substrates have previously been used to show that P450, FMO, aldehyde oxidase, aldo-keto reductase, UGT, sulfotransferase, and NAT enzymes are active in HepatoPac cultures (Kratochwil et al., 2017).
A significant opportunity with long-term hepatocyte culture systems is that of using multiple test compound administrations to attain continuous exposure and to provide an in vitro PK system that can be used to model human multiple dose and DDI studies. Study 2, in which multiple concentrations of RO6889678 were administered every 2 days over five cycles, allowed a detailed assessment of the inductive effect of RO6889678 to be generated. Both mRNA and enzyme marker activities were assessed across a panel of six P450 enzymes, five additional drug-metabolizing enzymes, and four transporters. Strong induction (>3-fold) of CYP3A4, CYP2B6, CYP2C8, CYP2C9, and CYP1A2 mRNA levels and activities was observed, whereas no UGT induction (<2-fold for mRNA levels) was detected in these experiments for RO6889678. These data contrasted somewhat with those of traditional two-dimensional plated hepatocyte cultures in which UGT1A1 and UGT1A3 mRNA induction of up to 3-fold was observed. The reason for this discrepancy is currently not known, although it is likely that selection of hepatocyte donors that are sensitive to UGT induction is an important factor. This broad assessment of enzyme and transporter induction resulted in a detailed profile of the potential for DDI exhibited by RO6889678. Not only were marker enzyme activities enhanced but a wide variety of co-induced enzymes were also often not examined in detail (e.g., CYP2C9 and CYP2C8). These results build on the dedicated induction studies reported previously (Dixit et al., 2016; Moore et al., 2016) to give additional enzyme activity measurements and further validate the HepatoPac system for the performance of in vitro PK studies. The importance of assessing the actual cellular exposure to the inducing agent was recently emphasized (Sun et al., 2017). Use of a long-term hepatocyte experiment in which the drug and metabolite concentration-time profiles are simultaneously assessed with induction and enzyme inhibition effects naturally lends itself to a more holistic understanding of the DDI potential both after single administration and at steady state. Due to the need to regularly replenish cell media, the system does not allow for the accumulation of the parent or metabolites, as may be observed in vivo. Nevertheless, the ability to administer concentrations several times in excess of those given in vivo and the possibility to coadminister both the drug substance and metabolites may be used to compensate for this shortcoming and still allow an accurate assessment of induction effects to be made.
Future Applications: Diseased State.
An important extension to using long-term hepatocytes for metabolism studies is their application to pharmacology (Shlomai et al., 2014; Winer et al., 2017) and toxicology investigations (Trask et al., 2014; March et al., 2015) for the effective integration of the data for PBPK modeling. Study 3 showed that the HepatoPac system could be successfully infected with patient-derived HBV, resulting in HBsAg and HBeAg production without affecting albumin generation, as a marker of normal hepatocyte activity. For RO6889678, no difference could be found in the ADME profile between the healthy and diseased states at a HBV infection level of approximately 30% using 40 vge/cell. However, higher infection levels in the HepatoPac cultures (e.g., 80%) could influence these ADME findings for RO6889678 in the diseased state and need further exploration. In a chronic HBV infection, typically between 5% and 40% of all hepatocytes in the liver can be infected (Nowak et al., 1996). Another point to consider is the fact that this study was performed only with one HBV isolate/genotype (genotype D). The HBV genotype is known to affect viral pathogenesis, disease progression, and response to treatment with interferon-α (Lin and Kao, 2017). As chronic HBV infection is not a homogenous disease with singular clinical presentation, studies with varying degrees of infection rates and/or different HBV genotypes are warranted to inform about the changes in the ADME profile of a HBV compound in healthy and diseased states.
Conclusions
A complex combination of metabolism and transport processes contributed to the in vivo clearance of RO6889678, each of which could be assessed in the HepatoPac coculture system: metabolism by a combination of glucuronidation and oxidation and active transporter-mediated uptake and efflux. This proved to be valuable to estimate both the hepatic distribution and clearance of RO6889678, which represents a case of a transported, largely phase II metabolized compound. Further extensions of system usage (e.g., to study the effect of infection or of cytokine/immune cell presence on hepatocyte function) may be made together with functional readouts for the test drug, allowing combined in vitro PK and pharmacodynamics studies to be performed.
Acknowledgments
We thank Christoph Funk, Franz Schuler, Thierry Lavé, and John Young (Roche Pharmaceutical Research and Early Development, Roche Innovation Center Basel, Switzerland) for supporting this work and critical discussions. We also thank Massimiliano Donzelli, Sandrine Simon, Hamina Daff, and Bjoern Wagner (Roche Pharmaceutical Research and Early Development, Roche Innovation Center Basel, Basel, Switzerland) for providing the plasma protein binding and blood-to-plasma partitioning data and conducting the logD and pKa determinations. Finally, we thank Sheng Zhong, Wenzhe Lu and Wei Zhu (Roche Innovation Center, Shanghai, China) for synthesis of RO6889678 and measurements of RO6889678 glucuronide stability.
Authorship Contributions
Participated in research design: Kratochwil, Triyatni, Mueller, Leonard, Ullah, Boess, Ottaviani, Yin, Parrott, Fowler.
Conducted experiments: Mueller, Klammers, Leonard, Turley, Schmaler, Ekiciler, Molitor, Walter, Gonsard, Tournillac, Durrwell, Marschmann.
Performed data analysis: Kratochwil, Triyatni, Mueller, Leonard, Marschmann, Jones, Yin, Parrott.
Wrote or contributed to the writing of the manuscript: Kratochwil, Triyatni, Mueller, Leonard, Turley, Jones, Ullah, Parrott, Fowler.
Footnotes
- Received October 16, 2017.
- Accepted January 26, 2018.
↵
 This article has supplemental material available at jpet.aspetjournals.org.

Abbreviations
- ABC
- ATP-binding cassette
- ADME
- absorption, distribution, metabolism, and excretion
- BCRP
- breast cancer resistance protein
- BSA
- bovine serum albumin
- CLIA
- chemiluminescent immunoassay
- DDI
- drug-drug interaction
- DPBS
- Dulbecco’s phosphate-buffered saline
- FMO
- flavin monooxygenase
- HBeAg
- hepatitis B e antigen
- HBsAg
- hepatitis B surface antigen
- HBSS
- Hanks’ balanced salt solution
- HBV
- hepatitis B virus
- LC
- liquid chromatography
- MetID
- metabolite identification
- MS
- mass spectrometry
- MS/MS
- tandem mass spectrometry
- m/z
- mass divided by charge number
- NAT
- N-acetyl transferase
- NTCP
- sodium taurocholate cotransporting polypeptide
- OATP
- organic anion transporting polypeptide
- P450
- cytochrome P450
- PBPK
- physiologically based pharmacokinetics
- PBS
- phosphate-buffered saline
- P-gp
- P-glycoprotein
- PK
- pharmacokinetics
- RO6889678
- (3S)-4-[[(4R)-4-(2-Chloro-4-fluorophenyl)-5-methoxycarbonyl-2-thiazol-2-yl-1,4-dihydropyrimidin-6-yl]methyl]morpholine-3-carboxylic acid
- RT
- room temperature
- SN-38
- 4,11-diethyl-4,9-dihydroxy-(4S)-1H-pyrano[3′,4′:6,7]indolizino[1,2-b]quinoline-3,14(4H,12H)-dione
- UGT
- UDP-glucuronosyltransferase
- vge
- viral genome equivalents
- Copyright © 2018 The Author(s).
This is an open access article distributed under the CC BY Attribution 4.0 International license.


