


Abstract
Naturally expressed nicotinic acetylcholine receptors composed of α4 and β2 subunits (α4β2-nAChR) are the predominant form of high affinity nicotine binding site in the brain implicated in nicotine reward, mediation of nicotinic cholinergic transmission, modulation of signaling through other chemical messages, and a number of neuropsychiatric disorders. To develop a model system for studies of human α4β2-nAChR allowing protein chemical, functional, pharmacological, and regulation of expression studies, human α4 and β2 subunits were stably introduced into the native nAChR-null human epithelial cell line SHEP1. Heterologously expressed α4β2-nAChR engage in high-affinity, specific binding of 3H-labeled epibatidine (H-EBDN; macroscopic KD = 10 pM; kon = 0.74/min/nM, koff = 0.013/min). Immunofluorescence studies show α4 and β2 subunit protein expression in virtually every transfected cell, and microautoradiographic studies show expression of 125I-labeled iodo-deschloroepibatidine binding sites in most cells. H-EBDN binding competition studies reveal high affinity for nicotinic agonists and lower affinity for nicotinic antagonists. Heterologously expressed α4β2-nAChR functional studies using 86Rb+ efflux assays indicate full efficacy of epibatidine, nicotine, and acetylcholine; partial efficacy for 1,1-dimethyl-4-phenyl-piperazinium, cytisine, and suberyldicholine; competitive antagonism by dihydro-β-erythroidine, decamethonium, and methyllycaconitine; noncompetitive antagonism by mecamylamine and eserine; and mixed antagonism by pancuronium, hexamethonium, and d-tubocurarine. These results demonstrate utility of transfected SH-EP1 cells as models for studies of human α4β2-nAChR, and they also reveal complex relationships between apparent affinities of drugs for radioligand binding and functional sites on human α4β2-nAChR.
Nicotinic acetylcholine receptors (nAChR) are prototypical members of the ligand-gated ion channel superfamily of neurotransmitter receptors (see reviews and/or tables by Lindstrom, 1996; Lukas, 1998; Lukas et al., 1999; Clementi et al., 2000; Alexander and Peters, 2001). nAChR represent both classic and contemporary models for the establishment of concepts pertaining to mechanisms of drug action, synaptic transmission, and structure and function of transmembrane signaling molecules. nAChR found postsynaptically on muscle, postganglionic neurons, or central neurons mediating depolarizing, inward Na+ currents play important roles in classic excitatory neurotransmission. nAChR on motor, preganglionic, or central neuronal terminals also can modulate neurotransmitter release. nAChR exist as a diverse family of molecules composed of different combinations of subunits derived from at least 17 genes (α1-α10, β1-β4, γ, δ, ϵ; see reviews cited above and Elgoyhen et al., 2001). Naturally expressed nAChR in muscle are made from α1, β1, δ, and either γ (fetal) or ϵ (adult) subunits and have properties just like those of heterologously expressed nAChR made of the same subunits. nAChR can form as homomers of the most ancient nAChR subunits, α7, α8, or α9, although α7 plus α8, α9 plus α10, and perhaps other higher order complexes can also form in heterologous expression systems and/or naturally (see reviews cited above and Elgoyhen et al., 2001). Binary complexes of α2, α3, α4, or α6 subunits with β2 or β4 subunits also can form distinctive nAChR subtypes, at least in heterologous expression systems. α5 and β3 subunits seem to be “wild cards” able to integrate into at least some of the α/β binary complexes to form trinary complexes with unique properties, and more than one kind of α or β subunit can exist in some nAChR subtypes (e.g., naturally expressed α3α5β2β4-nAChR in postganglionic neurons; α4α6β2-nAChR in heterologous expression systems).
The predominant nAChR subtype in the brain that also displays highest affinity interactions with nicotine contains α4 and β2 subunits (α4β2-nAChR; Whiting and Lindstrom, 1987; Flores et al., 1992). α4β2-nAChR have been implicated in perception, cognition, and emotion; in nicotine self-administration, reward, and dependence; and in diseases such as Alzheimer's and epilepsy (Picciotto et al., 1995; Lindstrom, 1996; Lukas, 1998; Cordero-Erausquin et al., 2000; Steinlein, 2001). Consequently, α4β2-nAChR have been widely studied when naturally expressed (e.g., Alkondon and Albuquerque, 1993, 1995; Albuquerque et al., 1998) or when heterologously expressed in the Xenopus laevis oocyte system (Elliott et al., 1996; Gopalakrishnan et al., 1996, 1997; Chavez-Noriega et al., 1997; Fenster et al., 1997; Papke et al., 2000). The M10 mouse fibroblast cell line was the first host for stable expression of chick α4β2-nAChR as ligand binding sites (Whiting et al., 1991), but functional responses of α4β2-nAChR in those cells are not robust. HEK cells also have been used for expression of mammalian α4β2-nAChR with good success (Buisson et al., 1996, 2000; Gopalakrishnan et al., 1996, 1997; Cooper et al., 1999; Buisson and Bertrand, 2001). To the first approximation, properties of heterologously and naturally expressed α4β2-nAChR are similar. However, given the importance of α4β2-nAChR, it was reasoned that expression in an alternative model system, the SH-EP1 human epithelial cell line (Ross et al., 1983), was warranted, particularly because SH-EP1 cells may share neuroepithelial origins with neurons; may have a polar nature (basolateral/apical) like neurons (somatodendritic/axonal); perhaps process complex transmembrane proteins as neurons do (Lukas et al., 2002); and could be freely distributed to the academic community. In the process of characterizing human α4β2-nAChR heterologously expressed by human SH-EP1 epithelial cells, interesting and unusual relationships between affinities of nicotinic drugs for radioligand binding and functional sites on α4β2-nAChR have been revealed (see preliminary report by Peng et al., 1999).
Materials and Methods
Cell Culture. Cells of the SH-EP1 human epithelial cell line (kindly provided by Dr. June Biedler, Sloan Kettering Institute for Cancer Research, New York, NY) were grown in Dulbecco's modified Eagle's medium (high glucose, bicarbonate-buffered, with 1 mM sodium pyruvate and 8 mM l-glutamine) supplemented with 10% horse serum, 100 U/ml penicillin, 100 μg/ml streptomycin, and 0.25 μg/ml amphotericin B (all from Invitrogen, Carlsbad, CA) plus 5% fetal bovine serum (Hyclone, Logan, UT) on 100-mm diameter plates in a humidified atmosphere containing 5% CO2 in air at 37°C (Lukas, 1986; Lukas et al., 1993).
Construction of Human α4 and β2 Expression Plasmids and Generation of Stably Transfected Cells and Cell Lines. cDNA encoding a human α4 subunit (Steinlein et al., 1996; see GenBank accession NM_000744 for an update) was excised from the pSPoD vector as a HindIII-SalI fragment encompassing 54 bp of sequences in the vector polycloning site in the 5′ direction from the 1937 bp of α4 cDNA and 204 bp corresponding to the vector polycloning site and some vector sequences in the 3′ direction from the insert. The ends of the fragment were blunt-ended using Klenow enzyme and ligated into pcDNA3.1/zeo (Invitrogen) cut at the EcoRV site to generate the pcDNA3.1/zeo-hα4 construct. cDNA encoding a human β2 subunit (Rempel et al., 1998; see GenBank accession NM_000748 for an update) was excised from the pSPoD vector at the BglII restriction site, blunt-ended, and ligated with pcDNA3.1/hygro (Invitrogen) cut at the EcoRV site to generate the pcDNA3.1/hygro-hβ2 construct. Final constructs were verified by restriction mapping, and full cDNA sequences were confirmed. Some nucleotide differences from the published reference sequences were found, and those producing amino acid residue changes are: α4, tcc(P452S); β2, gcg(T26A), ctc(F173L), gcc(V255A), gtg(E449V). These rare polymorphisms have a frequency of less than 1% in the white population. Native nAChR-null SH-EP1 cells (Lukas et al., 1993) were transfected simultaneously with both α4 and β2 constructs using electroporation (Gene Pulsar; 960 μF, 0.20 kV/cm, t = 28-36 ms; Bio-Rad, Hercules, CA). Forty-eight hours after transfection, culture medium was supplemented with 0.25 mg/ml zeocin (Invitrogen) and 0.4 mg/ml hygromycin B (130 μg/ml biologically active hygromycin; Calbiochem, San Diego, CA) to begin positive selection for cells expressing dual drug resistance. Growth was monitored until ring cloning was used to isolate single, transfected cell colonies, which were then expanded. Clones were screened for function using 86Rb+ efflux assays, and a clone exhibiting high expression of α4β2-nAChR was then subcloned by dilution and repetition of the ring-cloning method. The cell line isolated and used in these studies is called the SH-EP1-pcDNA-hα4β2 line (SH-EP1-hα4β2 cells). These cells were maintained, in medium described above supplemented with zeocin and hygromycin to maintain positive selection of transfectants, as low passage number (1-26 from our frozen stocks) cultures to ensure stable expression of phenotype, and they were passaged once weekly by splitting just-confluent cultures 1/20-1/40 to maintain cells in proliferative growth (Lukas et al., 2002). Reverse transcription-polymerase chain reactions were done initially and regularly thereafter to confirm expression of α4 and β2 subunit messages (see Peng et al., 1999; Wu et al., 2001).
Immunofluorescence Cell Labeling. To visualize nAChR α4 and β2 subunits on the cell surface, SH-EP1-hα4β2 cells were plated onto 22 χ 22-mm glass coverslips and grown for 2 days. Cells were then incubated at 37°C for 30 min in growth medium containing primary monoclonal antibodies generated in Dr. Jon Lindstrom's laboratory against either the nAChR α4 subunit (rat mAb 299; RBI-Sigma, St. Louis, MO) or the nAChR β2 subunit (rat mAb 290; RBI-Sigma). Control samples were processed in the absence of primary antibody or used untransfected SH-EP1 cells. After rinsing with phosphate-buffered saline (PBS), cells were fixed with 4% paraformaldehyde for 10 min and rinsed again before blocking for 20 min with PBS containing 4% normal rabbit serum, 1% bovine serum albumin, and 0.4% Triton X-100. Blocking was followed by 30 min incubations with 1% bovine serum albumin-PBS containing biotinylated secondary antibody (rabbit-anti rat IgG; Vector Labs, Burlingame, CA) and then with avidin-Alexa 488 (Molecular Probes, Eugene, OR), with PBS rinses between steps. Staining was visualized using epifluorescence (Olympus IX70; Olympus America, Melville, NY). Transfected SH-EP1 cells heterologously expressing human α4β4-nAChR (Eaton et al., 2000) were used as another negative (for β2 subunits) or positive (for α4 subunits) control and showed no staining when probed with anti-β2 subunit antibody (data not shown).
125I-Labeled Epibatidine Binding Autoradiography. Cultured cells grown for two days on Lab Tek II CC2 8-well chambered slides (Nalge Nunc International, Naperville, IL) were rinsed in room temperature PBS for 5 min and then incubated in fresh binding buffer (120 mM NaCl, 5 mM KCl, 2.5 mM CaCl2, 50 mM Tris HCl, 1 mM MgCl2, pH adjusted to 7.4 with NaOH) containing 100 pM 125I-labeled iodo-deschloro-epibatidine [(±)-exo-2-(2-iodo-5-pyridyl)-7-azabicyclo[2.2.1]heptane; Davila-Garcia et al., 1997; abbreviated here as I-EBDN], alone to define total radioligand binding or in the presence of 100 μM nicotine to define nonspecific binding, for 30 min at 22°C. After radioligand incubation, samples were rinsed twice in 1χ binding buffer at 4°C for 10 s each, once in 0.1χ buffer at 4°C for 10 s, and then in H2O at 4°C for 10 s. Subsequently, slides were fixed in 4% paraformaldehyde (50/50 solution, 8% paraformaldehyde, and 0.2 M phosphate buffer, pH 7.2) for 20 min at 22°C before being rinsed briefly in H2O and air-dried at 22°C. Samples were then subjected to electronic isotope counting using an Instant Imager (PerkinElmer Life Sciences, Boston, MA) to quantify specific (total minus nonspecific) radioligand binding (i.e., integrating counts across defined areas of sections or cultures containing equivalent amounts and densities of cells). After radioligand binding quantification, samples were dipped in NTB-3 nuclear track emulsion (Eastman Kodak, Rochester, NY) and allowed to dry overnight at 22°C in a dust-free environment. Slides were then stored at 4°C for exposure periods ranging from 2 to 5 days (showing a linear grain development response and revealing sites of low-level radioligand binding). After exposure, slides were developed for 3 min at 22°C with Kodak D-19 developer and fixed for 3 min at 22°C with Kodak fixer. Slides were counterstained with 0.5% cresyl violet acetate and serially dehydrated with 50, 75, 85, and 95% ethanol. After ethanol treatments, slides were dipped twice in xylene for 5 min each at 22°C and dry-mounted with Permount. Images were captured using an Olympus IX70 inverted microscope and MagnaFire 2.0 camera and software (Optronics, Goleta, CA) and then stored and maximized for Hi Gauss clarity and sharpness using Image Pro Plus 4.1 (Media Cybernetics, Silver Spring, MD).
Membrane Preparations. Confluent, stably transfected cells were mechanically dislodged using a polypropylene policeman and collected into 50-ml centrifuge tubes (five 100-mm plates per tube). Cells were pelleted and medium removed by low-speed centrifugation, and the cells were then resuspended in 3 ml of ice-cold 5 mM Tris, pH 7.4, to aid in homogenization. Cells were homogenized with a Polytron homogenizer (45 s using a Brinkmann model 10/35 with a PTA10S generator) set at a speed of 70. Homogenized membranes were centrifuged at 45,000g for 10 min at 4°C and resuspended in 6 ml of Ringer's solution supplemented with 0.1 mg/ml of sodium azide (RAZ) through two cycles to wash the membranes before final resuspension in ∼1 ml of RAZ. Membrane protein was quantified with the bicinchoninic acid protein assay (Pierce, Rockford, IL) according to the manufacturer's instructions. A typical yield for membrane preparations is 0.24 mg of membrane protein per confluent dish. These preparations were stored at 4°C and have a shelf life of at least 1 year for use in 3H-labeled epibatidine (H-EBDN) binding assays.
[3H]EBDN Binding Assays. Membranes prepared as described above were used for H-EBDN (PerkinElmer Life Sciences) binding saturation assays (modified after Houghtling et al., 1994, 1995). Reactions were incubated for 3 to 3.5 h at 25°C in 13 χ 100-mm test tubes in a final volume of 6 ml to minimize radioligand depletion. Total radioligand binding was determined for samples that typically contained ∼1.5 to 3 μg of membrane protein (∼25 and no more than 30 fmol of binding sites, consistent with expression of as much as 12 pmol of nAChR/mg of membrane protein) and H-EBDN to provide a final concentration ranging from 1 pM to 1 nM in RAZ. To determine nonspecific binding, a sister-reaction was carried out at each HEBDN concentration in the presence of 100 μM nicotine (Sigma Chemical Co., St Louis, MO). Reactions were gently mixed (not vortexed) using an orbital shaker (360-P; Precision Scientific, Winchester, VA) at ∼160 rpm. Free H-EBDN was separated from bound H-EBDN using filtration over polyethylenimine-coated, 25-mm diameter GF/C glass fiber discs and a 10-position manifold generating 15 to 20 psi of vacuum. The filter and reaction tubes were then rinsed three times by pumping 8 ml of ice-cold RAZ into the reaction tube and then pouring the rinses over the filter. Filters were air-dried in the manifold by vacuum suction, transferred into liquid scintillation vials, and shaken overnight in 6 ml of Ready-Safe cocktail (Beckman Coulter, Fullerton, CA) before sample H-EBDN was quantified (Tri-Carb 1900 liquid scintillation analyzer; PerkinElmer Life Sciences; 59% efficiency).
For H-EBDN binding competition assays, reactions of 0.8 ml in 1.2-ml microtiter tubes (Life Science Products, Frederick, CO) contained 400 pM H-EBDN. These reactions contained the appropriate volume of RAZ, 100 μl of 3.2 nM H-EBDN, 100 μl of either the appropriate concentration of competing ligand, vehicle, or nicotine to yield a final concentration of 100 μM, and 100 μl of membrane protein (typically 1-3 μg yielding about 25 fmol of binding sites) added in that order, where all ligands and membranes were prepared in RAZ. Reactions were carried out for 2 h at room temperature with shaking. Reactions were terminated by filtration with GF/C filter sheets (soaked in 0.2% polyethylenimine for at least 30 min and rinsed with RAZ just before use) using a 1H-201-A sample processor (Inotech Biosystems, Rockville, MD) in the 96-well cutting head configuration. Samples aspirated onto the GF/C sheets were rinsed three times using ice-cold RAZ. Filters were transferred to PET 96-well plates (PerkinElmer Wallac, Gaithersburg, MD), and 200 μl of Ready-Safe cocktail was added before incubation for at least 12 h and quantification of bound radioligand by scintillation counting (38% efficiency; PerkinElmer Wallac Microbeta Trilux 1450).
H-EBDN binding association studies were carried out using 0.6-ml reaction volumes containing H-EBDN at final concentrations of 100, 333, 667, and 1000 pM and 100 μl of membranes (typically 1-2 μg of protein and ∼15 fmol of binding sites). Reaction times varied between 0 and 75 min, and samples were processed as for radioligand competition studies. H-EBDN dissociation studies involved reactions at 1 nM as for association studies but carried out for 2 h before nicotine was added to a final concentration of 100 μM to initiate dissociation. Control samples not supplemented with nicotine or supplemented with nicotine throughout were used to check for degradation of binding sites during the course of the assay. This chemical dilution protocol to study kinetics of H-EBDN dissociation was used instead of a physical dilution design because it seemed that H-EBDN and/or its binding sites degraded during the necessarily long times at high dilution required for physical dilution studies (data not shown).
86Rb+Efflux Assays. Cells were harvested at confluence from 100-mm plates by mild trypsinization (Irvine Scientific, Santa Ana, CA) before being resuspended in complete medium and evenly seeded at a density of one confluent 100-mm plate per 24-well plate (Falcon Plastics, Oxnard, CA; ∼100-125 μg of total cell protein per well in a 500 μl volume). After cells had adhered (generally overnight, but no sooner than 4 h later), medium was removed and replaced with 250 μl per well of complete medium supplemented with ∼300,000 cpm of 86Rb+ (PerkinElmer Life Sciences; counted at 40% efficiency using Cerenkov counting and the PerkinElmer Tri-Carb 1900 liquid scintillation analyzer). After at least 4 h and typically overnight, 86Rb+ efflux was measured using the “flip-plate” technique (Lukas et al., 2002). Briefly, after aspiration of the bulk of 86Rb+ loading medium from each well of the “cell plate”, each well containing cells was rinsed three times with 2 ml of fresh 86Rb+ efflux buffer (130 mM NaCl, 5.4 mM KCl, 2 mM CaCl2, 5 mM glucose, and 50 mM HEPES, pH 7.4) to remove extracellular 86Rb+. After removal of residual rinse buffer by aspiration, the flip-plate technique was used again to simultaneously introduce fresh efflux buffer containing drugs of choice at indicated final concentrations from a 24-well “efflux/drug plate” into the wells of the cell plate. After a 3-min incubation, the solution was “flipped” back into the efflux/drug plate, any remaining medium was removed by aspiration, and the cells in the cell plate were lysed and suspended by addition of 2 ml of 0.1 M NaOH, 0.1% SDS to each well. Suspensions in each well were then subjected to Cerenkov counting (PerkinElmer Wallac Micobeta Trilux 1450; 25% efficiency) after placement of inserts (PerkinElmerWallac 1450-109) into each well to minimize cross-talk between wells. For each experiment, normalization and quality control measurements were made of total 86Rb+ efflux in samples containing a fully efficacious dose of 1 mM carbamylcholine and of nonspecific 86Rb+ efflux measured using either samples containing 1 mM carbamylcholine plus 100 μM mecamylamine, which gave full block of agonist-induced or spontaneous, nAChR-mediated ion flux, or samples containing efflux buffer alone to assess any contributions caused by spontaneous nAChR-mediated ion flux. Intrinsic agonist activity of test drugs was ascertained in samples containing that drug only at different concentrations and was normalized, after subtraction of nonspecific efflux, to specific efflux assessed using carbamylcholine and efflux-buffer-only controls. Antagonist activity was determined for test drugs at different concentrations in the presence of 1 mM carbamylcholine and was normalized, after subtraction of nonspecific efflux, to specific efflux ascertained using carbamylcholine and efflux buffer-only controls. 86Rb+ in both cell plates and efflux/drug plates was periodically determined to ensure material balance (i.e., that the sum of 86Rb+ released into the efflux/drug plate and 86Rb+ remaining in the cell plate were the same for each well) and to determine efficiency of 86Rb+ loading (the percentage of applied 86Rb+ actually loaded into cells). Specific 86Rb+ efflux was determined in absolute terms and as a percentage of loaded 86Rb+. Depending on cell density and the concentration of 86Rb+ in the loading medium, SH-EP1-hα4β2 cells typically display specific efflux of 5,000 to 15,000 cpm of 86Rb+ per sample with a ratio of total to nonspecific efflux of 10:1, and total efflux is about half of loaded 86Rb+.
Data Analysis. Parameters [dissociation constant KD and maximum binding level Bmax; B = Bmax/(1 + (KD/X)nH)] for specific radioligand binding were determined from nonlinear graphic analysis (Prism; GraphPad Software, San Diego, CA) of plots of specific binding, B, as a function of the free concentration of radioligand, X, and for Hill coefficient, nH, for each sample, where specific binding was defined as total minus nonspecific binding, and nonspecific binding was calculated from linear regression analysis of H-EBDN binding in the presence of 100 μM nicotine. A Scatchard analysis was also done for illustrative purposes, but not to determine specific binding parameters. Initial radioligand binding competition studies were done under conditions of ligand depletion (in the presence of 100 pM H-EBDN); i.e., samples were used in which greater than 10% of the radioligand was bound, meaning that free radioligand concentrations could not be assumed to be equal at equilibrium to their initial values or equal across samples and that nonspecific binding could not be assumed to be the same for samples with the same total concentration of radioligand. Iterative nonlinear regression fits to the data using equations for homologous or heterologous competition binding with radioligand depletion (Prism) gave reasonably consistent measures of IC50 and Ki values for most, but not all, ligands. Therefore, data presented derive only from studies done to eliminate ligand depletion (i.e., at an initial H-EBDN concentration of 400 pM). Specific binding, B, as a function of competing drug concentration, X, was plotted and fit to the Hill equation, B = Bmax /(1 + (X/IC50)nH) for competing drug concentration to give half-maximal inhibition of radioligand binding, IC50, control specific binding Bmax, and the Hill slope, nH (Prism). Radioligand association studies were analyzed by iterative nonlinear regression using the equation for a monophasic exponential process Y = Ymax (1 - e-kt), for association constant, k (kon or k1), and maximal binding, Ymax (Prism). Radioligand dissociation studies were analyzed by iterative nonlinear regression using the equation for a monophasic exponential process Y = Ymax (e-kt), for dissociation constant, k (koff or k-1), and maximal binding, Ymax, where the asymptotic approach at long t was set to zero (Prism). Ion flux assays also were fit to the Hill equation, but they made measures of specific ion flux, F, as a percentage of control, Fmax, and determined EC50 (n > 0 for agonists) or IC50 (n < 0 for antagonists) values (Prism). In some cases, biphasic dose-ion flux response curves were evident and were fit to a two-phase Hill equation from which EC50 and Hill coefficients for the rising, agonist phase and IC50 and Hill coefficients for the falling, self-inhibitory phase could be determined (Prism). Most ion flux data were fit allowing maximum and minimum ion flux values to be determined by curve fitting, but in some cases in which antagonists or agonists had weak functional potency, minimum ion flux was set at 0% of control or maximum ion flux was set at 100% of control, respectively.
Materials. All other techniques and commercial sources for reagents were as indicated earlier (Lukas, 1986; Bencherif and Lukas, 1993; Peng et al., 1999).
Results
SH-EP1-hα4β2 cells, positive for human α4 and β2 subunit message and isolated based on their expression of functional hα4β2-nAChR, were subjected to H-EBDN binding saturation assays under conditions that eliminated or minimized confounding effects of ligand depletion that can occur with such a high-affinity radioligand. The results of a typical binding saturation profile are shown in Fig. 1, and results from three independent studies yielded an average macroscopic KD value (value shown on Fig. 1) of 10.1 ± 1.4 pM, consistent with the presence of a single class of noninteracting binding sites. Bmax values derived from these studies using 1 to 9 μg of membrane protein per assay were 14.4 ± 0.3 fmol/assay, yielding a concentration of hα4β2-nAChR H-EBDN binding sites of between 1,600 and 14,000 fmol/mg. Although not studied systematically, variation in Bmax values reflected differences in cell passage (sometimes higher passage leads to loss of nAChR expression) and/or cell plating density at the time of harvest for assay (highest expression occurs for cells near confluence). These results showed that heterologously expressed hα4β2-nAChR engage in very high-affinity, specific binding of H-EBDN.

Saturation analysis for [3H]EBDN binding to a SH-EP1-hα4β2 cell membrane preparation. Reaction mixtures containing ∼1 to 5 μg of membrane protein from SH-EP1-pcDNA-hα4β2 cells and [3H]EBDN at the indicated final concentrations (abscissa; free radioligand; picomolar) were processed for 3 h to determine specific [3H]EBDN binding (○; ordinate; femtomoles). Nonspecific binding determined using samples containing 100 μM nicotine was defined by the equation [(350[[3H]EBDN] (nanomolar)) + 6] fmol/mg and was ∼14% of total binding at 100 pM [3H]EBDN. Results from the illustrated study yielded a KD value (± S.E.M.) of 8.39 ± 0.76 pM and a Bmax value (± S.E.M.) of 14.4 ± 0.3 fmol for this preparation (r2 = 0.99). Bmax values determined from independent repeated saturation binding assays using other preparations were 4.8 ± 0.3 pmol/mg of membrane protein for a mean (± S.E.M.) KD value of 10.1 ± 1.4 pM. Inset, Scatchard plot of bound/free [3H]EBDN (▾; ordinate; femtomoles/picomolar) versus bound [3H]EBDN (abscissa; femtomoles).
Association rate kinetics studies showed that H-EBDN binding to hα4β2-nAChR in SH-EP1-hα4β2 cells occurs as a single phase of interaction (Fig. 2). Observed rates of HEBDN binding varied between 0.13 and 0.78 min-1 (half-times of 0.89-5.3 min) with H-EBDN concentration between 0.1 and 1 nM. A plot (Fig. 2, inset) of observed association rates versus H-EBDN concentration yielded a slope corresponding to k1 of 0.74 ± 0.02 min-1 nM-1 and a y-intercept corresponding to k-1 of 0.046 ± 0.012 min-1, yielding a microscopic KD of 62 pM, substantially higher than the measured macroscopic KD. Because of concern that the estimate of k-1 from these studies might be misleading, independent empirical studies of dissociation kinetics were done. These revealed a slower apparent dissociation rate of 0.013 ± 0.001 min-1 (half-time of ∼53 min; simple monophasic decay indicative of a single class of noninteracting sites), yielding a microscopic KD of 18 pM (Fig. 3), in better agreement with the macroscopic KD determination.

[3H]EBDN association rate studies. Reaction mixtures containing SH-EP1-hα4β2 cell membrane preparations (typically containing ∼3 μg of protein) and 0.1 (•), 0.33 (○), 0.67 (▪), or 1 nM (□) [3H]EBDN were incubated for the indicated times (abscissa; minutes) before being processed for determination of specific [3H]EBDN binding (ordinate; counts per minute). Lines drawn through the data points are best fit curves (r2 = 0.97 to 0.98 for all curves; data points are averages from three independent studies) yielding k1 obs values of 0.13 ± 0.01 at 0.1 nM, 0.28 ± 0.01 at 0.33 nM, 0.56 ± 0.08 at 0.67 nM, and 0.78 ± 0.06 at 1 nM [3H]EBDN and half-times for association ranging between 5.3 and 0.89 min at 0.1 and 1 nM [3H]EBDN, respectively. Inset: plots of k1 obs (ordinate; per minute) as a function of [[3H]EBDN] (abscissa; nanomolar) have a slope (k1 value) of 0.74 ± 0.02 min-1 nM-1 and a y-intercept (k-1 value) of 0.046 ± 0.012 min-1.

[3H]EBDN dissociation rate studies. Reaction mixtures containing SH-EP1-hα4β2 cell membrane preparations (typically containing ∼1 to 5 μg of protein) and 1 nM [3H]EBDN were incubated for 2 h before addition to a final concentration of 100 μM nicotine at “time 0” before separation of free from bound [3H]EBDN at the indicated times (abscissa; minutes) to allow determination of specific [3H]EBDN binding (○; ordinate; fraction of control; data points are averages from three independent studies). The line drawn through the data points is the best fit curve yielding an apparent rate constant for dissociation of 0.013 ± 0.001 min-1. Inset, same data as in the main graph but plotted on the y-axis as B/B0 on a log scale.
To assess the uniformity of expression of nAChR subunit protein across cells, and as a guide for electrophysiological studies (see Wu et al., 2001, for preliminary descriptions of findings to be described in detail elsewhere), immunofluorescence analysis of nAChR α4 and β2 subunit expression was done. There was no staining of control, untransfected SHEP1 cells using either antibody, and there was no staining of a cell line expressing human α4 and β4 subunits with the anti-β2 subunit antibody (negative control results not shown). However, cell surface immunostaining of SH-EP1-hα4β2 cells with either α4 or β2 subunits was positive and revealed comparable patterns of antigen distribution, with virtually every cell showing some evidence of surface expression (Fig. 4). In many cases, staining was bright and punctate, suggesting clustering of hα4β2-nAChR. Staining also was evident in processes emanating from cell bodies, often at the tips of such processes, and puncta from adjacent cells were sometimes in close apposition.

Immunofluorescence staining of α4 and β2 subunits. SH-EP1-hα4β2 cells were probed using primary monoclonal antibodies against either α4 (a′, b′) or β2 (c′) subunits, biotinylated secondary antibody, and avidin-Alexa 488 or in the absence of primary antibody (a, b, c) as described under Materials and Methods. Epifluorescence images were taken at 200χ (a, a′) or 600χ (b, b′, c, c′) magnification (calibration bars for each magnification set are 50 μm).
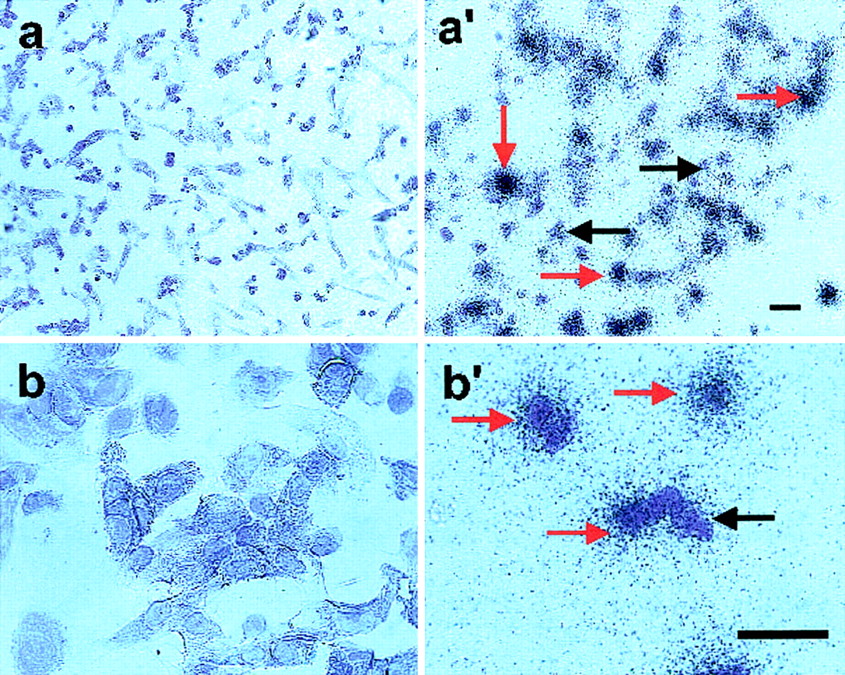
As another approach to ascertain the uniformity of expression of hα4β2-nAChR across cells, and also to guide electrophysiological studies, I-EBDN-receptor binding autoradiography was executed (Fig. 5). Studies using SH-EP1-hα4β2 cells treated with I-EBDN in the presence of excess nicotine to define nonspecific binding and cell labeling showed minimal silver halide grain development over cell bodies and very low overall silver halide grain development defined as background. By contrast, cells treated without nicotine and incubated only in I-EBDN to define total binding exhibited dense silver halide grain development over cell bodies, especially over populations of cells that were tightly packed together. Silver grain development over individual cells could be distinguished within intercellular boundaries (i.e., where cells were in close proximity) and on solitary cells. More than 80% of cells showed some labeling, and about 35% of cells were heavily labeled.

I-EBDN-receptor binding autoradiography. SH-EP1-hα4β2 cells were treated with I-EBDN in the presence of 10 mM nicotine to define nonspecific binding (left; a, b) or with I-EBDN alone to define total binding (right; a′, b′). Red arrows on the right indicate areas of specific I-EBDN binding, and black arrows indicate unlabeled cells. The higher level of diffuse staining seen in a′ and b′ as well as the intense staining over cell bodies in these images are both hallmarks of specific I-EBDN binding. Images were taken at 200χ (a, b) or 400χ (a′, b′) magnification (calibration bars for each image are 50 μm)
Radioligand binding competition studies done under conditions to eliminate, minimize, or account for ligand depletion indicated that unlabeled epibatidine is the most potent of the drugs used to inhibit specific H-EBDN binding to hα4β2-nAChR in transfected SH-EP1 cell membrane preparations (Fig. 6; Table 1). All nicotinic agonists were able to fully block H-EBDN binding, having rank order binding inhibition potency and IC50 values of: 490 pM epibatidine (EBDN) » 10 nM cytisine > 81 nM nicotine » 740 nM acetylcholine (ACh) ∼ 830 nM 1,1-dimethyl-4-phenyl-piperazinium (DMPP) » 6.0 μM carbamylcholine ≥7.1 μM acetylthiocholine » 290 μM choline. Lobeline (IC50 = 76 nM) had ligand binding competition potency greater than any antagonist and like that of nicotine, and suberyldicholine (IC50 = 520 nM) had ligand binding competition potency like that of acetylcholine (Fig. 6, Table 1). Of the antagonists tested, only dihydro-β-erythroidine (DHβE) gave high affinity, full (over the concentration ranges actually studied) blockade of HEBDN binding (IC50 = 3.5 μM; Fig. 6, Table 1). Rank order binding inhibition potency and IC50 values for the other antagonists were: 52 μM decamethonium ≥ 81 μM d-tubocurarine ∼ 95 μM methyllycaconitine (MLA) ≥ 120 μM succinylcholine > 760 μM alcuronium ∼ 980 μM vecuronium > 1.9 mM hexamethonium ∼ 2.3 mM pancuronium » 1 mM eserine (Fig. 6, Table 1). Mecamylamine (data not shown) exhibited no inhibition at all up to 100 μM.
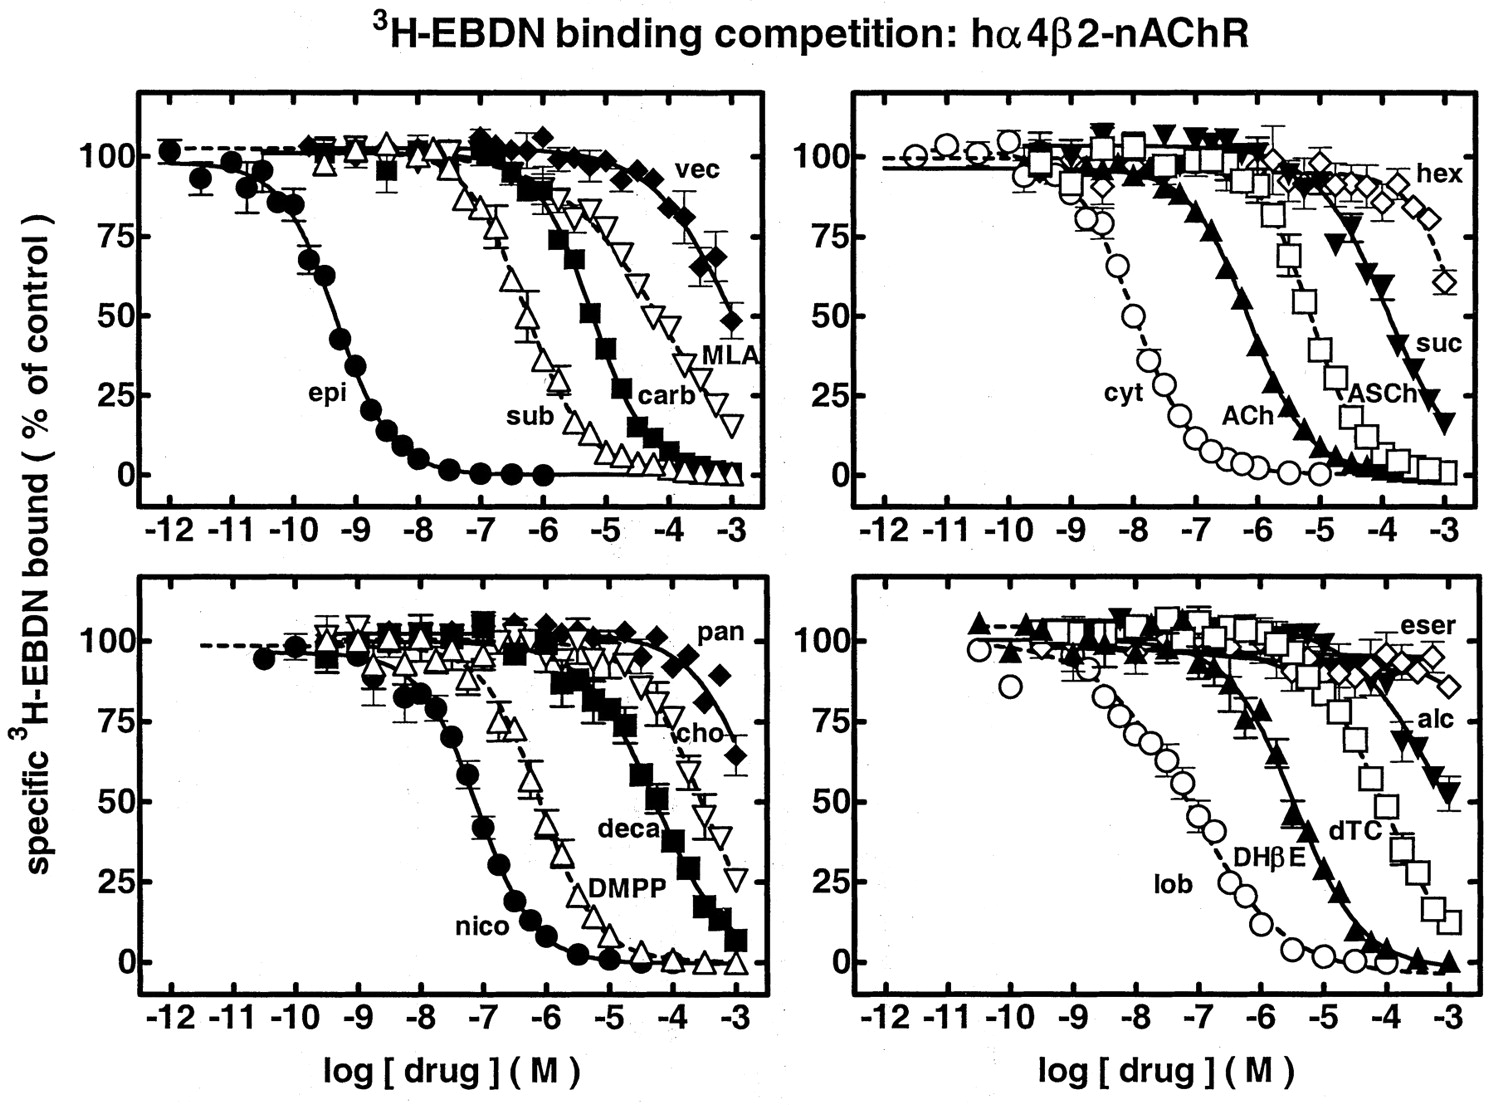
Ligand competition profiles for blockade of specific [3H]EBDN binding to sites on SH-EP1-hα4β2 cells. Reaction mixtures containing SH-EP1-hα4β2 cell membrane preparations (typically containing ∼1 to 5 μg of protein), 400 pM [3H]EBDN, and the indicated drugs were used to assess the concentration dependence (abscissa; molar, log scale) for competition toward specific [3H]EBDN binding (ordinate; percentage of control). Results are the averages of at least three separate experiments. Competition profiles for: top left, Epibatidine (epi; •), suberyldicholine (sub; ▵), carbamylcholine (carb; ▪), MLA (▿) and vecuronium (vec; ♦); top right, cytisine (cyt; ○), ACh (▴), acetylthiocholine (ASCh; □), succinylcholine (suc; ▾) and hexamethonium (hex; ⋄); bottom left, nicotine (nico; •), DMPP (▵), decamethonium (deca; ▪), choline (cho; fl) and pancuronium (pan; ♦); and bottom right, lobeline (lob; ○), DHβE (▴), d-tubocurarine (dTC; □), alcuronium (alc; ▾) and eserine (eser; ⋄). Log IC50 values and Hill coefficients (± S.E.M.) are provided in Table 1, and IC50 or Ki values are indicated in the text or in Table 3. Maximum and minimum values for specific [3H]EBDN binding obtained from curve fitting were 100 ± 5% or 0 ± 5%, respectively, of control specific binding except for methyllycaconitine (minimum of -11 ± 10% of control) and alcuronium (maximum of 107 ± 2% of control), and except for fits to the Hill equation for pancuronium, vecuronium, alcuronium, decamethonium, succinylcholine, eserine, choline, and hexamethonium, which were based on minimum binding values fixed at 0% of control specific binding. Mecamylamine showed no inhibition at all up to a concentration of 100 μM.
Parameters for drug competition toward specific [3H]EBDN binding to hα 4β2-nAChR in transfected SH-EP1 cells
Radioligand binding competition assays were conducted as described under Materials and Methods and in the legend to Fig. 6. Results were fit to the logistic equation to determine log IC50 values (± S.E.M.), mean IC50 values, and Hill coefficients (± S.E.M.).
Function of hα4β2-nAChR expressed in transfected SHEP1 cells was assessed using 86Rb+ efflux assays (electrophysiological characterization of hα4β2-nAChR will be reported in a different series of communications; e.g., see Wu et al., 2001). Agonist log dose-response profiles show simple, sigmoid shapes and full functional efficacy for EBDN, ACh, and carbamylcholine; bell shapes for nicotine (∼full efficacy) and suberyldicholine (low efficacy); sigmoid shapes but sub-maximal efficacy for cytisine, DMPP, and perhaps acetylthiocholine; and very weak potency for choline (Fig. 7, Table 2). Lobeline (not shown) and succinylcholine had negligible efficacy. Rank order agonist potency and EC50 values (maximum efficacy in parentheses) were: 8.5 nM epibatidine (100%) » 850 nM nicotine (104%) > 1.3 μM cytisine (40%) ∼ 1.3 μM suberyldicholine (13%) ∼ 1.7 μM ACh (104%) ∼ 1.9 μM DMPP (80%) > 17 μM carbamylcholine (97%) > 100 μM acetylthiocholine (75%) » 3.8 mM (estimated) choline (22% at 1 mM). Self-inhibitory IC50 values were also determined for nicotine (5.8 mM) and suberyldicholine (200 μM; Table 2).

Agonist dose-response profiles for stimulation of hα4β2-nAChR function. Specific 86Rb+ efflux (ordinate; percentage of control) was determined as described under Materials and Methods in the presence of the indicated concentrations (abscissa; log molar scale) of: top, Epibatidine (epi; •), ACh (▿), carbachol (carb; ▪), cytisine (cyt; ▵), or succinylcholine (⋄); bottom, nicotine (nico; ○), DMPP (▾), suberyldicholine (sub; ⋄), acetylthiocholine (ASCh; □), or choline (chol; ▴). Log EC50 values and Hill coefficients (± S.E.M.) are provided in Table 2, and EC50 values are indicated in the text and in Table 3. Self-inhibitory IC50 values are indicated in parentheses in Table 3, and corresponding log IC50 values and Hill coefficients are indicated in Table 2.
Parameters for agonist and/or antagonist action at hα 4β 2-nA ChR.
86Rb+ efflux assays were conducted as described under Materials and Methods and in the legends to Figs. 7 and 8. Results were fit to the logistic equation to determine log EC50 values (for agonists) or IC50 values (for antagonists) and Hill coefficients (presented ± S.E.M.). Functional log IC50 values and Hill numbers given in parentheses for nicotine and suberyldicholine are from fits to the self-inhibitory phase of agonist dose-response profiles for those drugs.
Antagonist log dose-response profiles showed full inhibition of hα4β2-nAChR function stimulated by 1 mM carbamylcholine (Fig. 8; Table 2). Rank order antagonist potency and IC50 values (Fig. 8; Table 2) were: 470 nM mecamylamine > 1.5 μM DHβE > 6.6 μM MLA > 11 μM hexamethonium > 21 μM lobeline ≥ 26 μM alcuronium ∼ 28 μM vecuronium > 62 μM d-tubocurarine > 91 μM pancuronium > 130 μM eserine ≥ 300 μM decamethonium > 360 μM suberyldicholine. Succinyldicholine and α-bungarotoxin had negligible antagonist activity out to 1 mM and 1 μM, respectively.

Antagonist dose-response profiles for blockade of hα4β2-nAChR function. Specific 86Rb+ efflux (ordinate; percentage of control) was determined in the presence of 1 mM carbamylcholine as described under Materials and Methods alone or in the presence of the indicated concentrations (abscissa; log molar scale) of: top, mecamylamine (mec; ▪), hexamethonium (hexa; fl), vecuronium (vec; ▴), eserine (eser; ○), or succinylcholine (suc; ♦); middle, DHβE (□), lobeline (lob; ▾), d-tubocurarine (dTC; ▵), or decamethonium (deca; •); bottom, MLA (▪), alcuronium (alc; ▿), pancuronium (pan; ▴), or suberyldicholine (sub; ○). Log IC50 values and Hill coefficients (± S.E.M.) are provided in Table 2, and functional IC50 values are indicated in the text and in Table 3. Maximum and minimum values for specific 86Rb+ efflux obtained from curve fitting were 100 ± 5% or 0 ± 5%, respectively, of control values except for decamethonium (maximum of -107 ± 1% of control), and except for fits to the Hill equation for pancuronium, decamethonium, and eserine, which were based on minimum specific efflux values fixed at 0% of control.
When agonist dose-response studies were done alone or in the presence of antagonists at concentrations near their IC50 values (Fig. 9), profiles obtained revealed that block by DHβE, MLA, or decamethonium was surmountable by increasing agonist concentrations, suggesting a competitive mechanism of inhibition of function. By contrast, block by mecamylamine or eserine was not surmountable at higher agonist concentrations (Fig. 9), suggestive of a noncompetitive mechanism of action. EC50 values for carbamylcholine in the presence of pancuronium, hexamethonium, or d-tubocurarine were higher than in the absence of antagonists, but surmountability of block was not clearly evident, suggesting a mixture of competitive and noncompetitive block (Fig. 9). These suggestions were corroborative with indications from radioligand binding competition assays (see Table 3). For example, those antagonists suggested by functional assays to be noncompetitive inhibitors inhibited H-EBDN binding not at all or at concentrations much higher than those needed to inhibit function. By contrast, those antagonists exhibiting competitive mechanisms of functional block inhibited binding of H-EBDN at concentrations more consistent with their functional IC50 values.

Mechanisms of antagonist block of hα4β2-nAChR function. Specific 86Rb+ efflux (ordinate; percentage of control) assays were done as described under Materials and Methods for samples challenged with the indicated dose (abscissa, log molar scale) of agonist alone (• for carbamylcholine, 98 ± 5% efficacy, -4.77 ± 0.08 log EC50; ▪ for ACh, 99 ± 3% efficacy, -5.80 ± 0.07 log EC50) or of agonist in the presence of 500 nM mecamylamine (○; top left; 52 ± 6% efficacy, -4.70 ± 0.20 log EC50), 100 μM hexamethonium (○; 76 ± 4% efficacy, -4.03 ± 0.08 log EC50) or 10 μM hexamethonium (▵; top right; 51 ± 4% efficacy, -3.83 ± 0.20 log EC50), 1 μM dihydro-β-erythroidine (○; upper middle left; 99 ± 2% efficacy, -2.40 ± 0.06 log EC50), 3 μM dihydro-β-erythroidine (▵; upper middle left; fix at 100% efficacy, -1.84 ± 0.16 log EC50), 10 μM methyllycaconitine (○; upper middle right; 99 ± 4% efficacy, -3.20 ± 0.04 log EC50), 250 μM decamethonium (○; lower middle left; 102 ± 5% efficacy, -3.70 ± 0.07 log EC50), 30 μM d-tubocurarine (○; lower middle right; 68 ± 6% efficacy, -3.52 ± 0.17 log EC50), 100 μM d-tubocurarine (▵; lower middle right; 31 ± 4% efficacy, -3.41 ± 0.21 log EC50), 100 μM eserine (□; bottom left; 71 ± 4% efficacy, -5.90 ± 0.16 log EC50), or 60 μM pancuronium (○; bottom right; 33 ± 47% efficacy, -3.88 ± 0.54 log EC50). Carbamylcholine was the agonist used in all cases except for in studies using eserine, for which acetylcholine was the agonist.
Parameters for interactions of indicated drugs with hα 2-nAChR in transfected SH-EP1 cells.
Results presented in Figs. 6, 7, 8, 9 and in Tables 1 and 2 are summarized. Functional EC50 values for agonists, (column 2), functional IC50 values for antagonists (column 3; functional IC50 values given in parentheses for nicotine and suberyldicholine from fits to the self-inhibitory phase of agonist dose-response profiles for those drugs), and [3H]EBDN binding competition Ki values (column 4), all in micromolar, are expressed to allow comparisons between functional and radioligand binding competition affinities for the indicated ligands (drug; column 1). Also indicated (F/B; column 5) is the ratio between the functional EC50/IC50 and the binding competition Ki value (based on the IC50 value but corrected for the concentration of H-EBDN used in those assays and for the H-EBDN binding Kd of 10 pM using the Cheng-Prusoff correction) for each ligand. The notations after the drug name for selected ligands indicate, from results shown in Fig. 9, functional antagonism actions as a noncompetitive inhibitor (N), a competitive inhibitor (C), or a mixed competitive/noncompetitive inhibitor (N/C).
To lend insight into relationships between hα4β2-nAChR ligand binding and functional effects, functional EC50 or IC50 values from 86Rb+ ion flux assays and H-EBDN binding competition binding Ki values were compared (Table 3). The latter values were derived from binding competition IC50 values using the Cheng-Prusoff correction (Ki = IC50/[1+ (400/10)] for an H-EBDN KD for interaction at hα4β2-nAChR of 10 pM and a concentration of H-EBDN used in the radioligand binding competition assays of 400 pM). The Cheng-Prusoff correction for EBDN competition toward H-EBDN binding gives a Ki value of 12 pM, in reasonably good agreement with the saturation binding KD value of 10 pM. In principle, the Cheng-Prusoff correction also could be applied to functional IC50 values (obtained using 1 mM carbamylcholine, which has a functional EC50 value of 17 μM). However, because this correction theoretically would apply only to competitive antagonists, and mechanisms of action were not established for all of the antagonists studied, the correction was not applied. Nevertheless, the ratio F/B of functional EC50 or IC50 to the binding competition Ki was calculated and is presented in the last column of Table 3 to guide interpretation and discussion of the results. Of the agonists examined, only cytisine has a ligand binding competition IC50 value that is out of rank with agonist functional EC50 values, yielding a high functional/binding affinity ratio (F/B = 5300; Table 3). The other agonists fall into two classes, those with F/B ratios of ∼100 (suberyldicholine, ACh, DMPP, carbamylcholine), indicating that their affinity for the H-EBDN-binding state is ∼100-fold higher than their affinity for the basal, nonfunctional state of hα4β2-nAChR, and those with F/B ratios of ∼400 to 700 (EBDN, nicotine, acetylthiocholine, choline) displaying even higher relative affinity for the HEBDN-binding state. Interestingly, lobeline is the only antagonist that has a comparatively high F/B ratio (11000), suggesting that it has ∼4 orders of magnitude higher affinity for the H-EBDN-binding state than for the functional, basal state. Of the other antagonists, succinylcholine and decamethonium have agonist-like F/B ratios, suggesting higher affinity interaction with the H-EBDN-binding state than expected based on their functional inhibitory potencies. F/B ratios are between 1 and 2 for classic curarimimetics such as pancuronium, vecuronium, and alcuronium, suggesting close correspondence between their binding affinities for sites involved in functional agonist and H-EBDN binding. By contrast, the F/B ratio for mecamylamine is <0.02, consistent with its demonstrated noncompetitive mechanism of hα4β2-nAChR functional block. However, F/B rations range between 31 for d-tubocurarine and 0.24 for hexamethonium, agents with mixed competitive/noncompetitive actions, and between 230 and 2.8 for competitive antagonists decamethonium and MLA (with DHβE having an intermediate F/B ratio). Thus, the broad distribution of F/B ratios across and within classes of agonists, competitive antagonists, and noncompetitive/mixed antagonists indicates that this simplified method of analysis may not adequately describe hα4β2-nAChR-ligand interactions.
Discussion
The major findings of this study are that human α4β2-nAChR can be stably transfected into native nAChR-null SH-EP1 human epithelial cells, express high affinity for the radioligand H-EBDN, exhibit generally higher binding affinity for agonists than for antagonists, and display functional properties notable for high-affinity agonism by EBDN and nicotine and high-affinity antagonism by mecamylamine and DHβE.
The success reported here in generating a stably transfected SH-EP1 cell line heterologously expressing hα4β2-nAChR provides a model system for studies of α4β2-nAChR other than the lines developed using HEK cells and under restricted availability from labs in the private sector (Buisson et al., 1996, 2000; Gopalakrishnan et al., 1996, 1997; Buisson and Bertrand, 2001). Excellent expression of functional α4β2-nAChR assayable using ion flux (current study; Ferchmin et al., 2001), electrophysiological (see Wu et al., 2001), or calcium imaging techniques (Pacheco et al., 2001) has been achieved, giving advantage over transfected cell lines expressing rat α4β2-nAChR-like binding sites but not yet shown to express high levels of functional receptors (Cooper et al., 1999; Shafaee et al., 1999). The expression of hα4β2-nAChR from entirely wild-type subunits and for cells maintained using conventional techniques has advantages over other model systems that have employed altered incubation temperatures or have resorted to creation of chimeric subunits with transmembrane and cytoplasmic domains from non-nAChR subunits to get good surface and functional expression (Cooper et al., 1999). Immunofluorescence and receptor binding autoradiographic analyses indicate that virtually all cells from the isolated clone make both α4 and β2 subunit proteins and binding sites. These analyses suggest that ligand binding site activity and subunit gene transcription is relatively stable and at least evident through the cell cycle. These analyses, ligand binding studies, and functional assessments also indicate that expression of hα4β2-nAChR is relatively stable and at least evident through cell passage.
H-EBDN binding profiles for hα4β2-nAChR expressed in transfected SH-EP1 cells match in many ways those for other preparations heterologously or naturally expressing human/mammalian α4β2-nAChR (Lukas, 1990; Houghtling et al., 1994, 1995; Gopalakrishnan et al., 1996). IC50 values are difficult to compare for experiments done using different radioprobes and conditions, and Ki values do not always match precisely across experiments, perhaps because of species differences in the α4β2-nAChR being assayed. Nevertheless, the rank order for competing ligands is very similar across these studies. Moreover, these studies all show a striking imbalance between agonist and antagonist affinities for α4β2-nAChR binding sites, whether they be identified using radiolabeled EBDN, nicotine, ACh, methylcarbamylcholine, or cytisine (Romano and Goldstein, 1980; Marks and Collins, 1982; Schwartz et al., 1982; Abood and Grassi, 1986; Lukas, 1990; Pabreza et al., 1991; Houghtling et al., 1994, 1995; Gopalakrishnan et al., 1996). There is a clear lack of inhibition of radioagonist binding by mecamylamine or hexamethonium, but this can be rationalized based on their actions as functional noncompetitive antagonists that must have higher affinity interactions at sites distinct from the agonist binding domain. In absolute terms, Ki values for blockade of radioligand binding to heterologously expressed hα4β2-nAChR in SH-EP1 cells (this study; competition toward H-EBDN binding) or in HEK cells (Gopalakrishnan et al., 1996; competition toward [3H]cytisine binding) are within a factor of 2 except for EBDN (12 pM in this study but 70 pM in Gopalakrishnan et al., 1996). This could reflect influences of ligand depletion in the latter study, because extremely high-affinity binding of EBDN or other nicotinic agonists to hα4β2-nAChR when heterologously expressed at high levels means that caution need be applied in conduct and interpretation of radioligand binding assays. It also means that ligand depletion in functional studies could occur at low agonist doses, but in practice this is not an evident problem because of the lower affinity functional EC50 vales for agonists compared with radioligand binding Ki or even IC50 values.
With regard to functional properties of hα4β2-nAChR, high sensitivities to antagonism by mecamylamine or DHβE seem to be distinguishing characteristics, as are high sensitivities to agonist action of EBDN or nicotine. Ion flux assays indicate that choline has about 20 to 25% efficacy at 1 mM when acting at hα4β2-nAChR, meaning that its functional potency at hα4β2-nAChR is not very different from its potency at rat α7-nAChR in hippocampal neurons (Albuquerque et al., 1998). Cytisine, DMPP, and suberyldicholine are partial agonists at hα4β2-nAChR, and nicotine and suberyldicholine also exhibit self-inhibitory activity at higher doses. There was no convincing evidence for a two-site fit to agonist functional dose-response profiles, as has been seen by others using electrophysiological rather than ion flux assays and the HEK293 cell host instead of SH-EP1 cells (Buisson and Bertrand, 2001). Placement of constraints on curve fitting parameters did not yield two-site fits that were any better statistically than one-site fits, and the current results used comparatively dense, one-third log unit drug concentration profiles to derive those fits. The possibility of differences in host cell influences on properties of nAChR underscores the need to develop heterologous expression in different models but also indicates that studies in neurons of native nAChR will ultimately be required.
In contrast to the tight relationships between radioligand binding competition-derived Ki values for hα4β2-nAChR expressed in two different mammalian cell hosts, comparisons of absolute functional agonist or antagonist potencies at heterologously expressed hα4β2-nAChR expressed in different systems reveal some striking similarities or differences (Table 4). For example, membrane potential fluorescence-based measurements of agonist-activated, human α4β2-nAChR function in transfected HEK cells (Fitch et al., 2003) give nearly perfect agreement with ion flux-based assays of agonist action at SH-EP1 cell-expressed human α4β2-nAChR (this study; Table 4). EC50 values for EBDN and DMPP and IC50 values for the competitive antagonist, DHβE, agree within a factor of 2 for expression in SH-EP1 or HEK cells and for function measured using ion flux assays (Table 4; this study and Gopalakrishnan et al., 1996), although discrepancies are evident for nicotine, cytisine, and ACh. Whole-cell current recording from transfected HEK cells (Buisson et al., 1996) yields EC50 values for nicotine and ACh in good agreement with the SH-EP1 cell ion flux data (this study; Table 4), although there is a discrepancy for cytisine. Congruence of raw IC50 value data for competitive antagonists might not be expected, because agonist doses used relative to EC50 values often differ across studies. Moreover, the 4- to 20-fold difference in derived IC50 values for DHβE and MLA from this study and from Buisson et al. (1996) may be attributable to their analysis of the effects of antagonists on steady-state, partially desensitized currents rather than on time-integrated ion flux. However, an oocyte, whole-cell recording study (Chavez-Noriega et al., 1997) gives IC50 values for d-tubocurarine and DHβE that are 13- to 20-fold lower than those obtained in the current investigation (Table 4). Moreover, two different whole-cell recording studies using oocytes give 2- to 60-fold higher EC50 values for nicotinic agonists than determined in the current or other studies using cell line expression (Table 4), raising concern about how accurately studies of agonist potency at nAChR is when measured using the oocyte expression system. Nevertheless, rank order functional inhibitory potencies for antagonists are preserved across studies, as are rank-order potencies for EBDN, nicotine, and ACh. The agonists that fall out of rank order across studies are cytisine and DMPP, and perhaps this reflects their partial agonist actions at α4β2-nAChR compounded by very different estimates of their efficacies across studies.
Comparisons of functional EC50 or IC50 values for human α 4β2-nAChR expressed in different systems.
Functional EC50 values for agonists or functional IC50 values for antagonists (all in micromolar) are summarized for studies examining human α 4β2-nAChR heterologously expressed in human SH-EP1 or HEK cells or in oocytes and assessed using 86Rb+ efflux assays, membrane potential fluorescence (Vm fluor), or whole-cell current recording (e'phys) as indicated.
When contrasting functional and radioligand binding competition binding data, the initial intent was to assess usefulness of the approach to discriminate mechanisms of block for drugs acting on nAChR shuttling between states in a classic cyclic reaction scheme (e.g., basal inactivated to agonist-bound activated to agonist-bound desensitized and back to basal states). However, given the broad ranges of F/B functional affinity/binding affinity ratios within and across classes of agonists, competitive antagonists, and noncompetitive antagonists, the results seem to be more supportive of allosteric models in which a variety of channel-open or channel-closed states can exist and in which specific sets of states are stabilized by interactions with different drugs (Edelstein et al., 1996). Factored into this analysis are complicating issues such as differing abilities of agonists to induce short-term loss of nAChR function (i.e., during milliseconds or seconds of drug exposure), with longer-lasting exposure (e.g., for the min of exposure used for 86Rb+ flux assays), or with more long-term exposure (minutes/hours). Moreover, preliminary electrophysiological studies indicate that antagonists can differentially affect peak or steady state whole-cell currents induced by agonists (Wu et al., 2001), perhaps consistent with different affinities for open, closed, and/or desensitized states. Perhaps systematic studies and their analyses, as attempted in the present report will help guide efforts to approaches useful in discriminating different allosteric states of nAChR. Nevertheless, the current studies may indicate that antagonist and epibatidine binding sites on hαβ2-nAChR have little-to-no physical overlap or that these ligands stabilize hα4β2-nAChR conformations that have negligible affinity for the heterologous class of ligands.
Acknowledgments
We thank Dr. June Biedler and Barbara Spengler for SH-EP1 cells and Dr. Lynn Wecker (University of South Florida) for alerting us to α4 subunit sequence differences relative to the reference sequence.
Footnotes
-
Work in Phoenix toward this project was supported by endowment and capitalization funds from the Men's and Women's Boards of the Barrow Neurological Foundation and Epi-Hab Phoenix, Inc. and by grants 9730 and 9615 from the Arizona Disease Control Research Commission, NS40417 from the National Institutes of Health, and 4366 from the Council for Tobacco Research-USA, Inc.. Studies in Bonn were supported by the Deutsche Forschungsgemeinschraft (Ste769/2-1).
-
This article is dedicated to the memory of Jian-Hong Peng and Michelle Zhang.
-
ABBREVIATIONS: nAChR, nicotinic acetylcholine receptor(s); α4β2-nAChR, nicotinic acetylcholine receptor(s) composed of α4 and β2 subunits; hα4β2-nAChR, human α4β2-nAChR; HEK, human embryonic kidney; bp, base pair(s); PBS, phosphate-buffered saline; I-EBDN, 125I-labeled iodo-deschloro-epibatidine; RAZ, Ringer's solution supplemented with 0.1 mg/ml of sodium azide; H-EBDN, [3H]epibatidine; DMPP, 1,1-dimethyl-4-phenyl-piperazinium; ACh, acetylcholine; DHβE, dihydro-β-erythroidine; MLA, methyllycaconitine.
-
↵1 Current address: Department of Neurology, Division of Biology and Biomedical Sciences, Washington University, St. Louis, MO 63110.
- Received May 21, 2003.
- Accepted July 30, 2003.
- The American Society for Pharmacology and Experimental Therapeutics


