


Abstract
Activation of A1 adenosine receptors leads to the inhibition of cAMP accumulation and the stimulation of inositol phosphate accumulation via pertussis toxin-sensitive G-proteins. In this study we have investigated the signaling of the A1adenosine receptor in Chinese hamster ovary (CHO) cells, when expressed at approximately 203 fmol/mg (CHOA1L) and at approximately 3350 fmol/mg (CHOA1H). In CHOA1L cells, the agonistsN 6-cyclopentyladenosine (CPA), (R)-N 6-(2-phenylisopropyl)adenosine, and 5′-(N-ethylcarboxamido)adenosine (NECA) inhibited cAMP production in a concentration-dependent manner. After pertussis toxin treatment, the agonist NECA produced a stimulation of cAMP production, whereas CPA and (R)-N 6-(2-phenylisopropyl)adenosine were ineffective. In CHOAIH cells, however, all three agonists produced both an inhibition of adenylyl cyclase and a pertussis toxin-insensitive stimulation of adenylyl cyclase. All three agonists were more potent at inhibiting adenylyl cyclase in CHOA1H cells than in CHOA1L cells. In contrast, A1 agonists (and particularly NECA) were less potent at stimulating inositol phosphate accumulation in CHOA1H cells than in CHOA1L cells. After pertussis toxin treatment, agonist-stimulated inositol phosphate accumulation was reduced in CHOA1H cells and abolished in CHOA1L cells. The relative intrinsic activity of NECA in stimulating inositol phosphate accumulation, compared to CPA (100%), was much greater in the presence of pertussis toxin (289.6%) than in the absence of pertussis toxin (155.2%). These data suggest that A1 adenosine receptors can couple to both pertussis toxin-sensitive and -insensitive G-proteins in an expression level-dependent manner. These data also suggest that the ability of this receptor to activate different G-proteins is dependent on the agonist present.
The adenosine A1 receptor is a member of the seven-transmembrane G-protein-coupled receptor superfamily (Libert et al., 1992; Olah and Stiles, 1995; Shryock and Belardinelli, 1997). Adenosine A1 receptors couple to pertussis toxin (PTX)-sensitive G-proteins (Gi1, Gi2, Gi3, and Go) and stimulate numerous intracellular signaling events, such as inhibition of adenylyl cyclase, the closure of voltage-sensitive Ca2+ channels on nerve terminals, and the opening of potassium channels (Olah and Stiles, 1995; Figler et al., 1996; Srinivas et al., 1997). Stimulation of A1 receptors also activates inositol phospholipid hydrolysis and calcium mobilization via PTX-sensitive G-proteins in many cell systems. These latter effects have been observed in both cells that express endogenous A1 receptors (Gerwins and Fredholm, 1992; Dickenson and Hill, 1993; Rugolo et al., 1993) and those that have been transfected with the A1 receptor cDNA (Freund et al., 1994; Megson et al., 1995). In addition to these direct effects, adenosine A1 receptor activation can augment inositol phosphate and calcium responses stimulated by GQ-coupled receptors (Gerwins and Fredholm, 1992;Dickenson and Hill, 1993; Megson et al., 1995; Okajima et al., 1995;Peakman and Hill, 1995).
It seems likely that Gi/o βγ-subunits are involved in both the direct coupling of A1receptors to phospholipase C and the augmentation of GQ/11-coupled receptor responses (Gerwins and Fredholm, 1992; Dickenson and Hill, 1998). Expression of Gβγ-scavenging proteins, such as the carboxy terminus of β adrenoceptor kinase 1 (residues 495–689; Koch et al., 1994), can partially attenuate the direct stimulation of phospholipase C by A1-agonists without affecting the inhibition of forskolin-stimulated cAMP accumulation (Dickenson and Hill, 1998). Overexpression of G-protein βγ-subunits also leads to a larger stimulation by a GQ/11-coupled receptor agonist of phospholipase C activity in COS cells (Tomura et al., 1997). A characteristic feature of the activation of phospholipase C-β2 by purified G-protein subunits is the observation that higher concentrations of βγ-subunits are required than αQ/11-subunits (Camps et al., 1992;Gudermann et al., 1997). These data suggest that the potency and efficacy of A1 receptor agonists for inhibition of adenylyl cyclase and for stimulation/augmentation of intracellular calcium signaling and protein kinase C activation (via diacyglycerol derived from agonist-stimulated inositol phospholipid hydrolysis;Nishizuka, 1992; Singer et al., 1997) may differ markedly depending on the level of receptor expression in a given cell or tissue (Kenakin, 1995a,b; MacEwan et al., 1996).
The present study was undertaken to investigate how the potency and relative intrinsic activity of three different A1receptor agonists for inhibition of adenylyl cyclase activity and stimulation of inositol phospholipid hydrolysis change when the expression level of the human A1 receptor is increased. It has been proposed that, at high levels of receptor expression, the fidelity of receptor-effector coupling may be lost, enabling receptors to couple to alternative G-protein families (Gudermann et al., 1997). For example, the adenosine A3 receptor, the 5-HT2Creceptor, and the thrombin receptor have been reported to couple to both Gi/o and GQ/11families of G-protein (Gudermann et al., 1997; Berg et al., 1998). Furthermore, recent evidence has suggested that the relative efficacies of agonists may differ depending on the effector pathway that is activated, raising the possibility of “agonist trafficking” (Kenakin, 1995a,b; Berg et al., 1998). In this study, we provide evidence to support the contention that agonist-selective active states of A1 adenosine receptor exist, which leads to a different stimulus pattern at the level of G-proteins.
Materials and Methods
Expression of Recombinant Human Adenosine A1Receptors in Chinese Hamster Ovary Cells.
The pSVL plasmid containing the human adenosine A1 receptor cDNA was obtained from the American Type Culture Collection. The adenosine A1 receptor cDNA was extracted onBstZ1/ApaI and subcloned into theNotI/ApaI site of the eukaryotic expression vector pcDNA3 to create pcDNA3A1R. CHO-K1 cells (European Collection of Animal Cell Cultures, Porton Down, Salisbury, UK) were transfected with pcDNA3A1R using transfectam [according to the manufacturer's instructions (Promega Corp., Madison WI)]. Stably transfected CHO-K1 cells were selected using 500 μg/ml geneticin (G418; Life Technologies Inc., Gaithersburg, MD) for 2 weeks. CHO-K1 cells resistant to G418 were subsequently cloned by the dilution cloning method. Transfected CHO cells were cultured in 75-cm2 flasks (Costar, Acton, MA) in Dulbecco's modified Eagle's medium/nutrient F-12 (1:1) supplemented with 2 mM l-glutamine, 10% (v/v) fetal calf serum, and 500 μg/ml G418. Cells were maintained at 37°C in a humidified 5% CO2 atmosphere until confluency and were subcultured (1:5 split ratio) using trypsin (0.05% w/v)/EDTA (0.02% w/v) solution. Cells for [3H]inositol phosphate and [3H]cAMP determinations were grown in 24-well cluster dishes (Costar).
Measurement of [3H]cAMP Accumulation.
Confluent cell monolayers were incubated for 2 h at 37°C with 500 μl of Hanks'/HEPES buffer (pH 7.4) containing [3H]adenine (37 kBq/well). The cells were washed once and then incubated in 1 ml/well Hanks'/HEPES buffer containing the cAMP phosphodiesterease inhibitor, rolipram (10 μM) for 15 min at 37°C. Agonists were added (in 10 μl of medium) 5 min before the incubation with 3 μM forskolin (10 min). Incubations were terminated by the addition of 50 μl of concentrated HCl. [3H]cAMP was isolated by sequential Dowex-alumina chromatography as previously described (Megson et al., 1995). After elution, the levels of [3H]cAMP were determined by liquid scintillation counting.
Measurement of [3H]Inositol Phosphate Accumulation.
Confluent cell monolayers were loaded for 24 h with [3H]myo-inositol (37 kBq/well) in 24-well cluster dishes in inositol-free Dulbecco's modified Eagle's medium containing 1% fetal calf serum. Prelabeled cells were then washed once with 1 ml/well Hanks'/HEPES buffer, pH 7.4, and incubated at 37°C for 30 min in the presence of 20 mM LiCl (290 μl/well). Where appropriate antagonists were added at the beginning of this incubation period. Agonists were then added in 10 μl of medium, and the incubation was continued for 40 min (unless otherwise stated) at 37°C. Incubations were terminated by aspiration of the incubation medium and the addition of 900 μl of cold (−20°C) methanol/0.12 M HCl (1:1, v/v). Cells were left a minimum of 2 h at −20°C before isolation of total [3H]inositol phosphates in the supernatant of the disrupted cell monolayers by anion exchange chromatography. Aliquots (800 μl) of the supernatant were neutralized by the addition of 135 μl of 0.5 M NaOH, 1 ml of 25 mM Tris-HCl (pH 7.0), and 3.1 ml of distilled water and added to columns of Dowex 1 anion exchange resin (X8, 100–200 mesh, chloride form). [3H]Inositol and [3H]glycerophosphoinositol were removed with 20 ml of distilled water and 10 ml of 25 mM ammonium formate, respectively. Total [3H]inositol phosphates were then eluted with 3 ml of 1 M HCl, and the columns were regenerated with 10 ml of 1 M HCl followed by 20 ml distilled water. Radioactivity was quantified by scintillation counting in the gel phase (scintillator plus, Packard).
[3H]DPCPX Binding.
CHO cells from two confluent 162-cm2 flasks (which provide sufficient membrane protein for 48 tubes) were detached using Dulbecco's phosphate-buffered saline solution (Sigma Chemical Co., St. Louis, MO) containing 5 mM EDTA at 37°C for 5 min. After centrifugation (150g for 5 min), membranes were prepared by resuspending the cells in 10 ml of ice-cold Tris-EDTA buffer (50:1 mM; pH 7.4), followed by homogenization using a glass homogenizer (approximately 20 strokes) and centrifugation at 20, 000gfor 15 min. The resulting pellet was resuspended in 600 μl of Tris-EDTA buffer and kept on ice until required.
Saturation binding experiments were performed in Tris-EDTA buffer containing adenosine deaminase (1 unit/ml) and Triton X-100 (0.01%) with increasing concentrations of [3H]DPCPX (0.25–8 nM). CHOA1H or CHOA1L cell membranes (10 μl) were incubated in the presence (nonspecific binding) or absence (total binding) of 5 mM theophylline in a total volume of 200 μl. After 90 min at room temperature, the incubation was stopped by rapid filtration using a Brandel MR24 cell harvester and washing with ice-cold Tris-EDTA buffer (three times, approximate volume 10 ml) over Whatman GF/B filters (presoaked for 1 h in 0.3% polyethylenimine to reduce nonspecific binding). Filters were transferred to scintillation vial inserts, and 4 ml of Emulsifier-Safe scintillator (Packard) were added. The filters were left at room temperature for at least 4 h before liquid scintilllation spectrometry. Protein determinations were by the method of Bradford (1976) using bovine serum albumin as the standard.
[35S]GTPγS Binding.
Cells from four confluent 162-cm2 flasks (which provide sufficient membranes for 98 tubes) were initially washed using Dulbecco's phosphate-buffered saline solution and then detached in Tris-HCl buffer (50 mM, pH 7.4) using a cell scraper. After centrifugation (1000g for 5 min), cells were combined and resuspended in 20 ml of Tris-HCl buffer and homogenized using a glass homogenizer (approximately 20 strokes). Homogenates were centrifuged twice at 20,000g for 10 min, and the resulting membrane pellet was resuspended in 3 ml of Tris-HCl buffer and stored at −20°C.
Membranes (30 μg protein/assay tube; pretreated with 1 unit/ml adenosine deaminase for 30 min at room temperature) were incubated with agonist in 1 ml of assay buffer (50 mM Tris-HCl, 100 mM NaCl, 10 mM MgCl2, 10 μM GDP, 0.01% Triton X-100, 0.1 nM [35S]GTPγS, pH 7.4) for 30 min at 25°C. Nonspecific binding was determined in the presence of 10 μM nonradioactive GDPγS. The reaction was stopped by filtration (using a Brandel cell harvester), through Whatman GF/B filters, presoaked in ice-cold water. Filters were washed twice with 4 ml of ice-cold water and then subjected to liquid scintillation counting.
In certain experiments, activation of specific G-proteins was measured by immunoprecipitation of their α-subunits after activation by agonist in the presence of [35S]GTPγS (Burford et al., 1998). Briefly, 100 μg of adenosine deaminase-treated CHOA1H cell membranes were incubated with 1 nM [35S]GTPγS for 3 min at room temperature in 250 μl of assay buffer. Assays were performed in the presence of either 10−6 or 10−7 M GDP for Gi and Gs/GQ/11, respectively. The reaction was terminated by the addition of 750 μl of ice-cold assay buffer, and membranes were collected by centrifugation at 16,000g for 5 min and then were solubilized in 100 μl of solubilization buffer (150 mM NaCl, 50 mM Tris, 5 mM EDTA, 1.25% Igepal CA630; Sigma) containing 0.2% (w/v) SDS and protease inhibitors [Mini-complete EDTA-free (Roche Molecular Biochemicals, Indianapolis, IN), 1 tablet/10 ml]. After a further 100 μl of solubilization buffer (no SDS) were added, samples were precleared by addition of 15 μl of protein A-agarose suspension (Autogen Bioclear, Santa-Cruz, Wiltshire, UK) for 30 min at 4°C. Samples were then incubated with antibody for 16 h at 4°C [anti-Gαi1–3 (C-10), 4 μg; anti-GαQ/11 (C-19), 4 μg; anti-Gαs (K-20), 2 μg; Santa Cruz]. Antibody was precipitated with 30 μl of protein A-agarose (2 h at 4°C), and the pellet was washed twice with solubilization buffer before resuspension in scintillation fluid and scintillation counting.
Data Analysis.
EC50 and IC50 (concentrations of drug producing 50% of the maximal stimulation or inhibition) values were obtained by computer-assisted curve fitting by use of the computer program InPlot (GraphPad Software Inc., San Diego, CA). Statistical significance was determined by Student's unpaired t test (P < .05 was considered statistically significant). All data are presented as means ± S.E.. The n in the text refers to the number of separate experiments. GraphPAD was also used to perform nonlinear regression analysis for fitting data from saturation experiments.
Chemicals.
[2-3H]myo-inositol, [2,8-3H]adenine, [35S]GTPγS, and DPCPX were from NEN DuPont (Hertsfordshire, UK). Rolipram was purchased from Calbiochem (Nottingham, UK). Adenosine deaminase, ATP, forskolin, theophylline, Triton X-100, GTPγS, 5′-(N-ethylcarboxamido)adenosine (NECA), Igepal CA630, SDS, (R)-N 6-(2-phenylisopropyl)adenosine (R-PIA), andN 6-cyclopentyladenosine (CPA) were purchased from Sigma. 8-Cyclopentyl-1,3-dipropylxanthine was from Research Biochemicals Inc. (Natick, MA) PTX was obtained from Calbiochem (Darmstadt, Germany). Dulbecco's modified Eagle's medium/nutrient mix F-12 (1:1) and fetal calf serum were from Sigma. All other chemicals were of analytical grade.
Results
A1 Receptor Expression.
Two cell lines (CHOA1H and CHOA1L) were used in the present study that had levels of human adenosine A1 receptor expression that differed by more than 1 order of magnitude (16.5-fold). The expression level in CHOA1L was 203.1 ± 16.5 fmol/mg protein (logK D −8.67 ± 0.08; n = 4) and that in CHOA1H was 3350.4 ± 315.8 fmol/mg protein (logK D −8.14 ± 0.04; n = 4). Studies of the displacement of [3H]DPCPX (1 nM) binding by the A1 receptor antagonist xanthine amine congener (XAC) in the two cell lines yielded similar apparent log K I values for XAC (−7.89 ± 0.18, n = 3 and −7.58 ± 0.13,n = 4, in the high and low expressing cells, respectively).
cAMP Accumulation.
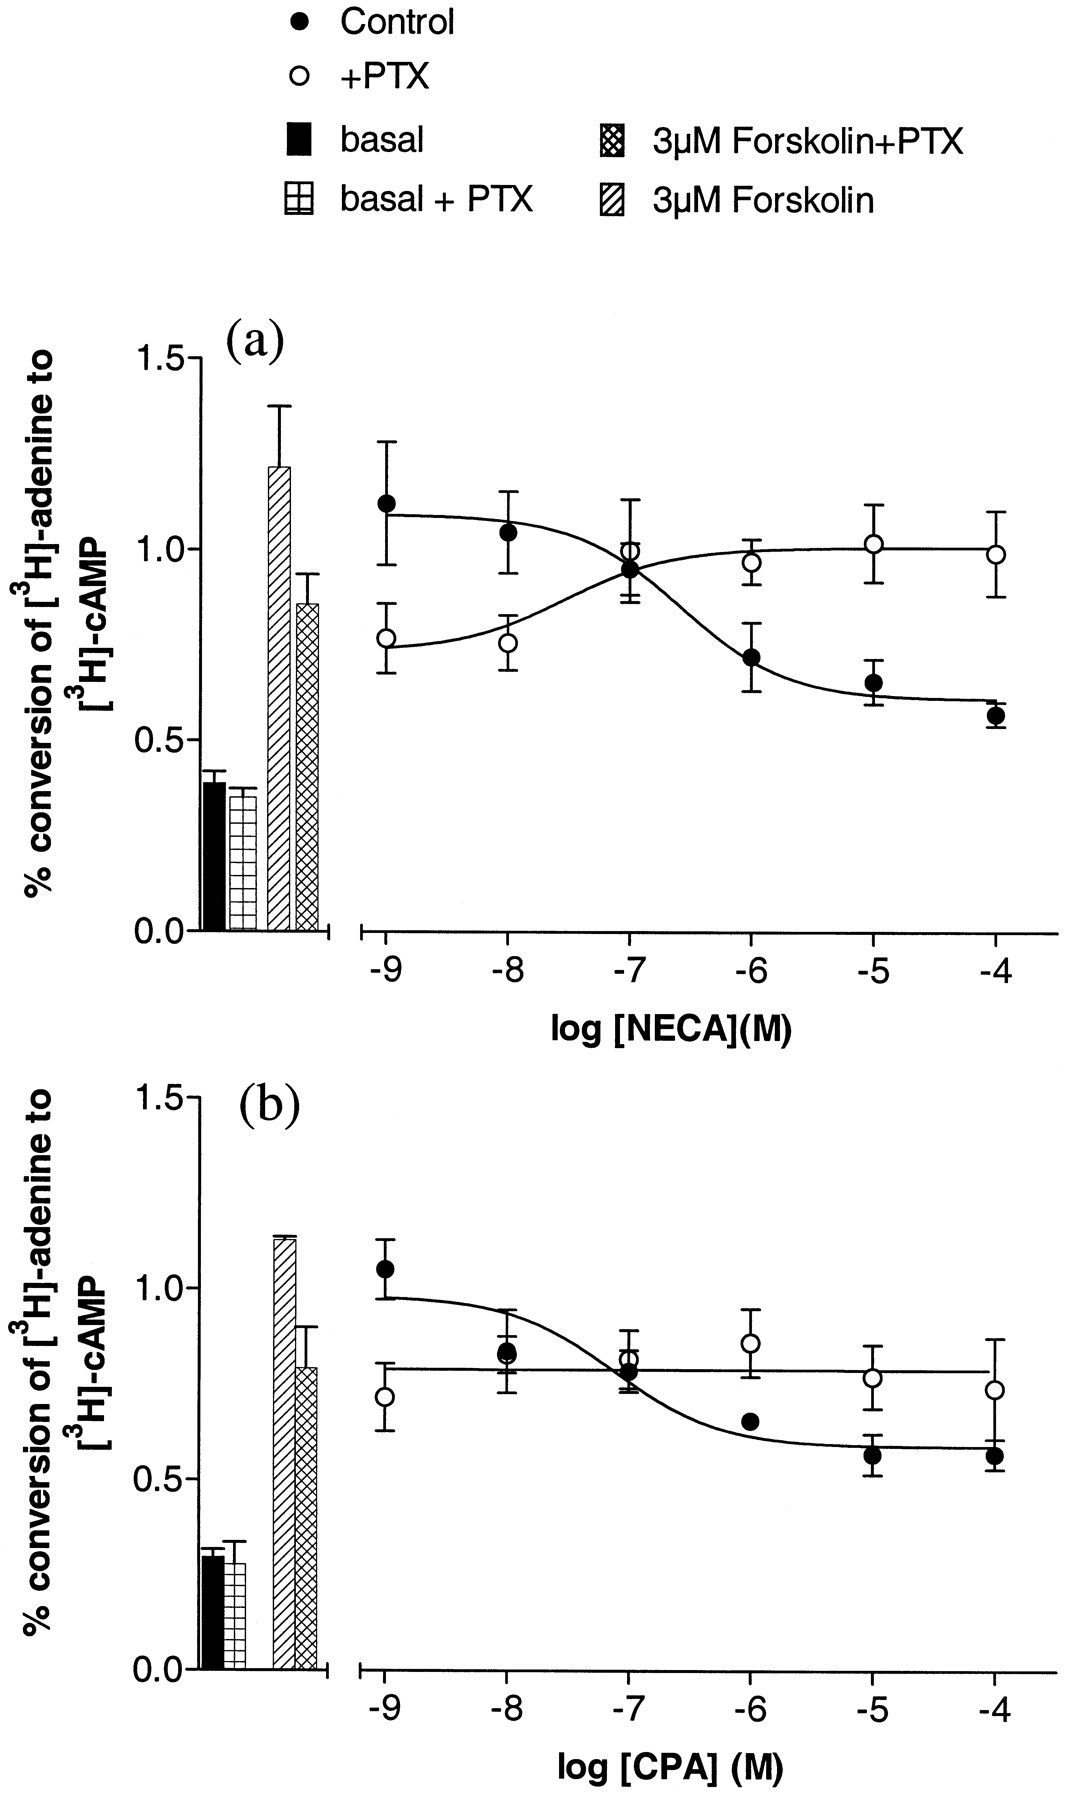
CPA, NECA, and R-PIA were able to attenuate forskolin-stimulated (3 μM) cAMP accumulation in both CHOA1H and CHOA1L cell lines (Fig. 1a and Table 1). The maximum level of inhibition of forskolin-stimulated cAMP accumulation produced by all three agonists was increased in the high expressing cells (CHOA1H; Table 1and Fig. 1a). This increase in maximal response in CHOA1H cells was accompanied by a marked decrease in agonist IC50values (by 2 orders of magnitude; Table 1 and Fig. 1a). As we have observed previously (Megson et al., 1995), the inhibition of adenylyl cyclase activity by CPA in cells expressing moderate levels of human A1 receptor (200–300 fmol/mg protein) can be completely prevented by 24-h treatment with PTX (100 ng/ml; Fig.2b; CHOA1L cells). Interestingly, treatment of CHOA1L cells with PTX revealed a small stimulation of cAMP accumulation when NECA was used as agonist (in the presence of 3 μM forskolin; Fig. 2a). The log EC50 value obtained for NECA for this response (in the presence of PTX), in three of the four experiments in which the effect was large enough for accurate determination, was −7.5 ± 0.2. In the same experiments, the log IC50 for NECA inhibition of forskolin-stimulated cAMP accumulation was similar (−6.8 ± 0.3; n = 4; Fig. 3a) to that obtained in other experiments (Table 1).
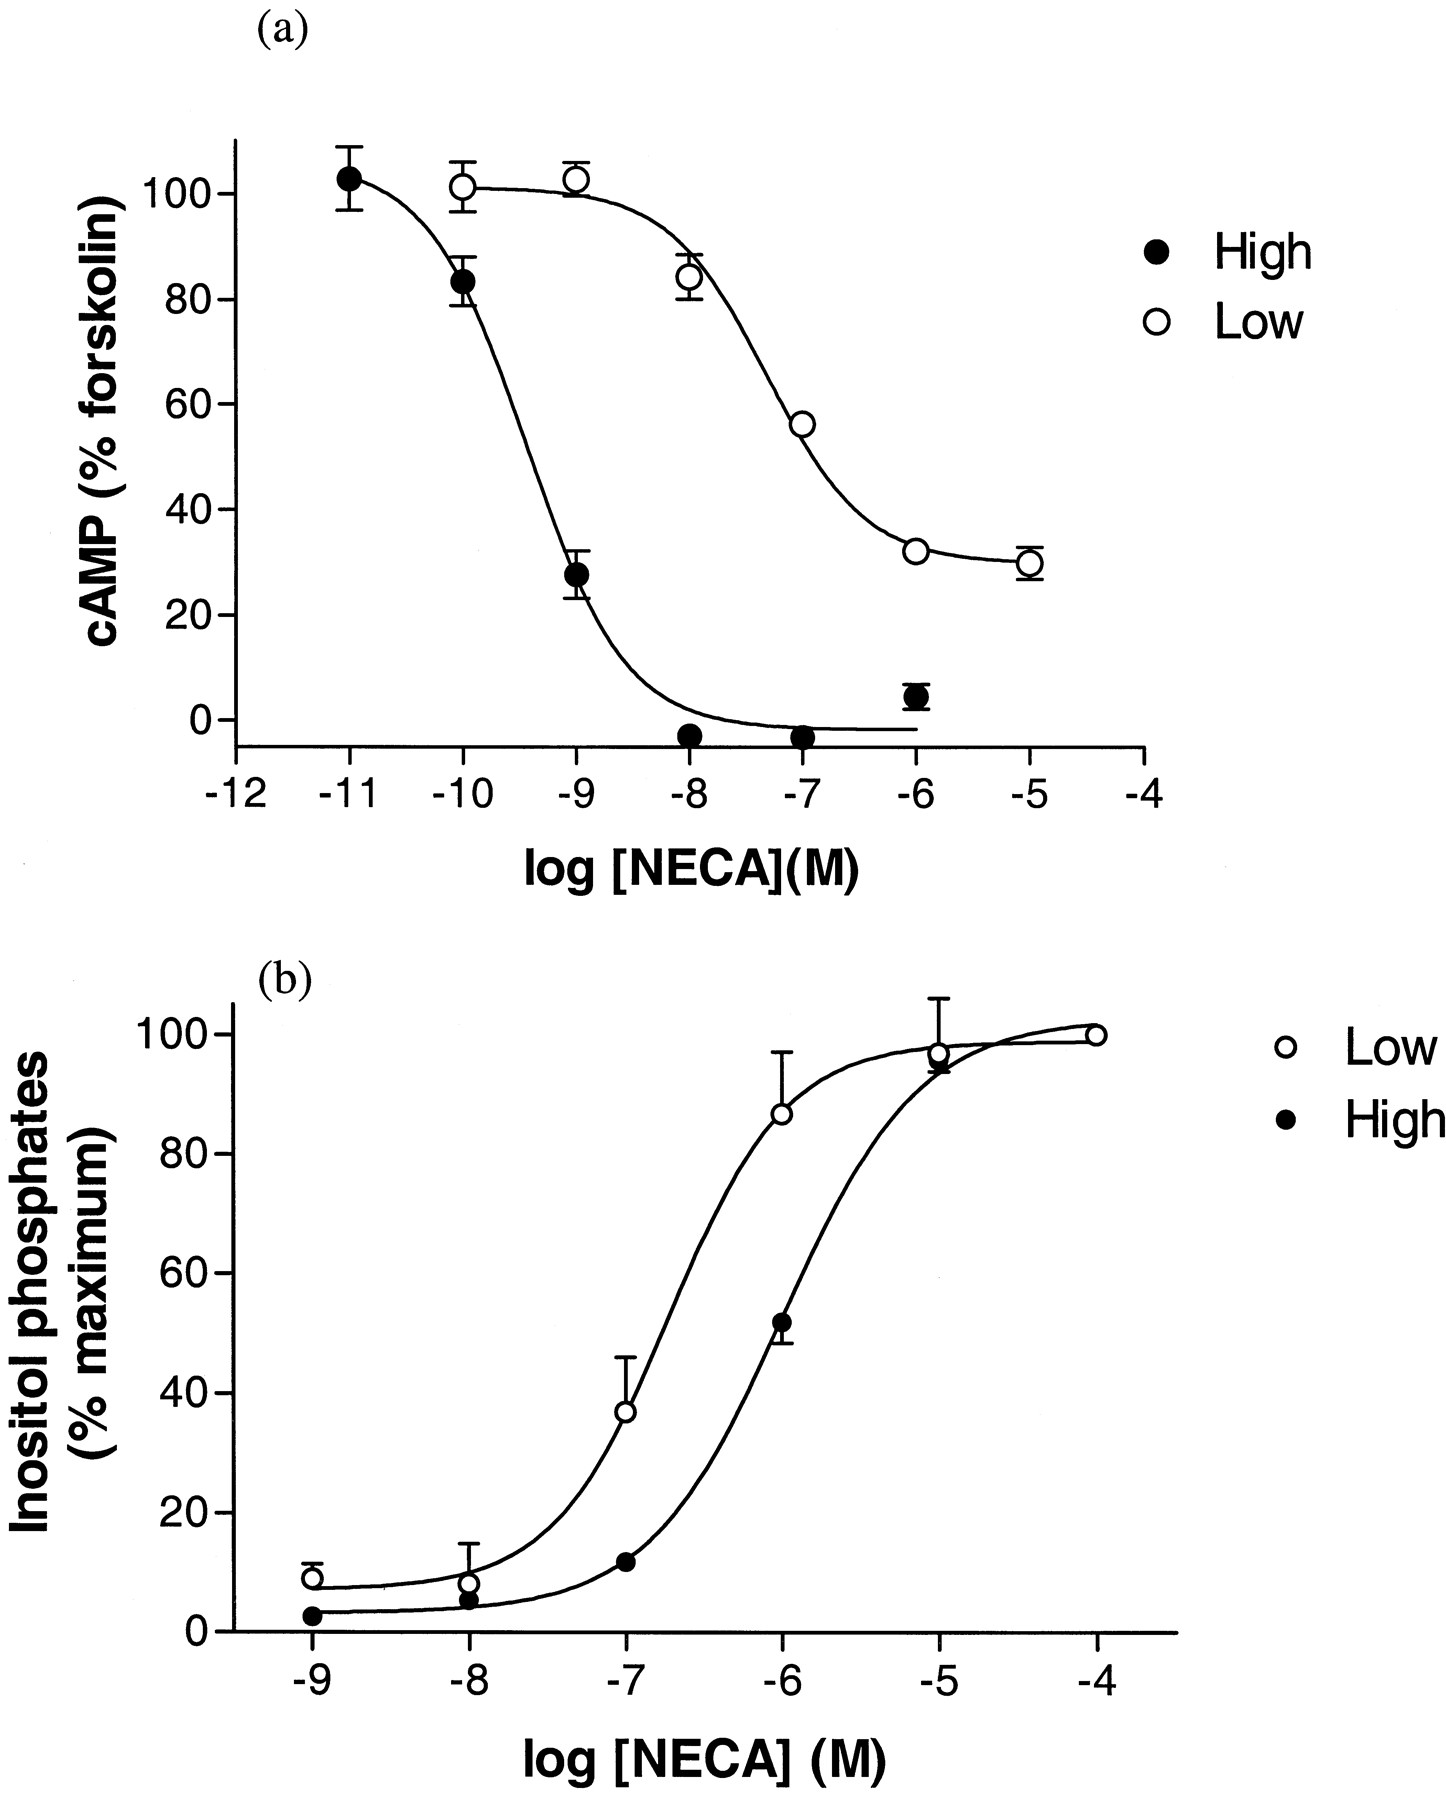
Effect of NECA on forskolin-stimulated (3 μM) [3H]cAMP accumulation (a) and [3H]inositol phosphate accumulation (b) in high (●) (CHOA1H) and low (○) (CHOA1L) expressing cells transfected with the human adenosine A1 receptor. Values represent means ± S.E.M. obtained from three (a), four (CHOA1L, b), or five (CHOA1H, b) separate experiments. Triplicate determinations were made at each concentration in each individual experiment.
A1 agonist concentration-response parameters for inhibition of forskolin-stimulated (3 μM) [3H]cAMP accumulation in high and low expressing CHO-K1 cells transfected with the human adenosine A1 receptor

Effect of NECA (a) and CPA (b) on forskolin-stimulated (3 μM) [3H]cAMP accumulation in low expressing CHOA1L cells under control conditions and after treatment with PTX (24 h, 100 ng/ml). Values represent combined means ± S.E.M. obtained from four (a) or three (b) separate experiments. Data are presented as percentage conversions of [3H]adenine to [3H]cAMP. Triplicate determinations were made at each concentration in each individual experiment. ●, Control; ○, +PTX; ■, basal; ⊞, basal + PTX; ▩, 3μM Forskolin+PTX; ▨, 3μM Forskolin.

Concentration-response curves for the effect of NECA on forskolin-stimulated (3 μM) [3H]cAMP accumulation in control CHOA1H cells and CHOA1H cells that had been treated with PTX (24 h, 100 ng/ml). Values represent means ± S.E.M. of triplicate determinations in a single experiment. Similar data were obtained in eight further experiments (see Table 2). Note that thex-axis has been extended to higher concentrations compared to that presented in Fig. 1.
In the higher expressing cells, all three agonists were able to augment forskolin-stimulated cAMP accumulation, after treatment with PTX (Fig.3 and Table 2). Note, in Fig. 3, that almost maximal inhibition of the forskolin-stimulated response (in control cells) is achieved at the lowest concentration of NECA used. NECA produced the largest stimulation of cAMP accumulation (+PTX in Fig. 3; Table 2) but was the least potent in terms of EC50 (Table 2). In comparison with the IC50 values obtained for each agonist for inhibition of adenylyl cyclase in these cells (Table 1), all three agonists were at least 2 orders of magnitude less effective in stimulating cAMP accumulation in the CHOA1H cells: NECA (1202-fold difference in IC50 and EC50values), R-PIA (708-fold), and CPA (229-fold).
Concentration-response parameters for A1 receptor agonist stimulation of cAMP accumulation (in the presence of 3 μM forskolin) after treatment of CHOA1H cells with PTX (24 h, 100 ng/ml)
Stimulation of [35S]GTPγS Binding.
The direct interaction between G-protein-coupled receptors and PTX-sensitive Gi/o-proteins can be followed by measurement of the binding [35S]GTP in cell membranes (Weiland and Jakobs, 1994). This is made possible because of the greater intrinsic guanine nucleotide exchange and GTPase activity of the Gi/o family of proteins, together with the higher levels of expression of Gi/o-proteins compared with other G-proteins (Fong et al., 1998). The agonist potencies of CPA, NECA, and R-PIA for eliciting [35S]GTPγS binding were very similar in both cell lines (Table 3 and Fig.4). Furthermore, there was little evidence for any difference in relative intrinsic activity (maximal stimulation over basal levels) between them, particularly in the CHOA1H cells (Table 3). What is clear, however, is that both the basal and agonist-stimulated specific binding of [35S]GTPγS is 10- to 20-fold greater in those cells expressing 16.5-fold higher numbers of A1receptors (Table 3). This is consistent with an ability of A1 receptors to recruit more Gi/o-proteins in the CHOA1H cells and suggests that the availability of Gi/o-proteins is not rate limiting. The higher basal level of [35S]GTPγS binding in the CHOA1H cells suggests that the A1 receptor may be constitutively active and producing agonist-independent receptor activation. Consistent with this hypothesis, the inverse agonists DPCPX, theophylline, and XAC (Shryock et al., 1998) were able to reduce basal [35S]GTPγS-specific binding (Fig.5).
A1 agonist concentration-response parameters for stimulation of [35S]GTPγS binding in membranes derived from high and low expressing CHO-K1 cells transfected with the human adenosine A1receptor

Effect of CPA on [35S]GTPγS binding in membranes derived from high (a) and low (b) expressing CHO-K1 cells transfected with the human adenosine A1 receptor. Values represent means ± S.E.M. from three separate experiments. The open bar shows the basal levels of [35S]GTPγS binding. Please note the difference in y-axis scale between the CHOA1L (b) and CHOA1H (a) cells.

Inhibition of basal [35S]GTPγS binding by DPCPX (a) and XAC (b) in high (CHOA1H, filled circles) and low (CHOA1L, open circles) expressing CHO cells transfected with the human adenosine A1 receptor. Values represent means ± S.E.M. from eight (a, filled circles) or four (a, open circles; b, filled circles) separate experiments. Histograms show the basal levels of [35S]GTPγS binding in CHOA1H (filled bars) and CHOA1L (cross-hatched bars).
[3H]Inositol Phosphate Accumulation.
CPA, NECA, and R-PIA were able to stimulate [3H]inositol phosphate accumulation in both cell lines (Table 4 and Fig.6). In CHOA1L cells, the level of stimulation was small (approximately 1.5-fold over basal; Table 4); whereas in CHOA1H cells, it was similar or greater than the response to ATP (Fig. 6). Interestingly, NECA was 8-fold less potent in producing this response in the CHOA1H than in the lower expressing cells (Table 4and Fig. 1b). R-PIA had the same potency in both cell lines. We have previously shown that the direct effect of CPA on [3H]inositol phosphate accumulation, in cells expressing moderate levels of human A1 receptors (approximately 300 fmol/mg protein), is completely sensitive to inhibition by PTX treatment (Megson et al., 1995). In the present study, after PTX treatment of CHOA1H cells, there were residual PTX-resistant responses to all three agonists (Table5). However, NECA was by far the most efficacious agonist, producing a much greater maximal PTX-resistant response (290%; CPA = 100%) than either CPA (100%) orR-PIA (130%; Table 5). In contrast, NECA had the lowest potency (in terms of log EC50 value) of the three agonists (Table 5).
A1 agonist concentration-response parameters for A1receptor-stimulated [3H] inositol phosphate accumulation in high and low expressing CHO-K1 cells transfected with the human adenosine A1 receptor

Augmentation by CPA of ATP-stimulated [3H]inositol phosphate accumulation in CHOA1H (a) and CHOA1L (b) cells. Values represent means ± S.E.M. of triplicate determinations in a single experiment. Similar data were obtained in eight (a) or two (b) further experiments. Data were obtained for CPA in the absence (filled circles) or presence (open circles) of 0.1 mM ATP. Histograms show the basal (C) and ATP-stimulated (0.1 mM) control responses. The filled bars represent the controls measured in the same 24-well plate as the filled circles, and the cross-hatched bars represent those measured in the same plate as the open circles.
A1 agonist concentration-response parameters for A1receptor-stimulated [3H] inositol phosphate accumulation in high expressing CHOA1H cells transfected with the human adenosine A1 receptor
Augmentation of ATP- or UTP-Stimulated [3H]Inositol Phosphate Accumulation.
CPA was able to augment the inositol phosphate responses to P2Y2 receptor stimulation in both cell lines, although to a much lower extent in CHOA1L cells (Fig. 6). This effect was concentration dependent in both cell lines (Table 5 and Fig. 6). In CHOA1H cells, the maximal augmentation was 8.57 ± 0.15-fold (additive response = 2.98 ± 0.20-fold, n = 3; response to ATP = 1). An augmentation of the ATP response of similar magnitude in CHOA1H cells could also be demonstrated with both NECA (Fig.7 and Table 5) and R-PIA (Table 5). Interestingly, the potency of all three agonists was increased (lower EC50 values) in the presence of 100 μM ATP (CPA 4.0-fold, NECA 8.3-fold, R-PIA 2-fold; Table 5). The influence of ATP on agonist EC50values was greatest in CHOA1H cells with NECA as agonist (Fig.8 and Table 5), but this effect was much lower in CHOA1L cells (Fig. 8).

Augmentation by NECA of ATP-stimulated [3H]inositol phosphate accumulation in CHOA1H (a) and CHOA1L (b) cells. Values represent means ± S.E.M. of triplicate determinations in a single experiment. Similar data were obtained in four (a) or three (b) further experiments. Data were obtained for NECA in the absence (open circles, open squares) or presence (filled circles, filled squares) of 0.1 mM ATP. Some cells (filled and open squares) were treated for 24 h with 100 ng/ml PTX before assay. Control responses, in the absence of NECA, are shown at C. ○, NECA; ●, NECA + ATP; □, PTX NECA; •, PTX NECA + ATP.

Concentration-response curves for NECA-stimulated [3H]inositol phosphate accumulation in CHOA1H (a) and CHOA1L (b) cells. Values represent means ± S.E.M. of five (a) or four (b) separate experiments. Data have been normalized to the response to 0.1 mM NECA in each experimental condition. Data represent curves obtained with NECA alone or in combination with 0.1 mM ATP. Some cells (PTX) were treated for 24 h with 100 ng/ml PTX before assay.
A surprising finding in the CHOA1H cells was the residual amplification of ATP responses by A1 receptor agonists after overnight treatment with PTX (Fig. 7 and Table 5). These data suggest that Gβγ-subunits derived from PTX-resistant G-proteins (e.g., GQ and GS) can also augment GQ-coupled receptor-stimulated phospholipase C β3 activity (Dickenson and Hill, 1998).
Immunoprecipitation of Individual Gα-Protein Subunits after Agonist-Stimulated [35S]GTPγS Binding in CHOA1H Cells.
To investigate directly whether NECA and CPA have different relative intrinsic efficacies for the activation of individual Gα-protein subunits in CHOA1H cells, we have investigated whether these two agonist can stimulate [35S]GTPγS binding to Gαs, Gαi(1–3), and GαQ/11(Fig. 9). CPA and NECA stimulated [35S]GTPγS binding to Gαi(1–3) with similar relative intrinsic efficacies (Fig. 9). These data are consistent with the data obtained for inhibition of adenylyl cyclase (Table 1) and [35S]GTPγS binding in intact membranes (Table3). The log EC50 values obtained for activation of Gαi(1–3) proteins by NECA (7.66 ± 0.32, n = 3) and CPA (8.09 ± 0.15,n = 3) were also similar to each other and to those values obtained from studies of intact membranes (Table 3).

Effect of NECA and CPA on [35S]GTPγS binding to Gαi(1–3) (a), GαQ/11 (b), and GαS (c). Binding of [35S]GTPγS was measured after immunoprecipitation of individual Gα-subunits as described under Materials and Methods. Data have been expressed as percentages of the response to 10 μM CPA (b and c) or 1 μM (a) measured in each individual experiment, after subtraction of basal. Values represent means ± S.E.M. of three separate experiments.
In agreement with the data obtained for activation of [3H]inositol phosphate accumulation (Table 5), CPA was nearly 1 order of magnitude more potent than NECA in stimulating [35S]GTPγS binding to GαQ/11 (log EC50 values of 8.43 ± 0.27 and 7.53 ± 0.24, respectively,n = 3; Fig. 9). Furthermore, the relative intrinsic activity of NECA was much greater than that of CPA, stimulating [35S]GTPγS binding to GαQ/11 by 180.9 ± 16.8% relative to CPA (100%; n = 3). Both CPA and NECA were also able to stimulate [35S]GTPγS binding to GαS, although with lower potencies (log EC50 7.79 ± 0.25 and 6.98 ± 0.33, respectively, n = 3) than to Gαi(1–3) and GαQ/11(Fig. 9). Similar to the data obtained for GαQ/11, NECA had a higher relative intrinsic activity (209 ± 39%, n = 3) compared to CPA (100%; Fig. 9).
Discussion
The present study was undertaken to investigate how the potency and relative intrinsic activity of three different A1 receptor agonists for stimulation of different intracellular pathways change when the expression level of the human A1 receptor is increased.
Adenosine A1 agonists produced a larger maximal inhibition of forskolin-stimulated cAMP accumulation in cells (CHOA1H) that had a much higher expression of human adenosine A1 receptors than CHOA1L cells. The IC50 values, deduced from concentration-response curves, for CPA, NECA, and R-PIA were all shifted 2 orders of magnitude to the left of those values obtained in the lower expressing cells. These data are consistent with the expected increase in signal amplification resulting from an increased A1 receptor density, as predicted by traditional receptor theory (Clarke and Bond, 1998; McDonnell et al., 1998). This suggests that amplification occurs between the binding of A1 agonists and the inhibition of adenylyl cyclase (as a consequence of the saturation of some of the intracellular signaling processes involved), leading to the generation of a receptor reserve.
In both cell lines, the agonists NECA, R-PIA, and CPA inhibited adenylyl cyclase activity to a similar extent (i.e., they appear to have the same relative intrinsic efficacy in each cell line). This is particularly pertinent in the lower expressing cell line, in which the maximum response to A1 agonists represents an inhibition of only approximately 70% of the response to forskolin. These findings are consistent with the data obtained from measurement of [35S]GTPγS binding, in membranes from both cell lines, which primarily give an indication of the activation of Gi/o proteins (Fong et al., 1998; the responses obtained were completely sensitive to inhibition by PTX). It was notable that the EC50 values for these [35S]GTPγS responses were similar in both high and low A1 receptor-expressing cells. This observation, coupled with the approximately 30-fold increase in magnitude of the agonist-stimulated [35S]GTPγS response in the CHOA1H cells, confirms that any gain of function (in terms of agonist potency for adenylyl cyclase inhibition) resulting from signal saturation is downstream of the receptor-Gi/o-protein interaction.
It was noticeable in the low expressing CHOA1L cells that a small enhancement of forskolin-stimulated cAMP accumulation was observed in response to NECA, but not CPA, after PTX treatment (Fig. 2). This observation raises the possibility that NECA can stimulate alternative PTX-resistant G-protein pathways with higher relative intrinsic efficacy than CPA. The most likely target is GαS, although a role for GαQ/11 cannot be eliminated because activation of GQ/11-coupled receptors has been shown to augment forskolin-stimulated cAMP formation in CHO cells (Burford et al., 1995). Consistent with a role for GαS, it was notable that NECA was more effective (in terms of maximal response) in stimulating binding of [35S]GTPγS to GαS in the high expressing CHOA1H cells than CPA (Fig. 9).
In the higher expressing CHOA1H cells, all three agonists were able to enhance forskolin-stimulated cAMP accumulation after ablation of Gi/o-signaling with PTX. In these cells, NECA was nearly 1 order of magnitude less potent (EC50) than CPA or R-PIA in producing this response but was significantly (p < .05) more efficacious than the other two agonists (in terms of E MAX; Table2). Very similar data for both relative potency and intrinsic activity were obtained when the effects of NECA and CPA on GαS were directly measured (Fig. 9). These latter observations, however, are difficult to reconcile with traditional receptor theory. It is clear that the higher strength of signal produced at the A1 receptor in the high expressing CHOA1H cells can channel into activation of a number of different signaling pathways (some of which interact with each other). Furthermore, traditional theory would predict that agonists would retain the same relative potency and efficacy orders on each pathway (even if synergistic interactions occur between them). However, one would not expect to observe a decrease in potency (i.e., an increase in EC50) for NECA (relative to CPA), coupled with an increase in relative intrinsic activity (again compared to CPA), observed on one pathway (GS-mediated activation of adenylyl cyclase) when compared to another (Gi-mediated inhibition of adenylyl cyclase). These data strongly suggest that different A1agonists can initiate specific stimulus profiles at the level of the G-protein. Interestingly, the potential for an agonist to direct signaling to a particular G-protein-mediated response has been raised previously (Kenakin, 1995a,b), and this concept has received support recently from studies of 5-HT2C-mediated arachidonic acid release and inositol phosphate accumulation (Berg et al., 1998; Clarke and Bond, 1998).
As we have previously described (Megson et al., 1995), A1 agonists can produce a small PTX-sensitive stimulation of [3H]inositol phosphate accumulation in transfected CHO cells, which appears to be mediated by Gi/o-βγ-subunits (Dickenson and Hill, 1998). These observations were confirmed in the present study in the low expressing CHOA1L cells (e.g., see Fig. 7b). In the high expressing CHOA1H cells, this inositol phosphate response was considerably larger. In the case of CPA and R-PIA, the EC50values obtained in the two cell lines were quite similar, and these observations, coupled with the large increase in response magnitude, point to the lack of a receptor reserve for these inositol phosphate responses. However, in the case of NECA, the EC50value in CHOA1H cells is nearly 1 order of magnitude greater than in the lower expressing cell line. Thus (as illustrated in Fig. 1), whereas the inhibition of adenylyl cyclase activity by NECA is shifted by 2 orders of magnitude to the left on increased A1 receptor expression, the inositol phosphate response is shifted by 1 order of magnitude in the opposite direction.
As noted with the stimulation of cAMP accumulation in CHOA1H cells above, the relative intrinsic activity of NECA for the inositol phosphate response was significantly greater than for CPA in these cells (P < .02), suggesting higher efficacy. In contrast to the low expressing cells, however, there was a small but significant residual inositol phosphate response in CHOA1H cells (with all three agonists) after PTX treatment. In the case of NECA, this agonist had the lowest potency (i.e., highest EC50 value) but produced a maximal response that was nearly 3-fold greater than that obtained with CPA. Again, these observations are difficult to reconcile with traditional receptor theory. It is tempting to speculate that the rightward shift in the concentration-response curve for NECA-induced inositol phosphate accumulation in CHOA1H cells (compared to CHOA1L) is related to the greater ability of this agonist to produce a PTX-resistant (presumably GαQ/11-mediated) inositol phosphate response. In keeping with this hypothesis, we have been able to show that NECA can stimulate directly GTPγS binding to GαQ/11 in these cells with a greater relative intrinsic activity (again suggesting higher efficacy), but lower potency (higher EC50), than CPA (Fig. 9).
If activation of GαQ/11 by NECA is an important determinant of the effect of this agonist on inositol phospholipid hydrolysis, then one could propose that the Gi/o-βγ-mediated phospholipase C response (the PTX-sensitive component) is partly dependent on amplification of the GαQ/11-mediated (PTX-resistant) component of the NECA response. Thus, the concentration at which NECA activates phospholipase C via GαQ/11 is largely responsible for the EC50 of the final response, i.e., the Gi/o-derived βγ-subunits only produce a substantial amplification of phospholipase C activity when concentrations of NECA reach those required to provide a direct stimulation of the enzyme via GαQ/11, although this might also involve an exchange of Gβγ-subunits between Gi/o-proteins and GQ/11-proteins, as has been recently suggested byQuitterer and Lohse (1999). In the lower expressing CHOA1L cells, the small inositol phosphate response to NECA, obtained at lower concentrations of the agonist, is likely to be primarily due to Gi/o-βγ-subunits enhancing any basal GαQ/11-mediated phospholipase C activity.
It has been shown previously that adenosine A1receptor activation can augment inositol phosphate and calcium responses stimulated by GQ/11-coupled receptors (Gerwins and Fredholm, 1992; Dickenson and Hill, 1993; Megson et al., 1995; Okajima et al., 1995; Peakman and Hill, 1995). In the present study, this effect is most marked in the high expressing cells, in which a large amplification of ATP-stimulated inositol phospholipid hydroylsis can be demonstrated. If the argument described above, for the rightward shift in the NECA concentration-response curve, is correct, then it should be possible to produce a leftward shift in the concentration-response curve for NECA by coactivation with a GQ/11-coupled receptor (such as the P2y2 receptor for ATP). This was achieved with NECA (and to a lesser extent with CPA and R-PIA) in the high expressing CHOA1H cells but not as expected in the lower expressing CHOA1L cells (Fig. 8). Interestingly, under these conditions the relative intrinsic activity of all three A1agonists in CHOA1H were effectively identical and similar to the relative values obtained from Gαi-mediated responses such as GTPγS binding (Table 3) or inhibition of adenylyl cyclase (Table 1). Thus, these data support the contention that the effect of NECA on GαQ/11-stimulated phospholipase C plays a major role in setting the potency (EC50) and overall relative intrinsic efficacy of the final response in the absence of ATP.
It is noticeable that the relative intrinsic activity of NECA is much lower for direct activation of GαQ/11 than that obtained for PTX-resistant [3H]inositol phosphate accumulation. The EC50 values for agonist-stimulated GTPγS binding to GαQ/11 in CHOA1H cells are also lower than those obtained from measurement of the PTX-resistant inositol phosphate response. The simplest explanation for this is that the experimental conditions for the isolated membrane-based GTPγS assays and the intact cell-based inositol phospholipid hydrolysis assays are very different. However, it should be noted that the GTPγS binding to GαQ/11 has been undertaken in an intact system (i.e., where the equilibria between A1 receptors and Gi/o-proteins in cell membranes has not been disrupted with PTX). Thus, the relative intrinsic activities should better match those obtained under control conditions (Table 5), which in fact they do. The difference in EC50 values may also reflect the concentration-response relationships for activation phospholipase C by GαQ/11.
In summary, it is clear that increased A1receptor expression leads to the predicted amplification of Gi/o-protein-mediated inhibition of adenylyl cyclase, by three different A1 agonists with similar efficacy and potency, and the creation of a substantial receptor reserve. In contrast, higher expression of A1 receptors reveals a differential ability of A1 agonists to stimulate responses mediated by PTX-resistant G-proteins. NECA has the highest relative intrinsic activity (suggesting higher efficacy) for these latter responses but surprisingly has the lowest potency. These data are difficult to reconcile with traditional receptor theory and suggest that agonists differ in the extent to which they can recruit other G-proteins. Cross-talk between different G-protein-mediated-signaling cascades, under these conditions, can have a substantial effect on both the agonist's potency and the relative efficacies of different A1 agonists. These observations have important implications for the design of agonists that may produce differential responses via the same receptor.
Acknowledgments
We thank The Wellcome Trust for financial support (ref 046755).
Footnotes
- Received March 24, 2000.
- Accepted July 3, 2000.
-
Send reprint requests to: Professor S. J. Hill, Institute of Cell Signalling, Queen's Medical Centre, Nottingham NG7 2UH, UK. E-mail:stephen.hill{at}nottingham.ac.uk
-
↵1 Present address: Department of Life Sciences, Nottingham Trent University, Clifton Lane, Nottingham NG11 8NS UK.
Abbreviations
- PTX
- pertussis toxin
- CPA
- N6-cyclopentyladenosine
- [3H]DPCPX
- 8-cyclopentyl-[3H]1,3-dipropylxanthine
- [35S]GTPγS
- [35S]guanosine-5′-(3-O-thio)triphosphate
- NECA
- 5′-(N-ethylcarboxamido)adenosine
- R-PIA
- (R)-N6-(2-phenylisopropyl)adenosine, XAC, xanthine amine congener
- CHO
- Chinese hamster ovary
- The American Society for Pharmacology and Experimental Therapeutics


