


Abstract
Previous studies had shown that the amplification factors for cannabinoid receptors, defined as the number of total G proteins activated per occupied receptor, differs between several rat brain regions. In this study, we sought to determine which specific Gi/Goα subunits were activated by CB1 receptors in several rat brain regions and if this coupling might explain the regional differences in receptor/G protein amplification factors. Furthermore, we examined whether cannabinoid agonists might activate different subtypes of Gα subunits with varying degrees of efficacy and/or potency. Activation of specific G proteins by cannabinoid receptors was evaluated by the ability of the agonist WIN 55212-2 to stimulate incorporation of [α-32P]azidoanilido-GTP into Gα subunits in membranes. Photolabeled G proteins were either directly resolved using urea/SDS-polyacrylamide gel electrophoresis or first immunoprecipitated with specific antisera for different Gα subunits before electrophoresis. Individual Gα subunits were separated into distinct bands on a single gel and the amount of agonist-induced increase in radioactivity was quantified by densitometry. Stimulation of CB1 receptors by WIN 55212-2 resulted in the activation of a distinct pattern of at least five different Giα/Goα subunits in several brain regions. Furthermore, although the pattern of G proteins activated by WIN 55212-2 appeared to be similar across brain regions, slight differences were observed in both the percentage of increase and the amount of the individual Gα subunits activated. Most importantly, the amount of WIN 55212-2 required to half-maximally activate individual G proteins in the cerebellum varied over a 30-fold range for different Gα subunits. These results suggest that cannabinoid receptors activate multiple G proteins simultaneously in several brain regions and both the efficacy and potency of cannabinoid agonists to activate individual Gα subunits may vary considerably.
Δ9-Tetrahydrocannabinol is the principal psychoactive ingredient found in the plantCannabis sativa (marijuana) and it produces its effects by interacting with CB1 and CB2 cannabinoid receptors (Dewey, 1986;Howlett, 1995). CB1 receptors (CB1 and CB1A) are located primarily in the central nervous system, whereas CB2 receptors are found principally in the periphery (Munro et al., 1993; Shire et al., 1995). All subtypes of cannabinoid receptors belong to the large superfamily of G protein-coupled receptors (GPCRs) that traverse the plasma membrane seven times and activate intracellular G proteins. Heterotrimeric G proteins are composed of three distinct subunits, α (39–50 kDa), β (35–36 kDa), and γ (6–10 kDa) and their activation by GPCRs produces an exchange of GTP for GDP on the α-subunits. This results in the dissociation of the G protein from the receptor and the separation of the α-GTP from the βγ-subunits. Both the free α-GTP and βγ-subunits then proceed to regulate various downstream effectors (Gudermann et al., 1997). Pertussis toxin (PTX)-sensitive G proteins (i.e., Giα and Goα subtypes) appear to mediate the physiological effects of cannabinoids (Howlett, 1995), although recent studies also suggest a possible role for Gsα(Glass and Felder, 1997; Maneuf and Brotchie, 1997; Felder et al., 1998). Regulation of intracellular effectors by cannabinoid receptors includes inhibition of adenylyl cyclase (Howlett, 1984), inhibition of voltage-gated Ca2+ channels (Mackie et al., 1995), activation of inwardly rectifying K+channels (Mackie et al., 1995), and activation of mitogen-activated protein kinase (Bouaboula et al., 1995).
CB1 receptors are widely distributed throughout the mammalian central nervous system in relatively high density (Herkenham et al., 1990), particularly in areas involved in mediating the processes affected by marijuana. These brain regions include the cortex (cognition), hippocampus (memory), hypothalamus (body temperature), and cerebellum and basal ganglia (motor function) (Breivogel et al., 1997; Breivogel and Childers, 1998). Although the correlation between regional cannabinoid receptor number and the observed physiological effects is striking, the signal transduction mechanisms underlying these actions have not been determined. Cannabinoid agonists stimulate the binding of the hydrolysis-resistant GTP analog [35S]guanosine-5′-O-(3-thio) triphosphate (GTPγS), to G protein α-subunits and this can be used as a measure of receptor activation. We have recently developed a method to measure the number of G proteins activated per occupied receptor (i.e., receptor/transducer amplification factors) by calculating the ratio of the apparent Bmaxof net agonist-stimulated [35S]GTPγS binding to the Bmax of receptor binding (Breivogel et al., 1997). Using this technique, we found that the amplification factors for cannabinoid receptors differed between several rat brain regions, ranging from 2.0 in the frontal cortex to 7.5 in the hypothalamus. This suggests that although some brain regions contain lower densities of cannabinoid receptors (i.e., hypothalamus), CB1 stimulation results in the activation of an equivalent or greater number of G proteins relative to regions containing higher densities of receptors (i.e., frontal cortex).
Although agonist-induced [35S]GTPγS binding provides valuable information concerning activation of total G proteins in a particular brain region or tissue, this technique cannot be used to examine the coupling of GPCRs to individual Gα subunits. One approach to measure the activation of specific G proteins by receptors is to use agonist-stimulated incorporation of [32P]azidoanilido-GTP (AA-GTP) into Gα subunits, followed by immunoprecipitation (IP) and separation with urea/SDS-polyacrylamide gel electrophoresis with subsequent autoradiography (AR) (Prather et al., 1994a,b, 1995;Chakrabarti et al., 1995). With this technique, individual Gα subunits can be separated into distinct bands on a single gel and thus receptor coupling to individual G proteins simultaneously can be evaluated. In this study, we sought to determine which specific Gα subunits were activated by CB1 receptors in several rat brain regions and if this coupling might explain the previously observed regional differences in receptor/G protein amplification factors. Furthermore, we examined whether cannabinoid agonists might activate different subtypes of Giα/Goα subunits with varying degrees of efficacy and/or potency. Our results demonstrate that stimulation of CB1 receptors by maximally effective concentrations of WIN 55212-2 results in the activation of a distinct pattern of at least five different Giα/Goα subunits in several brain regions. Furthermore, although the pattern of G proteins activated by WIN 55212-2 appears to be similar across brain regions, slight differences are observed in both the percentage of increase and the amount of the individual Gα subunits activated. Most importantly, the amount of WIN 55212-2 required to half-maximally activate individual G proteins in the cerebellum varies over a 30-fold range for different Gα subunits.
Experimental Procedures
Materials.
Male Sprague-Dawley rats were purchased from Zivic Miller (Zeleinople, PA). [32P]GTP (3000 Ci/mmol), [35S]GTPγS (1250 Ci/mmol), and antisera (EC2 and GC2) were purchased from NEN (Boston, MA). GDP for membrane [35S]GTPγS binding assays and unlabeled GTPγS were purchased from Boehringer Mannheim (New York, NY). Antiserum LEP4 was a generous gift from Dr. Ping-Yee Law (University of Minnesota, Minneapolis, MN). Enhanced chemiluminescence (ECL) reagents and Hyperfilm-ECL were purchased from Amersham (Arlington Heights, IL). WIN 55212-2 and AM 281 were obtained from Tocris Cookson, Inc. (Ballwin, MO). All other reagents were purchased from Sigma Chemical Co. (St. Louis, MO).
Membrane Preparations.
Brain regions were dissected from fresh rat brains on ice. Tissue samples were pooled and homogenized with a Tissumizer (Tekmar, Cincinnati, OH) in cold assay buffer (50 mM Tris-HCl, pH 7.4; 3 mM MgCl2; 0.2 mM EGTA; and 100 mM NaCl) and centrifuged at 31,000g for 10 min at 4°C. Pellets were resuspended in membrane buffer, then centrifuged at 31,000g for 10 min at 4°C. Pellets were homogenized in membrane buffer, assayed for protein content (Bradford, 1976), and stored in aliquots at −80°C until being assayed.
Photoaffinity Labeling of Gα Subunits with [32P]AA-GTP.
The method for synthesis and purification of [32P]AA-GTP can be found inPrather et al. (1994a). The photoaffinity labeling of Gα subunits with [32P]AA-GTP also has been recently reported (Prather et al., 1994a,b, 1995; Chakrabarti et al., 1995). Plasma membranes (25 μg per assay) were incubated in the presence or absence of agonist for 6 min at 30°C in 100 μl of buffer I (50 mM HEPES, pH 7.4; 0.1 mM EDTA; 10 mM MgCl2; 30 mM NaCl; 30 μM GDP; and 0.04 U/ml adenosine deaminase). After agonist incubation, [32P]AA-GTP (1 μCi /assay) was added, and samples were incubated for an additional 6 min at 30°C. The reaction was terminated by placing samples on ice. Membranes were then collected by centrifugation at 12,000g for 10 min and resuspended in 100 μl of buffer II (50 mM HEPES, pH 7.4; 0.1 mM EDTA; 10 mM MgCl2; 30 mM NaCl; and 2 mM dithiothreitol). Resuspended pellets (droplets) were then irradiated at 4°C with 240 milliJoules from an ultraviolet lamp (254 nm; 150 W) at a distance of 15 cm. Samples were centrifuged as before, resuspended in electrophoresis sample buffer, and separated by SDS-PAGE (see below).
In cases where G proteins were immunoprecipitated after photoaffinity labeling, membrane pellets (100 μg/assay) were solubilized in 80 μl of 4% SDS for 10 min at room temperature. Immediately following, 560 μl of buffer A (1% Nonidet P-40, 1% desoxycholate, 0.5% SDS, 150 mM NaCl, 1 mM dithiothreitol, 1 mM EDTA, 0.2 mM phenylmethylsulfonyl fluoride, 10 μg/ml aprotinin, and 10 mM Tris-HCl, pH 7.4) was added. Samples were then centrifuged for 10 min (12,000g) and pellets were discarded. Antiserum (10 μl) was added to supernatants and samples were constantly rotated at 0°C for 2 h. Antisera used were GC2 for Goα (Spiegel, 1990) and LEP4 for Giα1 and Giα2(Prather et al., 1994). After incubation, 120 μl of a 12.5% suspension of protein A-Sepharose beads was added and samples were constantly rotated overnight at 0°C. The next day, samples were pelleted (12,000g for 10 min) and washed twice with 1 ml of buffer B (600 mM NaCl; 50 mM Tris-HCl, pH 7.4; 0.5% SDS; and 1% Nonidet P-40), followed by a final wash with 1 ml of buffer C (300 mM NaCl; 100 mM Tris-HCl, pH 7.4; and 10 mM EDTA). Samples were then centrifuged as before and protein A-Sepharose beads were resuspended in 100 μl of electrophoresis sample buffer. Samples were heated at 100°C for 10 min and centrifuged (12,000g for 10 min). Finally, supernatants were subjected to SDS-PAGE as described below.
After electrophoresis, SDS-PAGE gels were dried and [32P]AA-GTP-labeled Gαsubunits were visualized autoradiographically by a Molecular Dynamics Inc. PhosphorImager 445 SI (Sunnyvale, CA). Autoradiographic bands were quantified by densitometry with the National Institutes of Health Image software program (version 1.56). To determine the relative amount of radioactivity incorporated by individual G proteins, the area of each band was traced and multiplied by its mean optical density.
SDS-PAGE and Immunoblotting.
To identify Gα subunits, membranes were separated on 20-cm separating gels containing 10% acrylamide and 6 M urea (Prather et al., 1994a,b, 1995; Chakrabarti et al., 1995). Before separation, samples were resuspended in 80 μl of electrophoresis loading buffer (65 mM Tris HCl, pH 6.8; 2% SDS; 10% glycerol; and 5% 2-mercaptoethanol), and heated at 90°C for 2 min. The ECL method of immunoblotting was used (Amersham). Gels were transferred to Hybond-ECL nitrocellulose membranes and incubated overnight at 4°C with 10% milk in blotting buffer (TBS-0.1%; 25 mM Tris HCl, pH 7.6; 154 mM NaCl; and 0.1% Tween 20). Blots were then washed three times (5 min each) with TBS-0.1% and incubated with primary antibodies (1:1000) for 1 h at room temperature while shaking. The primary antibodies were then removed and blots were washed as described previously. Secondary antibody (donkey anti-rabbit immunoglobin horseradish peroxidase, 1:5000) was then added and incubated for 30 min, with shaking. The secondary antibody was removed and blots were washed 3× 5-min with TBS-0.3%, followed by 3× 5-min with TBS-0.1%. Blots were then incubated for 1 min with equal volumes of ECL detection reagents 1 and 2, wrapped in plastic wrap, and exposed to Hybond-ECL X-ray film for periods varying between 30 s and 10 min.
The Gα antisera used were EC2 selective for Giα3/Goα (Simonds et al., 1989), GC2 for Goα (Spiegel, 1990), and LEP4 for Giα1/Giα2 (Prather et al., 1994b). LEP4 was developed in the laboratory of Dr. Ping-Yee Law (University of Minnesota) by immunizing rabbits with a Giα1/Giα2 C-terminal peptide.
Agonist-Stimulated [35S]GTPγS Binding Assays.
Frozen membranes were thawed and then assayed for protein (Bradford, 1976). All assays included 10 to 20 μg of membrane protein and were conducted at 30°C for 2 h with 0.1% BSA (w/v), 30 μM GDP, and 0.05 nM [35S]GTPγS in a final volume of 1 ml. Nonspecific binding was determined with 30 μM unlabeled GTPγS. WIN 55212-2 concentration-effect curves were determined by incubating membranes with various concentrations of WIN 55212-2 (0.03–30,000 nM). Reactions were terminated in all tubes simultaneously by rapid filtration under vacuum through Whatman GF/B glass fiber filters, followed by three washes with cold Tris buffer, pH 7.4. Bound radioactivity was determined by liquid scintillation spectrophotometry at 95% efficiency for 35S after overnight extraction of the filters in 4 ml of Scintisate Econo 1 scintillation fluid.
Data Analysis.
Unless otherwise stated, data represent the mean ± S.E. from at least three separate experiments that were each performed in triplicate. Data obtained from full concentration-effect curves using WIN 55212-2 were subjected to sigmoidal curve fitting with the Sigmaplot computer program. The minimum and maximum plateau values for the amount of Gα subunits activated (expressed in mean optical density units) and the amount of agonist required to produce 50% of maximal activation (ED50) were determined from the best-fit curves. The maximum amount of Gα subunits activated was defined as the difference between the minimum and maximum plateau values. Percentage of increase in G protein activation was defined as the amount of [32P]AA-GTP incorporated in the presence of agonist, divided by basal incorporation, times 100%. Net agonist-stimulated [35S]GTPγS binding values were calculated by subtracting basal binding values (absence of agonist) from agonist-stimulated values. Statistical significance of the data was determined by ANOVA followed by comparison with either the nonpaired two-tailed Student's t test or Tukey's method.
Results
Photoaffinity Label [32P]AA-GTP Identifies at Least Five Different PTX-Sensitive Gα Subunits in Cerebellar Membranes.
Because brain cannabinoid receptors are primarily coupled to PTX-sensitive G proteins (i.e., Giαand Goα subtypes), we determined the identity of these Gα subunits in rat cerebellar membranes (Fig. 1). Membranes (25 μg/sample) were incubated with the photoaffinity label [32P]AA-GTP and proteins were separated by urea/SDS-PAGE. After transfer to nitrocellulose membranes, blots were subjected to AR (Fig. 1, left), followed by immunoblotting with selective antibodies for individual Gα subunits (IB) (Fig. 1, middle). Additional samples were subjected to photoaffinity labeling with [32P]AA-GTP and subsequently immunoprecipitated with antisera specific for individual Gα subunits before separation by urea/SDS-PAGE (IP + AR) (Fig. 1). [32P]AA-GTP was incorporated into five detectable bands in the 39 to 41 kDa range, designated as proteins 1 to 5 from highest to lowest molecular mass (Fig. 1, left). The molecular mass of these photoaffinity-labeled proteins is consistent with that previously documented for Giα/Goαsubunits (Gudermann et al., 1997). Furthermore, pretreatment of cerebellar membranes with PTX altered the mobility of all five bands (data not shown), which is in agreement with evidence of the ability of PTX-catalyzed ADP-ribosylation to decrease the electrophoretic mobility of Giα and Goα proteins (Ribeiro-Neto and Rodbell, 1989).

Identification of PTX-sensitive Gαsubunits in membranes prepared from rat cerebellum. Membranes (25 μg/sample) were incubated with the photoaffinity label [32P]AA-GTP and proteins were separated by urea/SDS-PAGE. After transfer to nitrocellulose membranes, blots were subjected to AR (left), followed by immunoblotting with selective antibodies for individual Gα subunits (IB) (middle). Additional samples were subjected to photoaffinity labeling with [32P]AA-GTP and subsequently immunoprecipitated with antisera specific for individual Gα subunits before separation by urea/SDS-PAGE (IP + AR) (right). Specific Gα subunit antisera used were GC2 (top middle; Goα) or LEP4 (bottom middle; Giα1/Giα2). Antibody-protein complexes were visualized with ECL and goat anti-rabbit conjugated with horseradish peroxidase as secondary antibodies. Inset, summary autoradiogram (left) in which the G protein identity (right) of all radioactive bands is depicted.
The identity of the proteins that incorporated [32P]AA-GTP was investigated first by comparison of the electrophoretic mobilities of bands identified by AR with those identified by Western blot analysis. GC2, an antiserum selective for Goα (Spiegel, 1990), recognized three bands that migrated with identical electrophoretic mobilities as autoradiographic bands 1, 3, and 5 (Fig. 1, top middle). These bands were concluded to be Goα3, Goα1, and Goα2 from higher-to-lower molecular mass because they show similar relative mobilities in urea/SDS-PAGE to that observed recently in bovine brain (McIntire et al., 1998). In addition, our laboratory (P.L. Prather, L. Song, E.T. Piros, P.Y. Law, and T.G. Hales, unpublished observations) and others have shown that rat pituitary GH3 cells express Goα1and Goα2, but not Goα3(Spicher et al., 1992). Thus, to confirm the identity of Goα1, Goα2, and Goα3 in this study, we performed immunoblots comparing the relative electrophoretic mobilities of these Gα subunits expressed in rat cerebellum and GH3 cells (data not shown). As predicted, we observed that autoradiographic band 1 (identified above as Goα3) was present in the cerebellum, but absent in GH3 cells. LEP4, an antiserum selective for Giα1/Giα2(Prather, L. Song, E.T. Piros, P.Y. Law, and T.G. Hales, 1994b), recognized two bands that migrated with the identical electrophoretic mobilities as bands 2 and 4 identified by AR (Fig. 1, lower middle). These bands were concluded to be Giα1 and Giα2 from higher-to-lower molecular mass because they show similar relative mobilities in urea/SDS-PAGE to that observed for Giα1 and Giα2 in several other cell lines and tissues (Simonds et al., 1989; Laugwitz et al., 1993). We also probed cerebellar membranes with EC2, an antiserum that is selective for Giα3 (Simonds et al., 1989; data not shown). Although EC2 recognized a band that migrated slightly higher than Giα1, these bands could not routinely be resolved using our urea SDS-PAGE method and thus autoradiographic band 2 was designated as a band in which Giα1 and Giα3 comigrated.
The identity of these G proteins was confirmed by using a combination of IP of photolabeled Gα subunits with selective antisera followed by separation with urea/SDS-PAGE and AR (IP + AR) (Fig. 1, upper and lower right). IP and separation of photolabeled proteins from cerebellar membranes by urea SDS-PAGE with the Goα-selective antibody GC2 revealed the presence of three autoradiographic bands. These bands migrated with identical electrophoretic mobilities as proteins previously identified by both immunoblotting and AR alone as Goα3(band 1), Goα1 (band 3), and Goα2 (band 5), respectively. Furthermore, IP of cerebellar proteins labeled by [32P]AA-GTP with the Giα1/Giα2-selective antibody LEP4 revealed to presence of two autoradiographic bands that migrated with identical electrophoretic mobilities as proteins previously identified by immunoblotting and AR alone as Giα1 (band 2) and Giα2(band 4), respectively. In conclusion, our combined studies with AR, Western blotting, and IP indicated that rat cerebellar membranes contained at least six different PTX-sensitive G proteins labeled by [32P]AA-GTP (Fig. 1, inset). Their identities from higher-to-lower molecular mass were Goα3(band 1), Giα1/Giα3(band 2), Goα1 (band 3), Giα2 (band 4), and Goα2(band 5), respectively. Our findings of the PTX-sensitive Gα subunits present in rat cerebellum is in agreement with those reported previously (Matesic et al., 1991).
Activation of Cannabinoid Receptors by WIN 55212-2 Produces a Distinct Pattern of G-Protein Activation That Is Similar between Several Brain Regions.
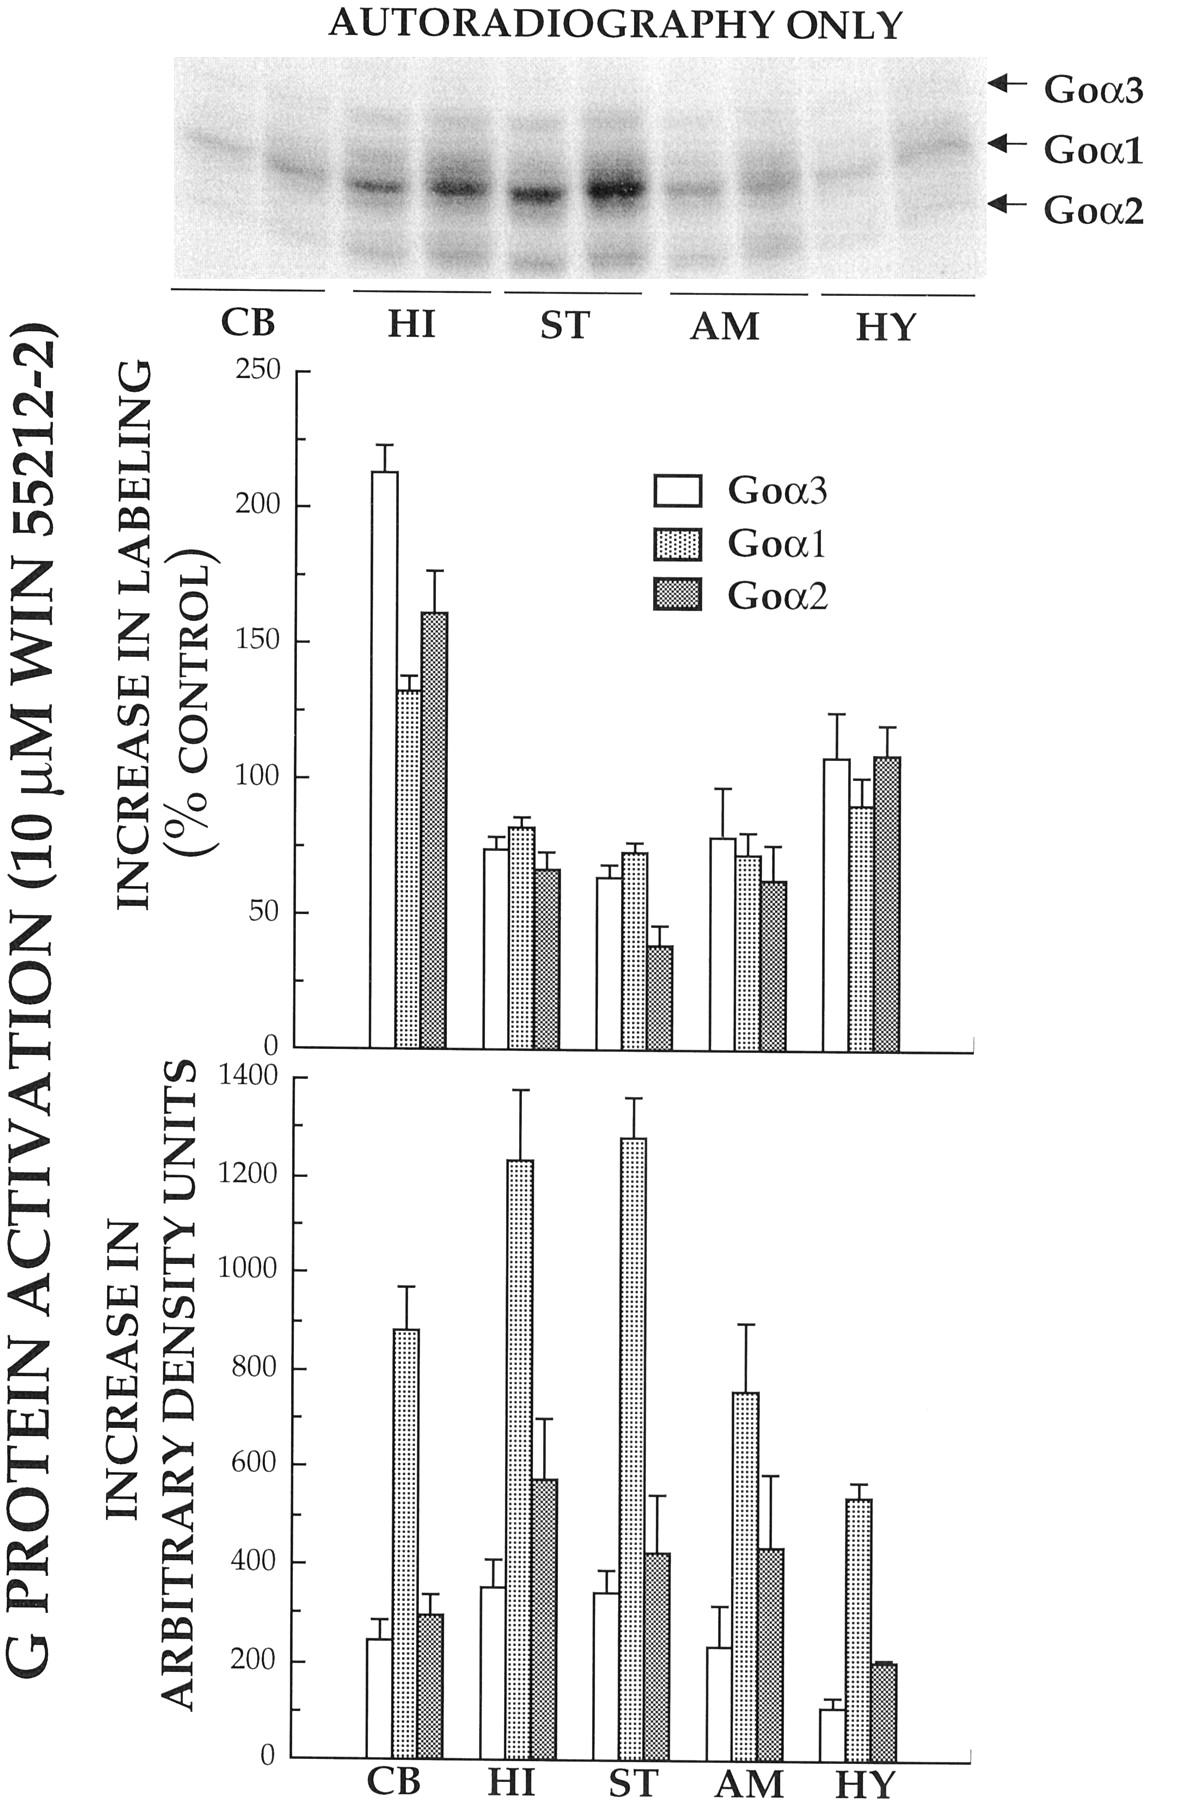
Because previous studies had shown brain regional differences in cannabinoid-activated [35S]GTPγS binding (Breivogel et al., 1997), we compared the ability of the full cannabinoid agonist WIN 55212-2 (10 μM) to activate individual Gα subunits in five rat brain regions (cerebellum, hippocampus, striatum, amygdala, and hypothalamus) (Fig. 2). When membranes prepared from each of these regions were incubated with [32P]AA-GTP in the presence of a maximally effective concentration (10 μM) of the cannabinoid agonist WIN 55212-2, agonist-stimulated [32P]AA-GTP labeling was observed in all five of the previously identified autoradiographic bands (Fig. 2, upper inset). However, because the relatively high optical density of Goα1 (band 3) interfered with the densitometric quantification of Giα1/Giα3 (band 2) and Giα2 (band 4), agonist-induced increases in photoaffinity labeling were only determined for Goα3 (band 1), Goα1(band 3), and Goα2 (band 5). With the exception of the cerebellum, WIN 55212-2 produced similar percentage increases (70–108%) in the activation of all G proteins examined (Fig. 2, top). Interestingly, in the cerebellum greater overall percentage of stimulation of G proteins and a slightly different pattern was observed, with the most stimulation for Goα3(212%) and similar levels of activation of Goα2 (161%) and Goα1(132%). When the data were presented as amount of G protein stimulated (i.e., increase in optical density units), the pattern of Gα subunit activation by WIN 55212-2 was similar for all brain regions, with the greatest amount of activation of Goα1, followed by similar stimulation of Goα3 and Goα2 (Fig. 2, bottom).

Activation of individual Gα subunits by WIN 55212-2 in membranes prepared from several rat brain regions. Top, autoradiogram of Gα subunits photoaffinity labeled with [32P]AA-GTP (1 μCi) in the absence (left lanes) or presence (right lanes) of a maximal concentration of the cannabinoid agonist WIN 55212-2 (10 μM) in membranes (25 μg) prepared from cerebellum (CB), hippocampus (HI), striatum (ST), amygdala (AM), or hypothalamus (HY). Photolabeled Gα subunits were subsequently separated by urea/SDS-PAGE, exposed for AR and quantified by densitometry. To determine the amount of relative radioactivity incorporated by individual G proteins, the area of each band was traced and multiplied by its mean optical density. Data are presented as the percentage increase in G protein labeling from control (middle) and the increase in mean optical density units (bottom) for each brain region examined. The values presented represent the mean ± S.E. from four separate experiments.
Total G protein activation was compared across brain regions with two independent methods of G protein activation by agonist: [32P]AA-GTP photoaffinity labeling and [35S]GTPγS binding (Table1). In general, the two methodologies produced parallel results across these brain regions. When data were calculated in absolute units of net activation by WIN 55212-2 (net optical density units from 32P AR, and net picomoles per milligram of [35S]GTPγS), total G protein activation by WIN 55212-2 was fairly uniform across the five regions, agreeing with previous results of WIN 55212-2-stimulated [35S]GTPγS binding in brain membranes (Selley et al., 1996). However, when data were expressed as percentage of stimulation by WIN 55212-2, considerable regional variations in agonist effects were observed. Although the percentage of stimulation by WIN 55212-2 was considerably higher for [35S]GTPγS binding compared with [32P]AA-GTP labeling (676 versus 131% in cerebellum, respectively), in both assays, WIN 55212-2 produced the greatest percentage of increase in cerebellum, largely because of the relatively low levels of basal [32P]AA-GTP labeling and [35S]GTPγS binding in this region (data not shown). The relative rank order of the percentage of stimulation of total G proteins by WIN 55212-2 in these distinct brain regions was slightly different when determined by [32P]AA-GTP photoaffinity labeling versus [35S]GTPγS binding (Table 1), but these differences were minor and probably reflected the differences in signal between the two assays. The increase in [32P]AA-GTP incorporation into the different G proteins by WIN 55212-2 was the result of activation of CB1 receptors because the cannabinoid antagonist AM 281 (Gifford et al., 1997) reduced total G protein activation in the cerebellum by WIN 55212-2 (10 μM) in a concentration-dependent manner, with a maximal inhibition of 80% produced at 10 μM AM281 (Fig. 3).
Maximal activation of total G proteins by WIN 55212-2 in rat brain regions by [35S]GTPγS binding or [32P]AA-GTP photoaffinity labeling

Reversal of WIN 55212-2-induced activation of G proteins by the cannabinoid antagonist AM 281 in membranes prepared from rat cerebellum. Rat cerebellar membranes (25 μg) were incubated with the photoaffinity label [32P]AA-GTP (1 μCi) and a maximal concentration of the cannabinoid agonist WIN 55212-2 (10 μM) in the presence of increasing concentrations (0.001–10 μM) of the cannabinoid antagonist AM 281. Photolabeled Gα subunits were subsequently separated by urea/SDS-PAGE, exposed for AR, and quantified by densitometry. To determine the amount of relative radioactivity incorporated by individual G proteins, the area of each band was traced and multiplied by its mean optical density. The percentage of maximum response of total G protein activation by 10 μM WIN 55212-2 (i.e., the sum of all individual Gα subunits) is plotted against the corresponding antagonist concentrations. The values presented for each concentration of AM 281 (0.001–1 μM) are the results of a single experiment, whereas the values presented for the 10 μM concentration of AM 281 represent the mean ± S.E. from four separate experiments.
WIN 55212-2 Activates Multiple G Proteins with Different Potencies in Cerebellar Membranes.
WIN 55212-2 produced the greatest activation and a distinct pattern of G protein coupling in the cerebellum. Thus, we chose this brain region to use full WIN 55212-2 concentration-effect curves to examine G protein activation. We have previously observed that concentration-effect curves for cannabinoid-stimulated [35S]GTPγS binding are characteristically very shallow, often extending three or four orders of magnitude (Breivogel et al., 1997, 1998). In this study, we compared the concentration-effect curves for WIN 55212-2-induced total G protein activation with both [32P]AA-GTP photoaffinity labeling and [35S]GTPγS binding (Fig.4). Both methods produced similar shallow curves with Hill slope values of 0.75 for [35S]GTPγS and 0.73 for [32P]AA-GTP. Moreover, for both radioligands, G protein activation was significant beginning with 0.01 μM WIN 55212-2 and not reaching maximal stimulation until 3 to 10 μM. The concentration of WIN 55212-2 required to produce 50% of the maximum stimulation was 1.02 μM for [32P]AA-GTP photoaffinity labeling and 0.241 μM for [35S]GTPγS binding (Table2).
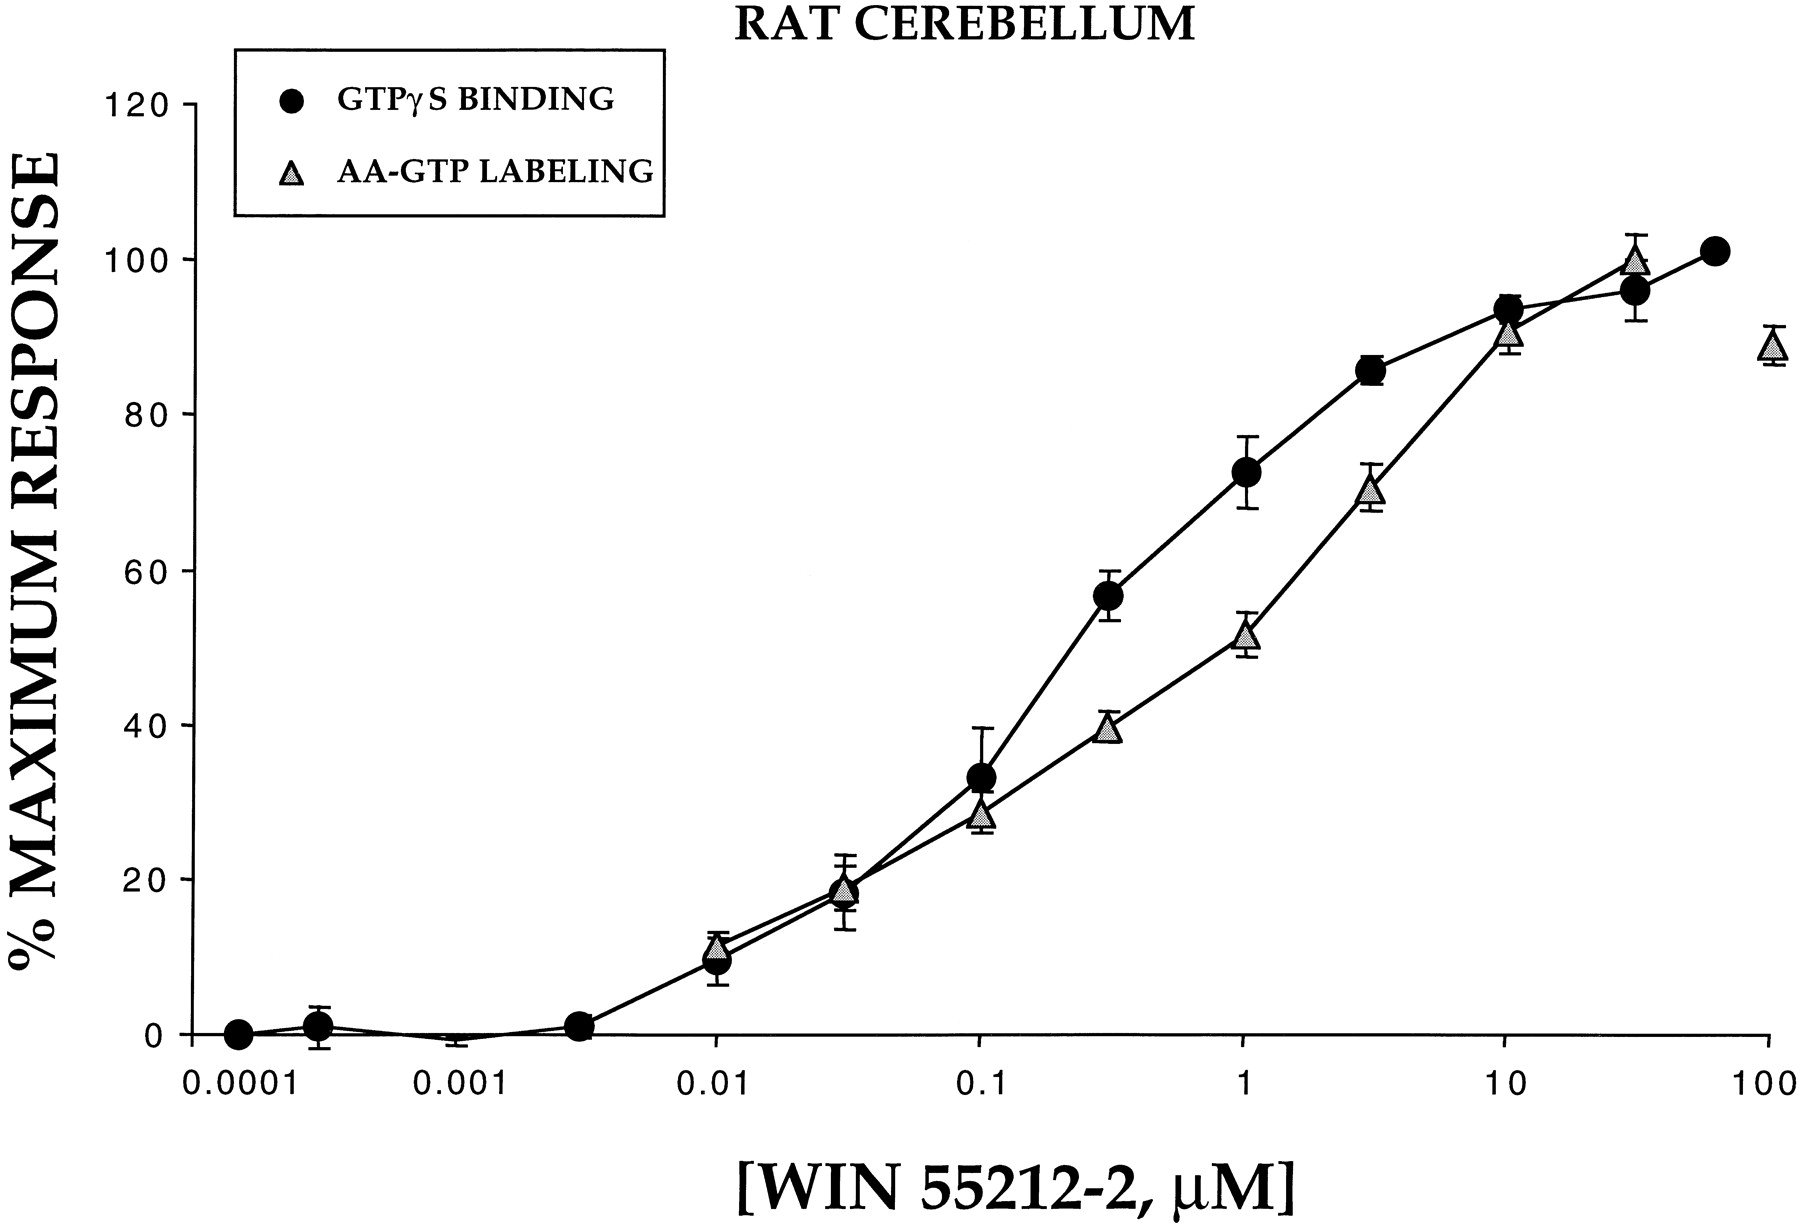
Concentration-dependent activation of total G proteins by WIN 55212-2 determined by [35S]GTPγS binding and [32P]AA-GTP photoaffinity labeling in membranes prepared from rat cerebellum. The ability of increasing concentrations (0.0003–100 μM) of the cannabinoid agonist WIN 55212-2 to produce increases in [35S]GTPγS binding (●) and [32P]AA-GTP photoaffinity labeling (▴) of total G proteins in membranes prepared from rat cerebellum was evaluated. Data are presented as percentage of maximum response; absolute values for [35S]GTPγS were 0.04 pmol/mg basal and 0.27 pmol/mg stimulated, whereas values for [32P]AA-GTP were 873 optical density units basal and 2001 optical density units stimulated. Data represent the mean ± S.E. from a minimum of four experiments.
Potency and efficacy of WIN 55212-2-induced activation of G protein α-subunits determined by concentration-dependent [32P]AA-GTP labeling in rat cerebellar membranes
To examine cannabinoid activation of individual Gα subunits, cerebellar membranes were incubated with [32P]AA-GTP and increasing concentrations of WIN 55212-2 (0.01–100 μM). After UV-irradiation, photoaffinity-labeled proteins were directly separated by SDS-PAGE gels containing 6 M urea and exposed for AR (Fig.5). A typical autoradiograph of these experiments is presented in the inset above the graph in which it can be observed that increasing concentrations of agonist produces dose-dependent increases in the amount of incorporation of [32P]AA-GTP into all of the previously identified Gα subunits (Fig. 1). After densitometric quantification of seven complete concentration-effect curves, the graph illustrates that WIN 55212-2 activates individual Gα subunits with different potency (Fig. 5; Table 2). For example, although only 0.25 and 0.28 μM WIN 55212-2 was required to half-maximally activate Goα3 and Goα1, respectively, up to 11-fold greater concentrations of agonist were required to produce 50% activation of Goα2 (2.86 μM) (Table 2). The maximal percentage of increase in G protein activation values were similar to those presented in Fig. 2 in response to a single 10 μM concentration of WIN 55212-2 with similar levels of activation for Goα3 (192%), Goα1(172%), and Goα2 (168%).
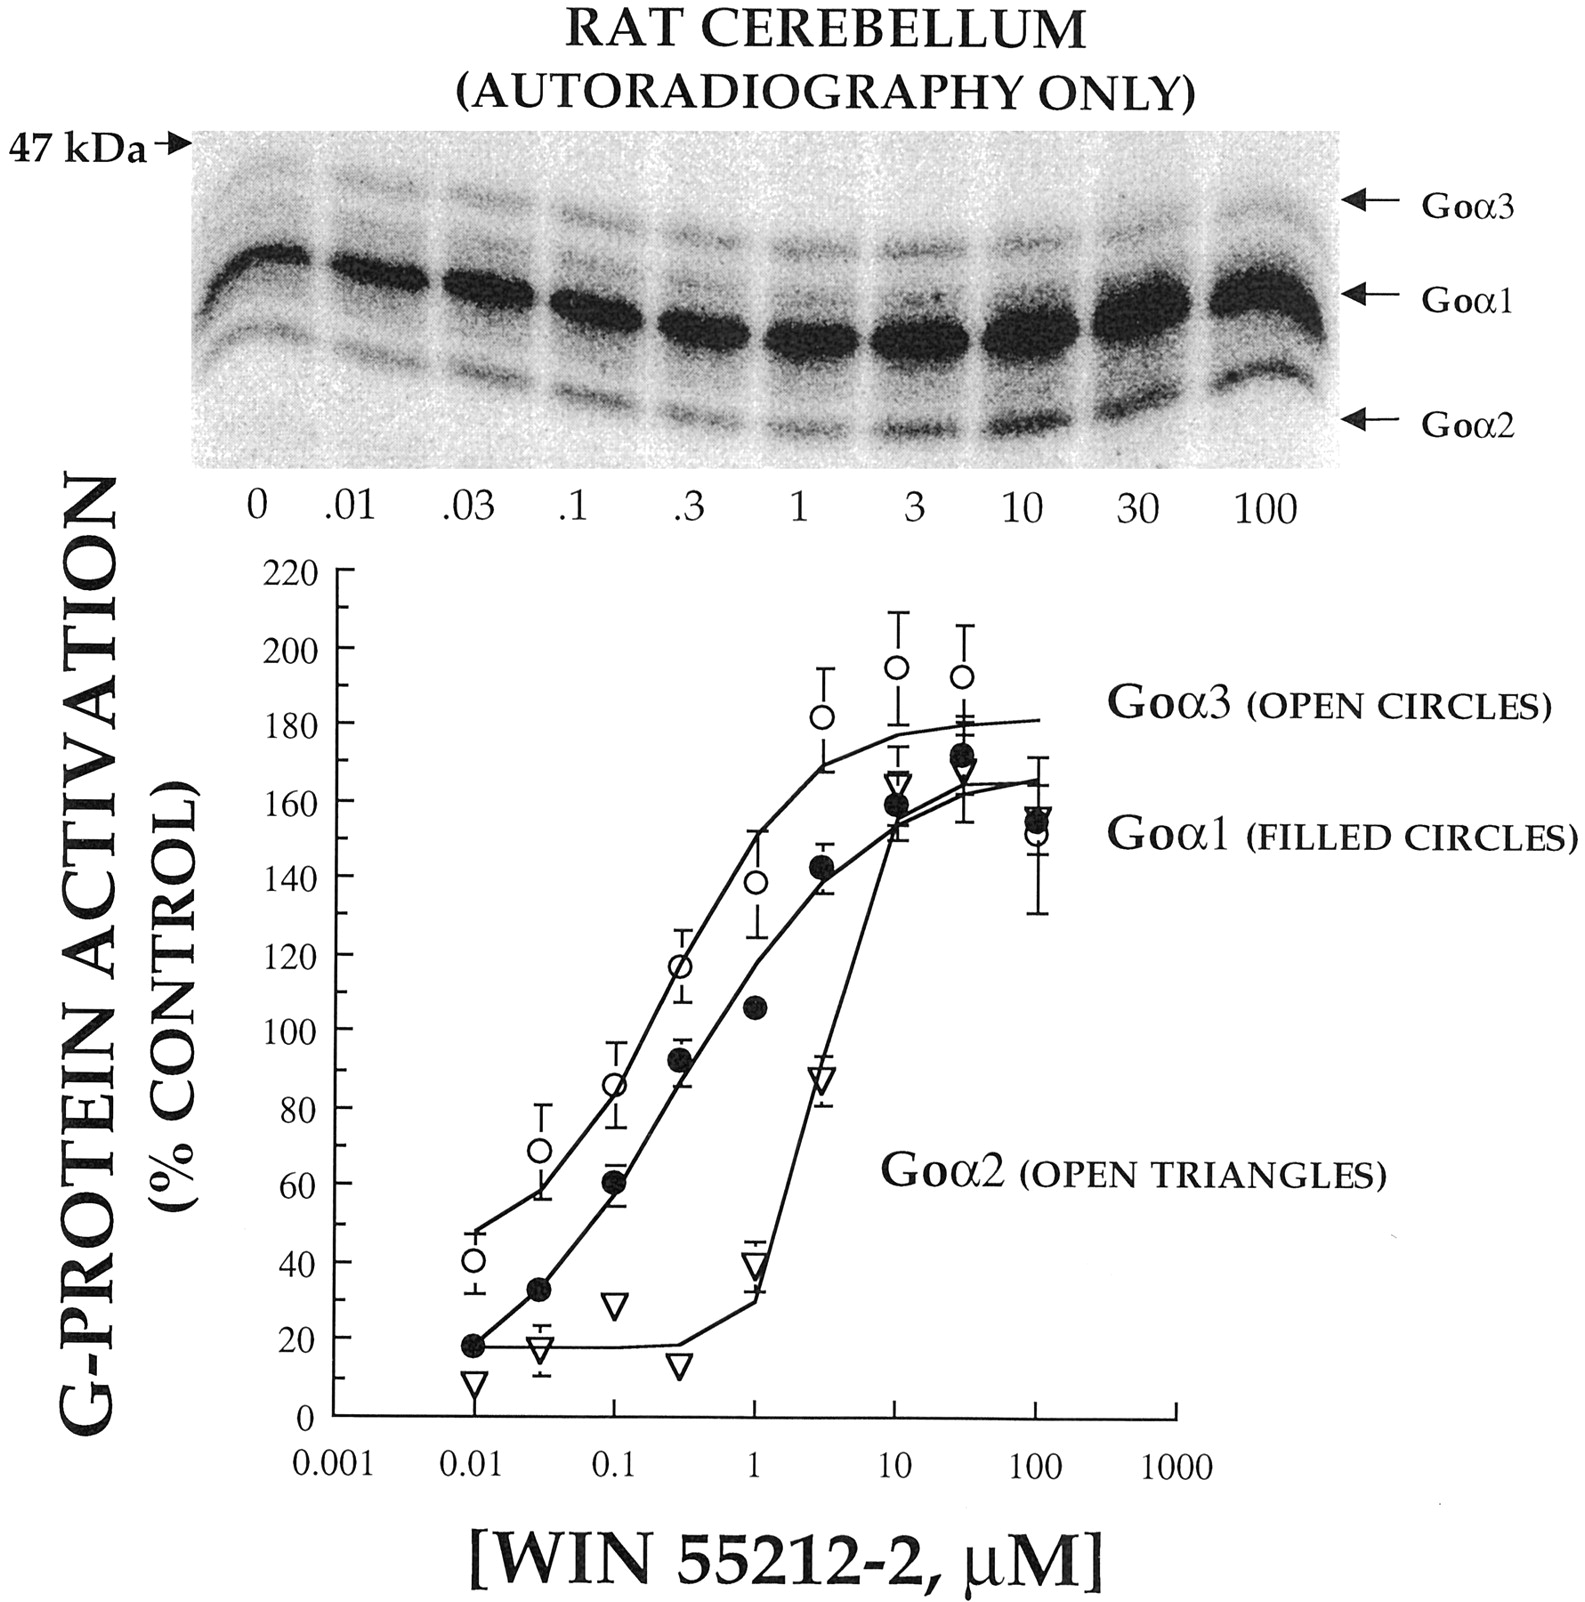
Concentration-dependent [32P]AA-GTP labeling of individual PTX-sensitive G protein α-subunits by the cannabinoid agonist WIN 55212-2 in rat cerebellar membranes (AR only). Top, autoradiogram of Gα subunits photoaffinity labeled with [32P]AA-GTP (1 μCi) in the presence of increasing concentrations (0.01–100 μM) of the cannabinoid agonist WIN 55212-2 in rat cerebellar membranes (25 μg), separated by urea/SDS-PAGE. Bottom, to determine the amount of relative radioactivity incorporated by individual Gα subunits, the area of each band was traced and multiplied by its mean optical density. The activation of each Gα subunit activated, expressed as percentage of increase from control, is plotted against the corresponding WIN 55212-2 concentrations. The values presented for each concentration represent the mean ± S.E. from seven separate experiments.
Interestingly, it appeared that bands above and below Goα1 also required greater amounts of WIN 55212-2 to produce half-maximal activation than Goα3 or Goα1 (Fig. 5, inset). However, because of the high density of Goα1, it was difficult to accurately quantify agonist-induced increases in these Gα subunits with only AR. From our initial determination of the different Gα subunits expressed in the cerebellum (Fig.1), it was possible that these G proteins might be Giα1/Giα3 (above) and/or Giα2 (below). Therefore, to confirm our results with Goα and to determine the activation of Giα1 and Giα2 by WIN 55212-2, photoaffinity-labeled Gα subunits were first immunoprecipitated with antisera specific for Goα (Fig.6, left) or Giα1/Giα2 (Fig. 6, right) before electrophoresis. This combined technique confirmed our previous findings using only AR: i.e., WIN 55212-2 activates individual Goα subunits with different potencies (Fig. 6; Table 2). Only 0.15 and 0.26 μM WIN 55212-2 was required to half-maximally activate Goα3 and Goα1, respectively, whereas up to 25-fold greater concentrations of agonist were required to produce 50% activation of Goα2 (3.67 μM; Table 2). Interestingly, the slopes of the dose-response curves for WIN 55212-2 activation of all Gα subunits except Goα2 were similar and not significantly different from one another. However, both methods revealed a relatively steep slope (∼2) for agonist-induced activation of Goα2. Neither the potency nor the efficacy of Goα activation by WIN 55212-2 was significantly different when determined by the two different experimental methods. In addition, we demonstrated that WIN 55212-2 dose-dependently activated two additional Gα subunits, Giα1 and Giα2, requiring 0.1 or 0.62 μM to produce half-maximal effects, respectively (Fig. 6; Table 2). No significant differences in the maximal percentage of increase of G protein activation by WIN 55212-2 between any of the Gα subunits were observed when determined by either experimental method.

Concentration-dependent [32P]AA-GTP labeling of individual PTX-sensitive G protein α-subunits by the cannabinoid agonist WIN 55212-2 in rat cerebellar membranes (IP + AR). Top, autoradiogram of Gα subunits photoaffinity labeled with [32P]AA-GTP (1 μCi) in the presence of increasing concentrations (0.03–10 μM) of the cannabinoid agonist WIN 55212-2 in rat cerebellar membranes (25 μg), first immunoprecipitated with antisera specific for Goα (left) or Giα1/Giα2 (right) before separation by urea/SDS-PAGE. Bottom, to determine the amount of relative radioactivity incorporated by individual Gα subunits, the area of each band was traced and multiplied by its mean optical density. The activation of each Gα subunit activated, expressed as percentage of increase from control, is plotted against the corresponding WIN 55212-2 concentrations. The values presented for each concentration represent the mean ± S.E. from four or five separate experiments.
Discussion
It is generally accepted that cannabinoid receptors relay intracellular signals by coupling primarily to PTX-sensitive G proteins (Howlett, 1995). However, because CB1 receptors have the potential to interact with several isoforms of Giα/Goα proteins expressed in the brain (i.e., Giα1, Giα2, Giα3, Goα1, Goα2, and Goα3), the potential exists for significant diversity in intracellular signaling produced by cannabinoid agonists. The initial finding of this study, that the full cannabinoid agonist WIN 55212-2 activates at least five different Gα subunits in the Giα/Goα family, confirms previous findings that GPCRs can activate the full spectrum of G proteins that are available in the relevant cell types (Goetzl et al., 1994; Liu et al., 1994; Prather et al., 1994a,b,1995; Chakrabarti et al., 1995), and represents the first report of the simultaneous activation of several individual Gα subunits in brain by endogenous cannabinoid receptors. The finding that Goα activation by cannabinoids predominates in brain compared with Giα activation is predictable, based on previous reports that Goα subunits are in significant excess over Giα in brain (Sternweis and Robishaw, 1984; Spicher et al., 1992). Indeed, in agreement with these and other studies, the basal labeling patterns of [32P]AA-GTP in this study suggest that Goα1 is the predominant G protein subtype expressed in rat brain.
This study also represents the first direct comparison between cannabinoid activation of brain G proteins by two different approaches: [32P]AA-GTP photoaffinity labeling and [35S]GTPγS binding. There are a number of important similarities between the results of these two methods, including the concentration-effect curves for WIN 55212-2 and the overall regional distribution of agonist stimulation. The differences noted in the relative regional distribution of agonist stimulation between the two assays is probably related to the considerable differences in the level of percentage stimulation observed. This difference is inherent in the basic properties of the two procedures and is the result of a number of factors. First, the affinity of GTPγS for the agonist-activated form of Gα is higher than that of [32P]AA-GTP (D. E. Selley and S.R.C, unpublished observations). Second, the concentrations of the two radioligands are very different: 0.05 nM for [35S]GTPγS and 3 nM for [32P]AA-GTP. Finally, the fold stimulation is clearly affected by the ratio of radioligand to GDP, which is used in both assays to reduce basal radioligand binding.
We have previously shown that the amplification factors for cannabinoid receptors, defined as the number of total G proteins activated per occupied receptor, differed between several rat brain regions (Breivogel et al., 1997). If different brain regions possess unique stoichiometric compositions of cannabinoid receptors and G proteins, it is possible that cannabinoid receptors might activate different subtypes of Giα/Goαsubunits with varying degrees of efficiency that would differ between brain regions. To test this hypothesis, this study found that activation of CB1 receptors by WIN 55212-2 resulted in coupling to a distinct pattern of at least five different Giα/Goα subunits in several brain regions. Interestingly, with the exception of slight differences in the cerebellum, the pattern of Goα activation by cannabinoid receptors was similar between all brain regions examined. Additionally, when total G protein activation was compared across brain regions, WIN 55212-2 produced the greatest percentage of increase in the cerebellum, followed by the hypothalamus > hippocampus = striatum = amygdala. This was similar to the regional distribution of WIN 55212-2-stimulated [35S]GTPγS binding previously reported in brain membranes with 10 μM WIN 55212-2 (Selley et al., 1996). Because the overall pattern of individual Gα labeling by WIN 55212-2 was similar between regions previously shown to have significant differences in receptor/G protein amplification by [35S]GTPγS and [3H]WIN 55212-2 binding (Breivogel et al., 1997), it is unlikely that the differences in receptor/G protein amplification are primarily mediated by different populations of Gα activation by CB1 receptors.
When activation of individual Gα subunits by WIN 55212-2 was examined using [32P]AA-GTP photoaffinity labeling, it was demonstrated that the agonist activated different subtypes of Giα/Goα subunits with varying degrees of potency. For example, low agonist concentrations (0.10–0.62 μM) preferentially activated several G protein subtypes (i.e., Goα1, Goα3, Giα1, and Giα2), whereas Goα2 was stimulated at higher concentrations of agonist (i.e., 3.7 μM). It was also evident from the autoradiograms that several minor bands were activated at higher agonist concentrations like Goα2, but the inability of the IP procedures to adequately separate and identify these bands precluded their precise identification. Interestingly, the overall EC50 values for WIN 55212-2 in stimulating [35S]GTPγS binding (0.24 μM) and [32P]AA-GTP photoaffinity labeling (1 μM; see Fig. 4) are intermediate between these values of WIN 55212-2 in activating Goα2 and the other Gα subunits. Moreover, the potencies reported for G protein activation in this study correlate well with those for regulation of some intracellular effectors by WIN 55212-2. For example, the potency of WIN 55212-2 in inhibiting cAMP levels in intact cerebellar granule cells is 0.41 μM (Pacheco et al., 1993). However, the potency of WIN 55212-2 (<10 nM) in modulating calcium conductance in these cells (Gruol et al., 1996) is much higher than the >100 nM potencies observed in this study; it is possible that some effectors require less than full receptor occupancy to produce full responses.
Although the number of studies using full concentration-effect curves to examine the activation of individual Gαsubunits by GPCRs are few, review of the current literature indicates that our observations are unique. Offermanns et al. (1994) observed a 20-fold difference in the concentration of carbachol required to activate Giα1/Giα3, relative to Gqα/11, by m1 and m3 muscarinic receptors. However, these findings are not as surprising because Giα1/Giα3, and Gqα/11 are members of completely different classes of Gα subunits. In contrast, the potency of μ-, δ-, and κ-opioid agonists required for half-maximal activation of individual Gαsubunits within the same Giα/Goα class have been shown to differ by only by 2- to 3-fold (Prather et al., 1994a,b, 1995;Chakrabarti et al., 1995). Therefore, the 36-fold difference in the amount of WIN 55212-2 required to activate individual Gα subunits within the same G protein class (i.e., Giα/Goα) observed in this study may indicate an unique property of cannabinoid receptor signal transduction and/or of the agonist WIN 55212-2.
It is possible that the shallow concentration-effect curves for G protein activation by WIN 55212-2 is produced by these differences in agonist potencies in activating individual Gαsubunits. However, this is not likely for several reasons. First, the contribution of Goα2 compared with the other Gα subunits is relatively low. Even if other minor bands are activated with the same lower agonist potency as Goα2, it still appears likely that the overall stimulation of Gα subunits would be dominated by Goα1, as well as the other bands activated with higher agonist potencies. Second, previous studies (Breivogel et al., 1998) have demonstrated the importance of multiple-affinity states for agonist binding to cannabinoid receptors themselves in producing the overall activation of brain G proteins. Therefore, although differences in agonist potencies at individual Gα subunits may contribute somewhat to shallow concentration-effect curves for agonists, it is likely that this phenomenon is produced by a complex interrelationship between agonist, receptor and G protein.
This study has not addressed the potential mechanisms that would produce different potencies of a single cannabinoid agonist in activating different Gα subunits. One possibility is that WIN 55212-2 may be acting at different cannabinoid receptor subtypes in brain with differential affinities for different Gα subunits. A detailed pharmacological analysis comparing the potencies and efficacies of various cannabinoid agonists in activating individual Gα subunits should help address this question, and is currently underway in our laboratories. Another possibility is that the quantity of individual Gα subunits present in relevant neurons provides a major determinant driving receptor/G protein coupling. It is possible that the receptor interacts more readily with Goα subunits because of their relative abundance compared with Giα, even though the affinity of the receptor for Giαmight be higher. However, this hypothesis does not explain why in this study the potency of WIN 55212-2 to activate Goα1 and Goα3 is similar, despite the vast differences in their abundance as determined by [32P]AA-GTP labeling. Finally, a recent study found that the stability of the ternary complex formation of A1-adenosine receptors was determined by the dissociation rate of interacting G proteins (Waldhoer et al., 1999). They hypothesize that although agonists may promote interaction of G protein-coupled receptors with several different types of Gα subunits, only those G proteins that dissociate from the receptor slowly would allow sufficient stability of the ternary complex to result in productive signal transduction. Their results suggest that although low concentrations of agonist are required to produce efficient coupling of receptors to physiological G proteins, higher concentrations may provide sufficient ternary complex stability to allow activation of nonphysiological G proteins. Therefore, it is possible that higher concentrations of WIN 55212-2 are required to provide sufficient stability of the cannabinoid receptor ternary complex to observe activation of Goα2.
Our findings enhance the level of current understanding of cannabinoid-coupled signal transduction and may have significant ramifications for potential development of new therapeutic agents. It is well known that cannabinoid receptors regulate the activity of several intracellular effectors, including inhibition of adenylyl cyclase (Howlett, 1984), inhibition of voltage-gated Ca2+ channels (Mackie et al., 1995), activation of inwardly rectifying K+ channels (Mackie et al., 1995), and activation of mitogen-activated protein kinase (Bouaboula et al., 1995). It also has been established that distinct Gα subunits can couple GPCRs to specific effectors. For example, Giα2 couples δ-opioid receptors to adenylyl cyclase (McKenzie and Milligan, 1990), whereas muscarinic and somatostatin receptors produce inhibition of Ca2+ channels through Goα1 and Goα2,respectively (Kleuss et al., 1991). Therefore, data from this study suggest that cannabinoid receptors may produce distinct intracellular signals by activation of a specific pattern of G proteins responsible for regulation of a unique blend of intracellular effectors in a concentration-dependent manner. Thus, at low concentrations of agonist certain intracellular effectors might preferentially be activated by specific Gα subunits, and coupling to additional effectors would be recruited at higher concentrations of agonist required to activate additional G protein subtype(s). These data may help to explain why cannabinoid agonists inhibit adenylyl cyclase and modulate calcium conductance with different potencies in the same cells (Pacheco et al., 1993; Gruol et al., 1996). The complexity, and hence, potential flexibility of cannabinoid-mediated signal transduction is increased further given that different regions of the brain posses different stoichiometric compositions of cannabinoid receptors, G proteins, and effectors (Breivogel et al., 1997). Last, with the observation that different types of opioid- (Standifer and Pasternak, 1997) and cannabinoid- (Cook et al., 1995) induced antinociception may be mediated in part by specific Gα subtypes, it might be possible to develop agonists that at optimal concentrations preferentially activate Gα subunits responsible for the therapeutic effects of cannabinoids (i.e., antinociception), while avoiding activation of other Gα subunits potentially mediating undesirable actions (i.e., disruption of short-term memory).
Footnotes
-
Send reprint requests to: Paul L. Prather, Ph.D., Department of Pharmacology and Toxicology, Mail Slot 611, University of Arkansas for Medical Sciences, 4301 W. Markham St., Little Rock, AR 72205. E-mail: pratherpaull{at}exchange.uams.edu
-
This study was supported in part by National Institute on Drug Abuse Grants DA10936 (to P.L.P.) and DA06784 and DA06634 (to S.R.C.).
- Abbreviations:
- GCPR
- G protein-coupled receptor
- PTX
- pertussis toxin
- GTPγS
- guanosine-5′-O-(3-thio)triphosphate
- AA-GTP
- azidoanilido-guanosine-5′-O-(3-thio)triphosphate
- PAGE
- polyacrylamide gel electrophoresis
- IP
- immunoprecipitation
- AR
- autoradiography
- ECL
- enhanced chemiluminescence
- Received July 26, 1999.
- Accepted February 2, 2000.
- The American Society for Pharmacology and Experimental Therapeutics


