


Abstract
The present studies were performed to elucidate the mechanism of cytotoxicity of the aminoflavone analog (5-amino-2,3-fluorophenyl)-6,8-difluoro-7-methyl-4H-1-benzopyran-4-one (AF; NSC 686288), a novel flavone with potent in vitro and in vivo antiproliferative activity against a number of human tumor cell lines and with a unique pattern of antiproliferative activity in the National Cancer Institute tumor cell line screen. AF was extensively metabolized by cytochrome P450 (P450) 1A1 and 1A2 to several metabolites, one of which was identified by mass spectrometry as a potentially reactive hydroxylamine. Radiolabeled AF was converted by rat and human microsomes, by recombinant CYP1A1 and CYP1A2, and by sensitive human tumor cell lines to species that covalently bound macromolecules. Treatment of sensitive human MCF7 cells with AF resulted in increased CYP1A1 mRNA and CYP1A1/1A2 protein followed by covalent binding of an AF metabolite to DNA, phosphorylation and stabilization of p53, and increased expression of the p53 transcriptional target p21. Covalent binding of the AF metabolite was increased by pretreatment with the CYP1A inducer 3-methylcholanthrene and decreased by coincubation with the CYP1A inhibitor α-naphthoflavone. In contrast, induction of CYP1A1 and covalent binding of the AF metabolite did not occur in AF-resistant M14-MEL cells. These observations suggest that AF is uniquely able to induce its own metabolic activation via CYP1A1/1A2 in duction to cytotoxic DNA-damaging species directly in tumor cells. AF, and possibly other agents, may offer a treatment strategy for tumors responsive to CYP1A1/1A2 induction, such as breast, ovarian, and renal cancers.
AF (Fig. 1) is one of a series of diaminoflavone analogs with potent in vitro growth-inhibitory activity against MCF7 human breast cancer cells (Akama et al., 1996). Additionally, AF was active against a number of cell lines in the NCI human tumor in vitro screen, including chemotherapy-resistant ovarian, renal, and breast cell lines [Developmental Therapeutics Program DCTP (http://www.dtp.nci.nih.gov)]. AF was also highly active, in the absence of specific organ toxicities, in mice bearing some of those same xenografts (Alley et al., 1999). Of particular interest, AF produced a unique COMPARE (Weinstein et al., 1997) pattern of activity in the in vitro screen with no statistically significant correlation to patterns of activity of known classes of antitumor agents (http://www.dtp.nci.nih.gov). A unique pattern of activity for a new agent in this screen is consistent with a novel mechanism of drug action. Based in part on these results, AF is currently undergoing preclinical evaluation as a prelude to clinical trials.

Aminoflavone structure.
The mechanism of AF cytotoxicity is unknown. The antiproliferative activity of other flavonoid analogs in preclinical tumor model systems (Cushman and Nagarathnam 1991; Akama et al., 1997, 1998) has been attributed to inhibition of topoisomerases (Yamashita et al., 1990), tubulin polymerization (Shi et al., 1998), or protein kinase activities (Ferriola et al., 1989; Cushman et al., 1994). However, drugs with those mechanisms of action do not have COMPARE profiles similar to that of AF in the NCI cell line screen.
One potential explanation for a unique pattern of activity would be the selective metabolic activation of AF by some tumor cells but not others. Although some flavonoids are P450 inhibitors (Zhai et al., 1998), many flavonoids are also metabolized by these enzymes, especially CYP1A isoforms (Nielsen et al., 1998). P450s transform many drugs to less active and more polar biotransformation products; however, CYP1A1 and CYP1A2 also catalyze the hepatic activation of certain drugs (Guengerich 1988). CYP1A1 and CYP1A2 protein expression and catalytic activities are induced in the liver and other tissues by some of those same substrates (Eaton et al., 1995). In particular, flavonoids have been reported to bind to the Ah receptor involved in CYP1A isoform induction, leading to increased synthesis of CYP1A1 and CYP1A2 (Huang et al., 1981; Lu et al., 1995, 1996). In addition, P450s are involved in enzymatic activation of a number of antitumor agents in the liver (e.g., cyclophosphamide, dacarbazine, andtrans-retinoic acid), lending plausibility to the idea that a cytotoxic flavonoid might induce the P450s that metabolize it to active species. On the other hand, there are few examples of agents able to induce their own metabolic activation in tumor cells. Indeed, although P450 isoforms have been detected in tumor cells, current dogma suggests that P450 levels in tumor cells are too low to play a major role in drug metabolism.
The present studies were undertaken to investigate the mechanistic basis for the unique pattern of tumor cell sensitivity to AF. Initial studies demonstrated that human CYP1A1 and CYP1A2 play a major role in AF metabolism. In particular, recombinant human CYP1A1 and CYP1A2 metabolized radiolabeled AF to reactive intermediates that covalently bind to macromolecules. When radiolabeled AF was incubated with a series of human tumor cell lines, the extent of covalent binding to cellular macromolecules was correlated with tumor cell line sensitivity to AF. Moreover, incubation of AF with a sensitive (but not resistant) human tumor cell line resulted in induction of CYP1A1/1A2 expression, covalent binding of radiolabeled AF to cellular DNA, phosphorylation and associated stabilization of the tumor suppressor protein p53, and induction of the p53 transcriptional target p21. Preliminary accounts of some of these results have been published in abstract form (Kuffel et al., 1999, 2000). These observations document the capability of some but not all human tumor cells to directly activate molecules, such as AF, to cytotoxic species and suggest a novel explanation for the currently unexplained activity profiles of AF and certain other molecules in human cancer cell lines.
Materials and Methods
Chemicals and Reagents.
AF was obtained from the Pharmaceutical Resources Branch, National Cancer Institute (Bethesda, MD). Radiolabeled AF [(5-amino-2,3-fluorophenyl)-6,8-difluoro-7-[14C]methyl-4H-1-benzopyran-4-one] was synthesized at Research Triangle Institute (Research Triangle Park, NC) and provided by the National Cancer Institute. NADPH, 3-MC, αNF,N-acetyl-Leu-Leu-Nle-al, and Tween 20 were purchased from Sigma-Aldrich (St. Louis, MO). Trypsin, RPMI 1640 medium, Dulbecco's modified Eagle's medium, and fetal bovine serum were purchased from Invitrogen (Carlsbad, CA). All other reagents and HPLC solvents were the highest grade available.
HPLC Analysis of AF and Metabolites.
AF was quantitated with a reverse-phase HPLC method employing a Jones Chromatography Genesis C18 column (250 × 4.6-mm, 4-μm; Jones Chromatography, Inc., Lakewood, CO) with a Brownlee RP-18 guard column (PerkinElmer Life Sciences, Boston, MA) on a Shimadzu system (Shimadzu Corp., Kyoto, Japan). The mobile phase consisted of MeOH/H2O/acetic acid (74:26:0.5, v/v/v) with a flow rate of 1 ml/min and UV detection at 352 nm. Three volumes of acetonitrile were added to incubation mixtures, and protein was precipitated by centrifugation (2000g for 10 min). Supernatants were diluted 1:1 with H2O, and aliquots were injected for analysis. αNF served as the internal standard.
HPLC-MS/MS Analysis of AF and Metabolites.
HPLC analysis of AF and metabolites was performed on a Shimadzu LC-10AD pump system equipped with a Shimadzu SCL-10Avp pump controller. Chromatographic separations were achieved with a Genesis C18 column (1 × 250-mm, 4-μm) with a flow rate of 50 μl/min with an isocratic mobile phase of 45% mobile phase A and 55% mobile phase B (A = 50:50:1, methanol/H2O/acetic acid, v/v/v; B = 98% methanol/2% H2O). MS/MS analyses were performed online with a ABI 365 triple quadrupole MS system (Applied Biosystems/MDS Sciex, Foster City, CA) equipped with a standard electrospray ion source. MS/MS experiments were carried out by selecting protonated molecules [M + H]+(m/z 321 and 337; parent and hydroxylamine metabolite, respectively) using Q1(MS1) and then subjecting them to collisionally induced dissociation in Q2 by collisions with ambient air with a collision energy of 40 eV. The product ions were analyzed in Q3(MS2) over the mass range of 50 to 350 amu at 0.8 ms dwell time over a 0.1-amu step.
Rat and Human Microsomal Preparations.
Rat (Fischer 344) liver microsomes for covalent binding studies were prepared by standard differential centrifugation techniques as described previously (Ernster et al., 1962). Briefly, after tissue homogenization and sequential isolation of 600 and 12,500 g of supernatants, the 100,000-g pellet was isolated and resuspended in 0.15 M KCl at 5 to 20 mg of protein/ml. Some animals were pretreated with 3-MC (20 mg/kg i.p. in olive oil) for 3 days before sacrifice. Human liver microsomes were provided by Jerry M. Collins (U. S. Food and Drug Administration Center for Drug Evaluation and Research). Human liver samples for those microsomes, medically unsuitable for liver transplantation, were acquired under the auspices of the Washington Regional Transplant Consortium (Washington, DC). A description of the preparation and characterization of those liver microsomes has been published (Harris et al., 1994). Microsomal suspensions from the baculovirus-infected cell line BTI-TN-5B1-4 or from the B-lymphoblastoid cell line AHH-1TK+/− expressing cDNA constructs for rat or for human P450 isoforms were obtained from BD Gentest (Woburn, MA).
Microsomal Incubations.
Incubations (100-μl) for AF metabolism with rat and human cDNA-expressed microsomes contained 5 pmol of the P450 isoform, 5 mM MgCl2, 1 mM NADPH, and 100 mM potassium phosphate or 50 mM Tris buffer, pH 7.4. AF (10 μM final concentration, 2 mM stock solution prepared in DMSO) was added to initiate the reaction. Control reactions contained microsomes from untreated cells or cells with empty vector. Covalent binding reactions (2-ml) prepared with rat and human liver microsomes contained 1 mg/ml microsomal protein, 5 mM MgCl2, 1 mM NADPH, and 100 mM potassium phosphate buffer, pH 7.4. Incubations were prepared on ice and prewarmed at 37° for 2 min. AF [10 μM final concentration: 3 μM labeled drug (23 mCi/mol; 0.136 μCi) and 7 μM unlabeled drug in DMSO] was added to initiate the reaction. Covalent binding incubations prepared with cDNA-expressed P450 isoforms contained 25 pmol of P450 isoform protein/ml of the same incubation medium described above. Microsomes prepared from vector-only cDNA microsomes were added to achieve a final protein concentration of 1 mg/ml. Acetone (6 ml) was added to terminate covalent binding reactions. Protein was isolated by centrifugation (2000g for 10 min). Pellets were resuspended in 4 ml of methanol and agitated with a probe sonicator for six to eight 2-s pulses. Protein was reisolated by centrifugation (2000g for 10 min). The methanol wash was repeated eight times. The protein pellet was then resuspended in 1 ml of 1 N NaOH and heated (60° for 60–120 min) to dissolve protein. Undissolved material was removed by centrifugation (2000gfor 10 min), and the supernatant was neutralized with 4 N HCl. After radioactivity was determined by liquid scintillation counting and protein concentration in the solubilized fraction determined by the Lowry protein assay, covalent binding was expressed as picomole(s) of drug equivalents per milligram of protein.
Human Tumor Cell Line Cultures.
Caki-1 and HT-29 were obtained from American Cell Type Culture Collection (Manassas, VA), and human tumor cell lines MCF7, MDA-MB-435, OVCAR5, and M14-MEL were obtained from the National Cancer Institute. All cell lines were maintained in RPMI 1640 culture medium containing 5% fetal bovine serum in an incubator with a 5% CO2 atmosphere with 100% humidity.
MTT Assay.
Cells were harvested during exponential growth and plated at 2000 cells/well in 96-well plates (except for Caki-1 and MDA-MB-435 cells, 4000 cells/well) in RPMI 1640 medium without phenol red containing 10% FCS. After a 24- to 48-h incubation, 100 μl of drug-containing or control culture medium was added to each well for a total volume of 200 μl. AF (in DMSO) was added to final concentrations of 0.001 to 50.0 μM in the appropriate wells. The final concentration of DMSO was 0.25%. Growth inhibition was determined by the MTT assay, employed as described by Alley et al. (1988), with minor modifications. After the 72-h incubation, MTT was added (50 μl/well of a 2 mg/ml stock solution in phosphate-buffered saline). After 4 h, the medium was removed, and 150 μl of DMSO was added to dissolve tetrazolium crystals. Plates were read in a microtiter plate reader at 570 nm. Percentage survival was calculated relative to wells containing cells treated only with DMSO. For each MTT study, three dose-% survival experiments were conducted over the appropriate range of AF concentrations. The mean percentage survival values for each AF concentration were fit to the best sigmoidal dose-response curve using nonlinear regression curve fitting. From these curves, IC50 values were estimated using Prism ver. 3 software (GraphPad Software, San Diego, CA).
AF Covalent Binding in Human Tumor Cell Lines.
For covalent binding to cellular macromolecules, cells were plated at 1 to 2 × 10⁶ cells/100-mm Petri dish in 10 ml of RPMI 1640 medium or Dulbecco's modified Eagle's medium containing 5 or 10% FCS, respectively. After 24 h, the medium was removed and replaced with 10 ml of medium containing radiolabeled AF [10 μM final concentration: 3 μM labeled drug (23 mCi/mmol), 0.682 μCi/dish and 7 μM unlabeled drug in DMSO]. Some cells were coincubated with 1 to 100 μM final concentration of αNF using DMSO stock solutions. After an additional 24 h, the medium was removed, and cells were lifted from plates by scraping in phosphate-buffered saline. After centrifugation (2000g for 10 min), cell pellets were suspended in 1 ml of H2O, incubated on ice for 10 to 30 min, and sonicated (10 × 2-s pulses). Acetone (6 ml) was added to precipitate macromolecules for 60 min on ice. Protein and nucleic acids were pelleted by centrifugation (2000g for 10 min) and subjected to the methanol wash/protein isolation cycle described above for six cycles. The final pellet was dissolved in 250 μl of 1 N NaOH, and protein was determined with the Lowry assay. For binding to cellular DNA, cells were plated at 1 to 2 × 10⁶ cells/100-mm plate in 10 ml of RPMI 1640 medium with 5% FCS. After 48 h, cells were treated with14C-labeled AF (50 and 100 nM; 23 mCi/mmol) and harvested at 6-, 12-, and 24-h exposure time. The cells were lifted off the plates using 0.05% trypsin-EDTA. DNA was extracted from the cells and purified with the DNeasy Tissue Kit (QIAGEN, Valencia, CA). DNA was eluted with the DNeasy Tissue Kit buffer. The concentration of DNA in the eluate was determined based on the absorbance at 260 nm. The purity of the DNA samples was verified with theA 260/A 280ratio of the eluate, which is between 1.8 and 2.0 for pure DNA. The eluate (1 ml) was directly used to determine the amount of bound radiolabel by liquid scintillation counting.
Immunoblotting of P450 Isoforms, p53, Phosphorylated p53, and p21.
For examination of P450 isoform expression, tumor cell microsomes were isolated as described above. For examination of p53, phosphorylated p53, and p21, whole cell lysates were prepared. In experiments for detection of p53 phosphorylation,N-acetyl-Leu-Leu-Nle-al was added at a final concentration of 50 μM during AF incubation to insure the presence of equal amounts of p53 as described by Tibbetts et al. (1999). For p53, phosphorylated p53, and p21 detection, cells were taken up in lysis buffer containing 50 mM HEPES, 1% Triton X-100, 10 mM NaF, 30 mM sodium pyrophosphate, 150 mM NaCl, 1 mM EDTA, pH 7.6, 23 μM leupeptin, 0.77 μM aprotinin, 15 μM pepstatin, 979 μM sodium vanadate, 102 mM γ glycerol phosphate, and 0.02 μM microcystin. After centrifugation, cell lysate protein content was estimated with the Bio-Rad DC protein assay (Bio-Rad, Hercules, CA). Solubilized protein was diluted 1:1 in 2× SDS sample buffer and boiled for 5 min. Samples containing 10 μg of protein (p53, phosphorylated p53, and p21) or 50 μg of protein (P450) were subjected to electrophoresis for 60 to 90 min at 120 V on SDS-polyacrylamide minigels containing 4 to 15% (w/v) acrylamide. Separated proteins were electrophoretically transferred to polyvinylidene fluoride membranes for 60 min at 4°C. Membranes were then incubated in TBST buffer [20 mM Tris, pH 7.6, 137 mM NaCl, and 0.1% Tween 20] containing 7.5% powdered nonfat milk overnight at 4°C to block unoccupied protein binding sites. Blots were removed from the cold and incubated for 1 h at room temperature with the primary antibody [polyclonal goat anti-human CYP1A1/1A2 (BD Gentest) at 1:5000, polyclonal rabbit anti-human serine 15 phosphorylated p53 Ab-3 (Oncogene Science, Cambridge, MA) at 1:1500, monoclonal mouse anti-human p53 (Oncogene Sciences) at 1:1000, and monoclonal mouse anti-human p21 Ab3 (NeoMarkers, Fremont, CA) at 1:500, with all dilutions in 7.5% powdered nonfat milk]. Blots were then washed with TBST (2 × 15 and 3 × 10 min), incubated for 1 h with the horseradish peroxidase-conjugated secondary antibody [rabbit anti-goat IgG (1:100,000 dilution; Chemicon International, Temecula, CA), goat anti-mouse IgG (1:8000 dilution; Chemicon International), or goat anti-rabbit IgG (1:8000 dilution; Kirkegaard and Perry Laboratories, Gaithersburg, MD)] in 3% milk, followed by washing with TBST (2 × 15 and 3 × 10 min). Blots were incubated for 5 min in Pierce Chemical West Femto chemiluminescence substrate detection solution (P450 and phosphorylated p53; Pierce Chemical, Rockford, IL) or in Pierce SuperSignal West Pico chemiluminescence substrate detection solution (p53 and p21) and then exposed to enhanced chemiluminescence film for 10 s to 5 min.
Real-Time Quantitative RT-PCR.
To determine CYP1A1 mRNA induction, MCF7 and M14-MEL cells were plated in 100-mm tissue culture plates then exposed for 6 h to medium containing DMSO, 3-MC (1 μM), or AF (50 and 100 nM). Total cellular RNA was extracted with a QIAGEN RNeasy Mini Kit RNA isolation kit then incubated with RQ1 RNase-free DNase (Promega, Madison, WI) and run through a final cleanup with the RNeasy Mini Kit. RNA concentration was determined by absorbance at 260 nm, and purity was determined by theA 260/A 280ratio. RNA was diluted to 10 ng/μl with nuclease-free water and stored at −70°C until used in experiments.
From the human CYP1A1 sequence (GenBank accession no. X04300), the following forward and reverse primers and the flurogenic TacMan probe (IDT, Inc., Coralville, IA) were designed using Primer Express software (Applied Biosystems) to amplify a 69-base pair fragment: forward, 5′ TGG TCA AGG AGC ACT ACA AAA CC 3′; reverse, 5′ GCT CAA TCA GGC TGT CTG TGA T 3′; probe: 5′ TCC CGG ATG TGG CCC TTC TCA A 3′.
Real-time RT-PCR reactions were conducted in a one-step procedure using an ABI Prism 7700 Sequence Detection System (Applied Biosystems). Each experimental sample was run in triplicate in a 96-well plate format. Each reaction (25 μl total volume) contained 50 ng of RNA, 200 nM primers and probe for CYP1A1, 0.15 U/μl SuperScript II (Invitrogen), and 0.1 U/μl Rnase OUT (Invitrogen) in 1× TaqMan Universal Master Mix (Applied Biosystems). In the same reaction wells, 18S rRNA Control mix (Applied Biosystems) was added as an endogenous control reference. No template (without RNA) and no amplification (without SuperScript II) control reactions were run on each 96-well plate. FAM (Applied Biosystems) was the reporter dye used for the CYP1A1 probe and VIC (Applied Biosystems) was the reporter dye used for the 18S probe. Both probes used the TAMRA fluor as the quencher dye (Applied Biosystems). Reaction conditions in the ABI Prism 7700 were as follows: 2 min at 50°C, 30 min at 60°C, and 12 min at 95°C, followed by 40 cycles of 15 s at 95°C and 1 min at 60°C.
Averaged C t values were calculated for each sample. The comparative C t method as described in User Bulletin #2 from Applied Biosystems was used to calculated the relative quantity of CYP1A1 target gene expression relative to the 18S endogenous control reference gene. These quantities were then used to calculate the fold induction of CYP1A1 by AF or 3-MC treatment relative to vehicle treatment only. Initial validation experiments showed that amplification efficiencies of CYP1A1 and 18S were approximately equal and eliminated the necessity of running a standard curve on each plate (data not shown).
Results
P450 Metabolism of AF.
To extend preliminary studies demonstrating AF metabolism by P450 isoforms in human and rat hepatic microsomal preparations (Kuffel et al., 1999), we examined the ability of recombinant human and rat microsomes to catalyze AF metabolism. As illustrated in Fig. 2A, recombinant human CYP1A1, and to a lesser extent CYP1A2, metabolized AF as assessed by disappearance of parent drug. Other isoforms (including CYP1B1) contributed much less to AF metabolism. Similar results were obtained with recombinant rat P450 isoforms (Fig. 2B). Consistent with CYP1A1 and CYP1A2 metabolism of AF, coincubation of two human hepatic microsomal preparations with a human anti-CYP1A1/1A2 antibody greatly reduced disappearance of AF (Fig. 2C). Additional studies with microsomal preparations revealed that pretreatment of rats with the CYP1A isoform inducer 3-MC increased CYP1A1 activity and protein, and the rate of NADPH-dependent AF metabolism, by greater than 50%, whereas coincubation with the CYP1A inhibitors αNF, furafylline, and phenethyl isothiocyanate inhibited AF metabolism by rat and human microsomal preparations (data not shown).

AF (10 μM) metabolism by NADPH-fortified cDNA-expressed human (A) and rat (B) P450 isoform microsomal preparations (5 pmol/100 μl reaction, 30 min incubation). Data are the mean of two experiments. C, AF (10 μM) metabolism by two human liver microsomal preparations pre-exposed to preimmune and/or antiserum for human CYP1A1/1A2 (polyclonal rabbit) as per protocol by Gentest. AF metabolism by human liver microsomes (HLM) (100 μg/100 μl, 30-min incubation) in all experiments was determined by disappearance of parent drug as measured by HPLC.
A number of metabolites were detected by HPLC when AF was incubated with human (Fig. 3) and rat (data not shown) hepatic microsomal preparations. Analyses of the same preparations by online HPLC/MS revealed the presence of parent AF, affording a protonated molecular ion at MH+ = 321, as well as several additional protonated ion species corresponding to phase I metabolites (Kuffel et al., 2000). Of particular interest was metabolite B, with retention time ∼11 min (Fig. 3) and with MH+ = 337. Parent AF and metabolites were subjected to HPLC/MS/MS. The HPLC/MS/MS analyses of AF afforded a product ion spectrum containing two prominent fragment ions atm/z 136 and 186 (Fig. 4A). These two ions correspond to the facile fragmentation of the AF ring structure as shown. The HPLC/MS/MS spectra of most metabolites were reflective of either oxidations at carbon and/or oxidative dehalogenation (Kuffel et al., 2000). It was possible to determine regiochemical oxidations based on the change of either m/z136 and/or 186 fragment ions of AF, as illustrated for the parent drug in Fig. 4A. However, in the case of metabolite B with MH+ = 337, a very different product ion spectrum was observed (Fig. 4B). No precursor ion (MH+) was observed, and the base product ion was detected at m/z320, representing a facile loss of 17 amu. Finally, a significantly reduced intensity ion at m/z 186 was detected, but no evidence of an ion at m/z 136 was observed. These data are consistent with hydroxylamine metabolite B, shown in Fig. 4B, along with the appropriate fragmentation processes that occurred in the MS/MS experiment. The facile loss of 17 amu from the MH+ is highly indicative of the presence of the hydroxylamine, as reported previously (Saito et al., 1985; Ogunbiyi et al., 1995; Zalko et al., 1997), and was not seen with carbon-oxidation metabolites or standards (data not shown; Kuffel et al., 2000).

HPLC chromatogram of AF and metabolites (A-G) after 30-min incubation of AF (10 μM), NADPH, and human liver microsomes. The proposed hydroxylamine metabolite B is highlighted by ★. Other metabolites were identified by HPLC/MS/MS analyses as alcohols, phenols, and oxidative defluorination products of P450 metabolism (Kuffel et al., 2000).
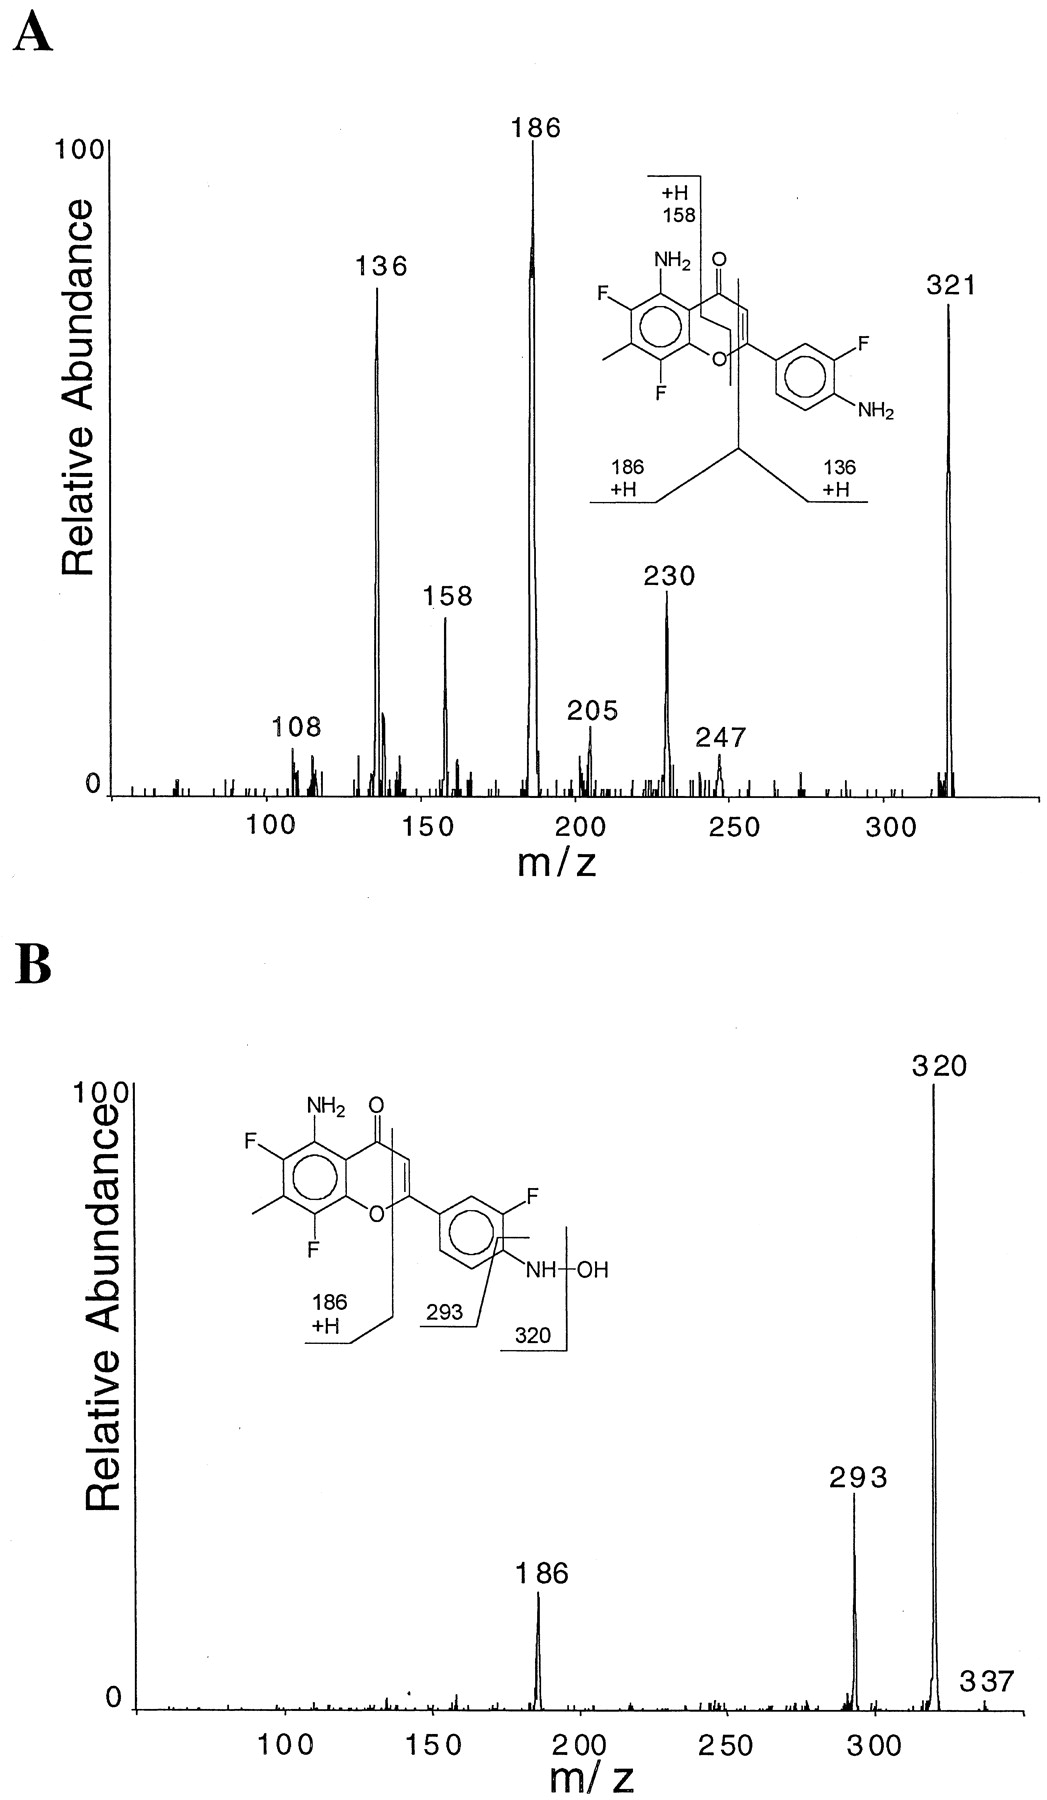
A, online reversed-phase HPLC-MS/MS analysis of parent AF. Positive ion electrospray ionization-MS was used to generate the precursor ion MH+ = 321, which was then subjected to collision-induced dissociation (CID) to produce the fragment ions shown in this product ion spectrum. AF structure and resulting CID fragmentation resulting in the product ions observed are shown in the insert. B, online reversed phase LC-MS/MS of the hydroxylamine metabolite with MH+ = 337 subjected to CID under identical conditions as in A. Although not readily apparent in the normalized spectrum B, the ratio of m/z 158/186 in the spectrum of the metabolite is identical to the ratio in the parent drug spectrum. The structure of the N-hydroxylamine metabolite and fragmentation processes responsible for producing the product ions detected are shown in the inserts.
Metabolic Activation of AF by Hepatic Microsomal Preparations.
Based on the extent of AF metabolism and the formation of the potentially reactive aromatic hydroxylamine metabolite B, we used rat microsomal preparations and radiolabeled AF as a model system to assess metabolic activation as measured by irreversible, covalent binding of radioactivity to macromolecules. Covalent binding was detected with rat liver microsomes but only in the presence of NADPH (Fig.5A). The extent of covalent binding increased 2- to 3-fold when microsomes were prepared from 3-MC–pretreated rats (Fig. 5A). NADPH-dependent covalent binding was likewise detected with two human hepatic microsomal preparations (Fig.5B). When covalent binding studies were repeated using preparations of cDNA-expressed human P450 isoforms, only CYP1A1, and to a lesser extent CYP1A2, human (Fig. 5C) isoforms yielded substantial covalent binding to macromolecules.

Covalent binding of radiolabel to macromolecules after incubation of radiolabeled AF (10 μM) with rat liver microsomal preparations (2 mg of protein/2 ml incubation) (A), with human liver microsomal preparations (2 mg of protein/2 ml incubation) (B), and with cDNA-expressed human P450 isoform microsomal preparations (50 pmol of P450 with 2 mg of total protein/2 ml incubation, 120-min incubation) (C). CYP2A6 was a negative control, as it did not metabolize AF (Fig.2). C represents control preparations from cells transfected with vector (V) only. Macromolecules were isolated by acetone precipitation followed by solvent washing (see Materials and Methods). Macromolecules were isolated by acetone precipitation followed by solvent washing (see Materials and Methods). Data in A are means of three experiments (bars, S.D.). Data in B and C are means of two experiments.
Incubation of AF with Human Tumor Cell Lines: Covalent Binding and Growth Inhibition.
To determine whether the metabolic activation of AF observed with microsomal preparations might also occur in human tumor cells, radiolabeled AF was incubated with six human tumor cell lines employed in the NCI screen for AF growth inhibition. In preliminary covalent binding studies, 1 to 10 μM concentrations of AF were employed, and substantial covalent binding was observed in MCF7 cells (data not shown). However, for all additional studies, 50 nM radiolabeled AF was used, based on IC50concentrations reported for relatively sensitive cell lines in the NCI screening assay (http://www.dtp.nci.nih.gov). Covalent binding to cellular macromolecules was greatest with MCF7, Caki-1, and OVCAR5 cells, with much less binding to macromolecules of other cell lines (Table 1).
Inhibition of cell growth (IC50) and covalent binding after incubation of AF with human tumor cells
To evaluate the relationship between covalent binding and the antiproliferative effects of AF, the same cell lines were incubated with AF for 72 h, and surviving cell mass was assessed with the MTT assay. Representative experiments for a relatively sensitive MCF7 cell line and the relatively resistant M14-MEL cell line are illustrated in Fig. 6. IC50 data for all cell lines are presented in Table 1. These data suggest that a threshold level of covalent binding may be required to elicit a substantial decrease in viable cell mass as measured by the MTT assay.

Growth inhibition as measured by the MTT assay after incubation of AF with MCF7 (▪) and M14-MEL (●) cells for 72 h. Data are the mean of three experiments (bars, S.D.).
Covalent Binding to DNA and a DNA-Damage Response.
Additional studies were conducted with MCF7 cells to characterize the role of cellular CYP1A1/1A2 metabolism in AF activation and covalent binding to macromolecules. These cells were chosen because of their sensitivity to AF (Fig. 6 and Table 1). In addition, these cells lack caspase-3, which results in their inability to activate the caspase-activated nuclease CAD and generate DNA ladders during apoptosis (Janicke et al., 1998), thereby providing some assurance that any DNA-damage response observed reflects primary damage to DNA rather than apoptotic changes.
When MCF7 cells were pretreated for 24 h with the CYP1A inducer 3-MC, covalent binding was increased (Fig.7A). Conversely, covalent binding was decreased when cells were simultaneously exposed to radiolabeled AF and the CYP1A1/1A2 inhibitor αNF. Furthermore, when radiolabeled AF was incubated with MCF7 cells and with relatively resistant M14-MEL cells (Fig. 6 and Table 1), covalent binding of radiolabel to isolated cellular DNA was much greater for MCF7 cells (Fig. 7B), similar to results with total cellular macromolecule binding in those two cell lines (Table 1). The DNA binding in MCF7 cells was accompanied by increased concentrations (Fig. 8A) and phosphorylation (Fig. 8B) of p53 as well as increased expression of its downstream transcriptional target p21 (Fig. 8C). The phosphorylation and accumulation of p53 was readily evident in <9 h (i.e., long before the cells began to show overt signs of toxicity) (J. C. Schroeder and M. M. Ames, unpublished observations). Collectively, these results suggest that the covalent binding of AF metabolite(s) to DNA results in a typical DNA-damage response.
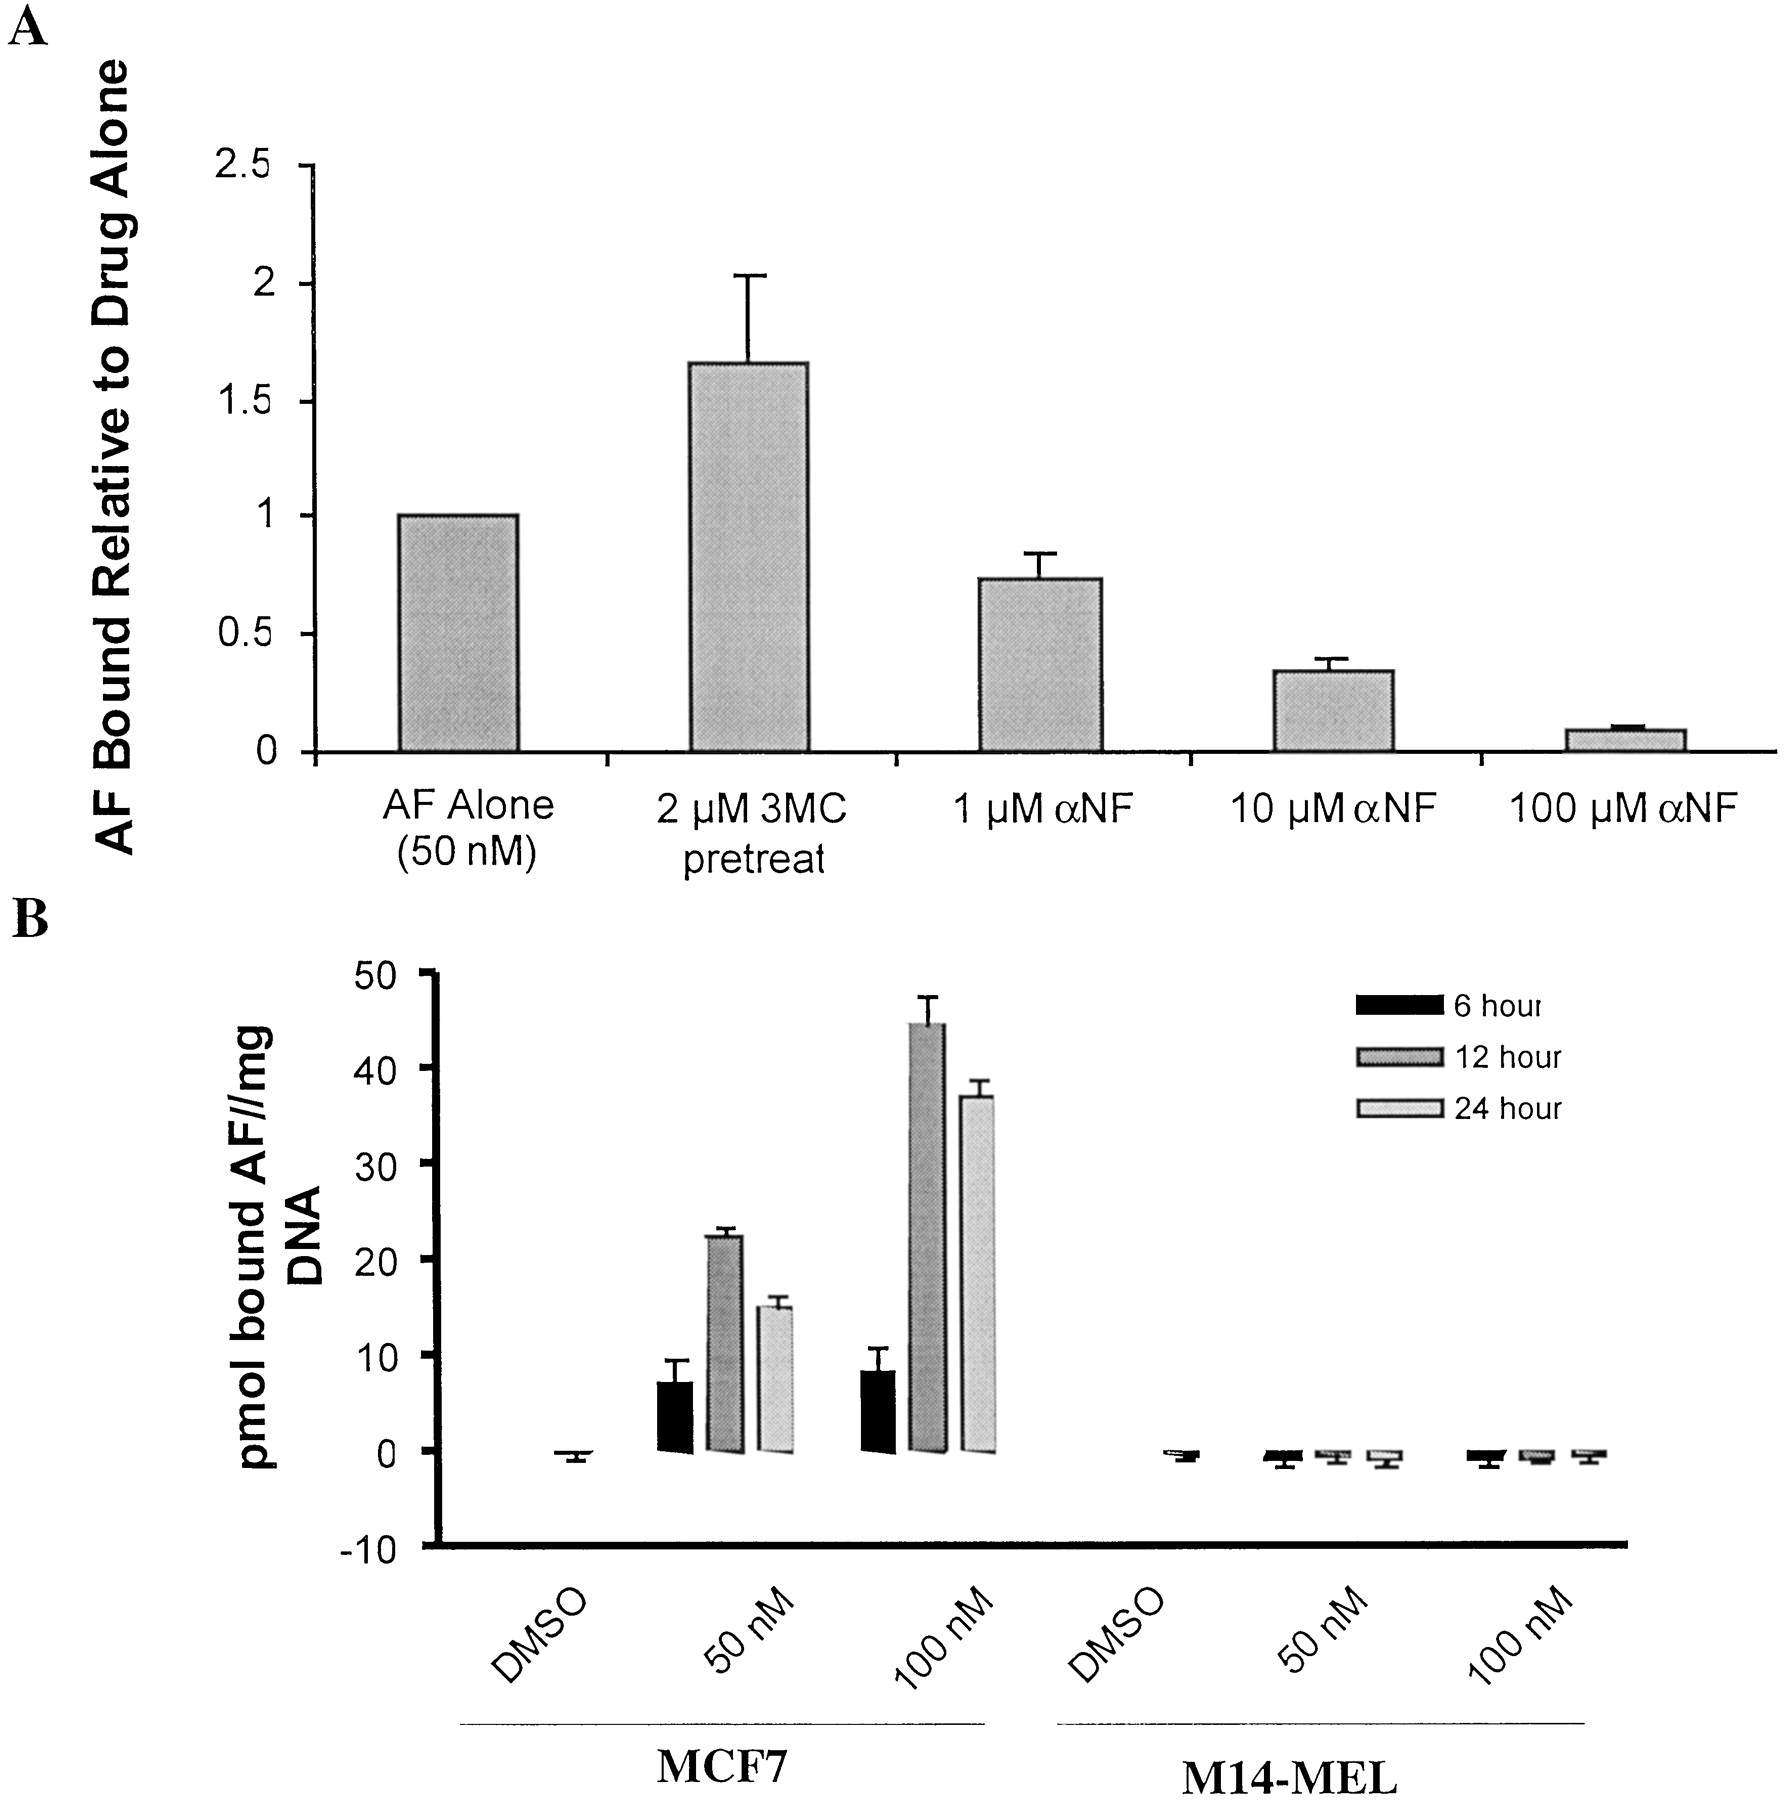
A, effect of CYP1A inducer 3-MC and CYP1A inhibitor αNF on covalent binding of radiolabeled AF (50 nM) to cellular macromolecules after 24 h incubation with MCF7 cells. Cells were either preincubated with 3-MC for 24 h or simultaneously incubated with αNF. Macromolecules were isolated by acetone precipitation followed by solvent washing (see Materials and Methods). B, covalent binding of radiolabel to cellular DNA after incubation of radiolabeled AF (50 and 100 nM) with MCF7 and M14-MEL cells. DNA was extracted from cells and purified with the DNeasy Tissue Kit (QIAGEN) as described under Materials and Methods. Values are means of three experiments (bars, S.D.).

A, stabilization of p53 after exposure of MCF7 cells to AF (50 nM). B, phosphorylation of p53 in MCF7 cells after exposure to increasing concentrations of AF for 9 h (top lane). p53 concentrations were stabilized by addition of the proteosome inhibitorN-acetyl-Leu-Leu-Nle-al (bottom lane). C, induction of p21 expression after exposure of MCF7 cells to AF (50 nM). Irradiated cells were treated with 20 Gy and harvested for immunoblotting 12 h later. Total protein was extracted and analyzed by Western blotting with antibodies described under Materials and Methods.
Induction of CYP1A1/1A2 in Sensitive Cells.
The observations depicted in Figs. 7 and 8 suggested that AF was metabolized to a DNA-damaging agent by CYP1A1/1A2 in MCF7 cells. Preliminary experiments, however, indicated that MCF7 cells do not constitutively express detectable amounts of CYP1A1 and CYP1A2 (Fig.9A, lane 1). To determine whether AF induced expression of CYP1A1 and/or CYP1A2, MCF7 cells were exposed to 50 or 100 nM AF for 6 h and subjected to immunoblotting using a human CYP1A1/1A2 antibody. We evaluated several CYP1A1-specific antibodies (data not shown) but found all to be somewhat cross-reactive with CYP1A2, and thus we used a CYP1A1/1A2 antibody for these studies. 3-MC served as a positive control for induction of these isoforms. In contrast to untreated cells, cells treated with AF or 3-MC expressed readily detectable amounts of CYP1A1/1A2 protein (Fig. 9A). When this same series of experiments was conducted with the relatively insensitive M14-MEL cell line, no induction of CYP1A1/1A2 was observed (Fig. 9A). The increased protein expression observed after AF exposure to MCF7 cells reflected a substantial AF-induced increase in CYP1A1 mRNA, whereas there was very little increase in mRNA observed in AF-treated M14-MEL cells (Fig. 9B).

A, induction of CYP1A1/1A2 protein after incubation of 3-MC or AF (6 h) with MCF7 or M14-MEL cells. Control cells were harvested at the same times but with no drug exposure. Total protein was extracted and analyzed by Western blotting with the polyclonal goat anti-human CYP1A1/1A2 antibody as described under Materials and Methods. The positive control (lane 5) was 0.1 pmol of recombinant human CYP1A1. B, induction of CYP1A1 message as determined by real-time quantitative RT-PCR after incubation of 3-MC or AF (6 h) with MCF7 or M14-MEL cells. Total RNA was extracted, and PCR was carried out as described under Materials and Methods. Values are mean of three experiments (bars, S.D.).
Discussion
AF is an investigational cancer chemotherapeutic agent with a pattern of activity distinct from that of conventional cytotoxic drugs. Although AF is undergoing extensive preclinical testing in anticipation of clinical evaluation, the mechanism of action of AF was previously unknown. Results of the present study demonstrated that AF was metabolized by human and rat hepatic microsomes and recombinant P450 isoforms 1A1 and 1A2 to reactive species that bind covalently to macromolecules. When incubated with MCF7 human tumor cells, AF induced P450 1A1/1A2 expression and was converted to reactive metabolites that covalently bound to tumor cell macromolecules, including DNA. This covalent binding of AF metabolites to tumor cell macromolecules elicited a DNA-damage response. In studies with six human tumor cell lines, covalent binding was greatest in tumor cell lines that were most sensitive to AF. These observations provide important new insights into the action of this agent.
Extensive AF metabolism by P450 isoforms CYP1A1 and CYP1A2 (Fig. 2) included formation of the aromatic hydroxylamine (shown in Fig. 4B). Because aromatic hydroxylamines are electrophilic species that often bind irreversibly to nucleophilic moieties of small and large molecules, we examined the ability of AF metabolites to bind covalently to macromolecules under cell-free conditions and in intact cells. Substantial NADPH-dependent covalent binding was observed when radiolabeled AF was incubated with rat and human hepatic or recombinant CYP1A1 and CYP1A2 microsomal preparations (Fig. 5). Likewise, covalent binding of AF metabolites to cellular macromolecules was detected after incubation of parent drug with each of six cell lines. The extent of covalent binding for the three relatively sensitive cell lines was far greater than the covalent binding observed in the three more resistant cells. Metabolic activation of drugs can be associated with hepatotoxicity due to damage to critical cellular macromolecules when the activating reaction occurs in the liver, as is the case for acetaminophen (Mitchell et al., 1973). However, hepatotoxicity was not observed in preclinical toxicology studies using doses of AF associated with antitumor activity in mice (Alley et al., 1999). It may be that additional metabolic pathways in the liver prevent accumulation of potentially toxic species (if formed), as is the case for cyclophosphamide (Friedman et al., 1979). We have detected glucuronide metabolites of AF in mice (M. M. Ames, unpublished observations), suggesting that alternate metabolic pathways and/or glucuronidation of oxidative metabolites can occur before reactive species can damage hepatocytes.
Although metabolic activation of AF by CYP1A1 and CYP1A2 in hepatic microsomal preparations was understandable, metabolic activation in human tumor cell lines was somewhat unanticipated. P450 isoforms have been detected in tumor cell lines, including those in the NCI screen (Yu et al., 2001). However, enzyme activity levels were quite low, particularly for CYP1A1, as was the case in our studies (Fig. 9A, lane 1). Although molecules such as 3-MC and dioxin induce CYP1A1 and CYP1A2 expression in MCF7 and other cell lines (Fig. 9A; Li et al., 1998), anticancer drugs have not historically been reported to induce P450 isoforms in tumor cells. Nonetheless, our observations indicate that AF is capable of inducing CYP1A1/1A2 expression in sensitive MCF7 cells almost as effectively as 3-MC (Fig. 9). We did not observe induction in the more resistant M14-MEL cell line as measured by CYP1A1/1A2 protein or CYP1A1 mRNA (Fig. 9). Moreover, the ability of the CYP1A1/1A2 inducer 3-MC to enhance covalent binding of AF metabolites to macromolecules in MCF7 cells and the ability of the CYP1A1 inhibitor αNF to diminish this covalent binding in intact cells (Fig. 7) strongly suggests that the induced P450 isoforms are involved in the metabolism of AF to products that covalently bind macromolecules. In short, our data are consistent with a unique mechanism (Fig.10) in which AF induces, within certain tumor cell lines, the synthesis of the P450 isoforms that metabolically activate this compound to a highly reactive cytotoxic species leading to DNA damage. The DNA damage results in a p53-mediated DNA-damage response and cell death as observed for many antitumor agents.

Proposed sequence of events in the action of AF in sensitive human tumor cell lines. AF induces CYP1A1/1A2 expression within 6 h of addition to sensitive cell lines. AF is metabolized in a CYP1A1/1A2-dependent reaction to form reactive intermediates that bind covalently to tumor cell macromolecules, including DNA. p53 phosphorylation and stabilization are detectable 9 h after AF addition to tumor cell incubations. Note that the formation of AF-DNA adducts and cell death is attenuated in cell lines in which CYP1A1/1A2 induction fails to occur.
Our observations with AF prompted a search for other agents acting in a similar manner. A review of COMPARE data revealed that the activity profile for AF was similar to that of a structurally unrelated, tricyclic thiophene analog, NSC 672287 (r = 0.722) (http://www.dtp.nci.nih.gov). This thiophene was also metabolized by human tumor cell lines to species that covalently bind to cellular macromolecules (Rivera et al., 1999). Neither the reactive metabolite(s) nor the enzymes responsible for thiophene metabolism were identified, although subcellular fractionation studies indicated that most thiophene metabolism occurred in non-P450-containing soluble fractions. After we reported metabolic activation of AF by microsomal preparations and by MCF7 cells in abstract form (Kuffel et al., 2000), similar findings on an unrelated benzothiazole analog, NSC 674495, appeared in the literature (Chua et al., 2000). In addition to covalent binding to macromolecules in sensitive MCF7 cells, exposure of those cells to the benzothiazole induced P450 1A1 expression (Chua et al., 2000). Interestingly, AF sensitivity in the NCI screen was not well correlated with benzothiazole sensitivity (r = 0.520) (J. Covey, NCI, personal communication; http://www.dtp.nci.nih.gov).
Our detailed data with AF, as well as findings with the thiophene analog (Rivera et al., 1999) and the benzothiazole analog (Chua et al., 2000), raise the intriguing possibility that P450 isoforms and possibly other metabolic enzymes present in tumor cells can metabolize certain drugs to reactive species capable of binding to and damaging tumor cell DNA and other macromolecules. P450 isoforms, including CYP1A1 and CYP1A2, are variably expressed in primary human tumors, including breast cancer (Iscan et al., 1998), renal cell carcinoma (Cheung et al., 1999), and hepatoma (Philip et al., 1994). Enzyme activities in primary lesions may or may not be adequate for metabolism of drugs, such as AF, to cytotoxic concentrations of reactive intermediates. However, induction of CYP1A1/1A2 in tumor cells, as demonstrated with AF (Fig. 9), clearly provides enzyme activities necessary to produce cytotoxic concentrations of reactive intermediates in sensitive lines. The bioreductive agent mitomycin C induces expression of DT-diaphorase [EC 1.6.99.2; NAD(P)H dehydrogenase (quinone)] (one of the enzymes that can activate this agent to DNA-damaging species) in some tumor cell lines (Yao and O'Dwyer 1995). DT-diaphorase induction can be mediated via agents that interact with the aryl hydrocarbon receptor (Williams et al., 1984). Furthermore, sensitivity to mitomycin C in the NCI tumor screen was related to DT-diaphorase enzyme activity (Fitzsimmons et al., 1996). Although these observations provide a precedent in which an anticancer drug can induce its own metabolic activation in some cancer cell lines, our observations provide the first example of CYP1A1/1A2 mRNA induction by an anticancer drug that is metabolically activated by the same isoforms.
Further studies are required to determine whether the mechanism we have defined for AF cytotoxicity is operative within primary tumor cells in vivo and to define mechanism(s) that determine the variable response observed in cell lines (Fig. 9) and presumably in primary tumors. For example, tumor cell expression of cytochrome P450 reductase (required for P450 activity) and/or elements of the CYP1A1 induction pathway could be critical in determining sensitivity to AF. In addition, hydroxylamines are known to be further metabolized via acetylation and/or sulfation to even more reactive species (Guengerich 2000). These and other factors are currently under evaluation in our laboratory. If this proposed mechanism is operative in primary tumors, AF and other agents may offer a new strategy for the treatment of lesions with the capability of P450 induction. Drugs active through these pathways would be distinct from those of drugs converted to reactive, DNA-damaging species via systemic chemical or hepatic enzyme pathways, as evidenced by differences between COMPARE profiles of classical alkylating agents and that of AF. Further studies are required to determine whether agents with this distinct mechanism of action offer better tumor selectivity.
Footnotes
- Received December 19, 2001.
- Accepted March 21, 2002.
-
This work was supported in part by National Institutes of Health grant CM97019.
-
M.J.K. and J.C.S. contributed equally to this work.
Abbreviations
- AF
- (5-amino-2,3-fluorophenyl)-6,8-difluoro-7-methyl-4H-1-benzopyran-4-one (NSC 686288)
- P450
- cytochrome P450
- αNF
- α-naphthoflavone
- 3-MC
- 3-methylcholanthrene
- HPLC
- high-performance liquid chromatography
- MS
- mass spectrometry
- MS/MS
- tandem mass spectrometry
- Q
- quadrupole
- MTT
- 3-(4,5-dimethyl-thiazol-2-yl)-2,5-diphenyltetrazolium bromide
- Ah
- arylhydrocarbon
- amu
- atomic mass unit(s)
- FCS
- fetal calf serum
- RT
- reverse transcription
- PCR
- polymerase chain reaction
- DMSO
- dimethyl sulfoxide
- TBST
- Tris-buffered saline-Tween 20
- The American Society for Pharmacology and Experimental Therapeutics


