


Abstract
We have developed a procedure based on bioluminescence resonance energy transfer (BRET) to monitor the activation state of the insulin receptor in vitro. Human insulin receptor cDNA was fused to eitherRenilla luciferase (Rluc) or enhanced yellow fluorescent protein (EYFP) coding sequences. Fusion insulin receptors were partially purified by wheat-germ lectin chromatography from human embryonic kidney 293 cells cotransfected with these constructs. The conformational change induced by insulin on its receptor could be detected as an energy transfer (BRET signal) between Rluc and EYFP. BRET signal parallels insulin-induced autophosphorylation of the fusion receptor. Dose-dependent effects of insulin, insulin-like growth factor 1, and epidermal growth factor on BRET signal are in agreement with known pharmacological properties of these ligands. Moreover, antibodies that activate or inhibit the autophosphorylation of the receptor have similar effects on BRET signal. This method allows for rapid analysis of the effects of agonists on insulin receptor activity and could therefore be used in a high-throughput screening test for discovery of molecules with insulin-like properties.
Insulin exerts its biological effects through a plasma membrane receptor that possesses a tyrosine kinase activity. Binding of insulin to its receptor induces autophosphorylation of the receptor on tyrosine residues and thereby stimulates its tyrosine kinase activity toward intracellular substrates (such as IRS1 and Shc) that play crucial roles in the transmission of the signal (White, 1997; Virkamaki et al., 1999). Alterations in tyrosine phosphorylation of the insulin receptor have been described in insulin resistance states such as diabetes and obesity (Combettes-Souverain and Issad, 1998). The discovery of pharmacological agents that specifically activate the tyrosine kinase activity of the insulin receptor will be of great importance for the treatment of insulin resistant patients.
Phosphorylation of tyrosines 1158, 1162, and 1163, located in the kinase domain of the insulin receptor, are known to play a critical role in the regulation of the kinase activity of the receptor (Ellis et al., 1986; White et al., 1988). The determination of the crystal structure of the tyrosine kinase domain of the human insulin receptor has provided a better understanding of the molecular mechanism involved in the stimulation of the kinase activity of the receptor. In the unphosphorylated state, the Tyr-1162 is located in the active site of the enzyme and plays an autoinhibitory role by competing with the binding of protein substrates (Hubbard et al., 1994). This tyrosine remains in the unphosphorylated form in the basal state, because other residues in the activation loop also impair ATP binding. The crystallization of the tris-phosphorylated form of the kinase domain has shown that autophosphorylation of these three tyrosines results in a dramatic change in the conformation of the activation loop (Hubbard, 1997). This conformation change permits unrestricted access to the binding sites for ATP and protein substrates. It has been postulated that conformational changes induced by ligand binding move the kinase domain of the two β-subunits of the receptor nearer to each other, thereby allowing trans-phosphorylation of tyrosine 1162 and adjacent tyrosines in the activation loop.
A procedure that allows monitoring of the conformational changes that result in the activation of the kinase of the receptor would be a valuable tool for the discovery of molecules with insulin-mimetic properties. Bioluminescence Resonance Energy Transfer (BRET) has been described recently as a methodology that allows the study of protein-protein interactions (Xu et al., 1999; Angers et al., 2000). BRET is a naturally occurring phenomenon resulting from the transfer of energy between luminescent donor and fluorescent acceptor proteins. The strict dependence of the phenomenon on the molecular proximity between energy donors and acceptors makes it a system of choice to study changes in the interaction between two proteins. To study the interaction between two partners, one of the partners is fused toRenilla luciferase (Rluc), whereas the other is fused to a yellow fluorescent protein (EYFP). The luciferase is excited by a substrate (coelenterazine). If the two partners are less than 100 Å apart, an energy transfer occurs between the luciferase and the fluorescent protein, and a signal emitted by the fluorescent protein can be detected. In this article, we demonstrate that this method can be used to monitor in vitro the activation state of the insulin receptor.
Materials and Methods
Expression Vectors.
The cDNA coding for the entire insulin receptor sequence (Ebina et al., 1985), with its stop codon replaced by a NheI restriction site, was subcloned in frame with eitherRenilla luciferase (Promega, Madison, WI) or the yellow variant of GFP (EYFP; CLONTECH, Palo Alto, CA) in pcDNA3 expression vector (Invitrogen, Groningen, The Netherlands). The presence of restriction sites necessary to form the chimera introduced linkers of six amino acids (ALALAT) between the insulin receptor and theRenilla luciferase protein sequences, and eight amino acids (ALALPVAT) between the insulin receptor and the EYFP protein sequences. Moreover, a linker originating from EYFP plasmid, located in the 3′-end of the IR-EYFP construct, added a short peptidic sequence (GLRSRAQASNSAVDGTAGPIL) located at the C terminal end of IR-EYFP fusion protein.
Cell Culture, Transfection, and Partial Purification of Insulin Receptor Fusion Proteins.
HEK 293 cells maintained in Dulbecco's modified Eagle's medium supplemented with 4.5 g/l glucose and 10% fetal bovine serum (Invitrogen, Cergy Pontoise, France) were seeded at a density of 1.2 × 10⁶ cells per 100-mm dish. Transient transfection was performed 1 day later using FuGene 6 (Roche Diagnostics, Basel, Switzerland) with either 0.3 μg of IR-Rluc cDNA and 0.3 μg of empty vector or with 0.3 μg of IR-Rluc and 0.3 μg of IR-EYFP cDNAs per 100 mm dish. BRET measurements on intact cells were performed essentially as described previously (Angers et al., 2000). Briefly, 2 days after transfection, HEK-293 cells were detached with Trypsin-EDTA (Invitrogen) and resuspended in phosphate-buffered saline. Approximately 60,000 cells per well were distributed in a 96-well microplate. Cells were incubated for 2 to 10 min in absence or presence of 100 nM insulin. Coelenterazine was added at a final concentration of 5 μM, and light-emission acquisition was started immediately as described below. In some experiments, BRET measurements were performed using adherent cells. Cells were transfected exactly as described above, but 1 day after transfection, cells were transferred into 96-well microplates (white culturPlate-96; Packard, Meriden, CT) at a density of 30,000 cells per well. BRET measurements were directly performed in these microplates on the following day exactly as described above.
In most experiments, BRET measurements were performed using partially purified fusion insulin receptors. Two days after transfection, cells were extracted in buffer containing 1% (w/v) Triton X-100, 20 mM MOPS, 2.5 mM-benzamidine, 1 mM-EDTA, 1 mM-4-(2aminoethyl) benzenesulfonyl fluoride hydrochloride, and 1 μg/ml each aprotinin, pepstatin, antipain, and leupeptin (Sigma-Aldrich, Saint-Quentin Falavier, France). Fusion receptors were partially purified by chromatography on wheat-germ lectin Sepharose as described previously (Tavaré and Denton, 1988). Partially purified fusion insulin receptors were aliquoted and stored at −80°C for subsequent use. Protein concentration in the partially purified fusion receptor preparation was measured using a Bradford assay.
BRET Assay on Partially Purified Fusion Receptors.
In vitro measurement of BRET signal was performed using 4.5 μl of wheat-germ lectin (WGL) eluate (approximately 2 μg of proteins) preincubated in 96-well microplates for 45 min at 20°C in a total volume of 60 μl containing 30 mM MOPS, 1 mM Na3VO4, and different concentrations of ligands. Coelenterazine (7 μl; final concentration, 2.6 μM; Molecular Probes, Inc., Eugene, OR) was added to the preparation and light emission acquisition at 485 nm (filter window, 20 nm) and 530 nm (filter window, 25 nm) was started immediately using the Fusion microplate analyser (Packard). The BRET ratio has been defined previously (Angers et al., 2000) as: [(emission at 530 nm) − (emission at 485 nm) × Cf] / (emission at 485 nm), where Cf corresponds to (emission at 530 nm) / (emission at 485 nm) for the Rluc fusion protein expressed alone in the same experimental conditions (i.e., in our study, IR-Rluc transfected alone in HEK-293 cells). For the sake of readability, results were expressed in milliBRET units (mBU); 1 mBU corresponds to the BRET ratio multiplied by 1000.
Autophosphorylation of Partially Purified Fusion Insulin Receptors.
Partially purified fusion insulin receptors (4.5 μl) were preincubated for 45 min at 20°C in a total volume of 60 μl containing 30 mM MOPS, 12 mM MgCl2, 2 mM MnCl2, 1 mM Na3VO4, and different concentrations of ligands. Autophosphorylation reaction was initiated by adding 5 μl of ATP (final concentration, 100 μM) for 2 min and stopped by addition of SDS-polyacrylamide gel electrophoresis sample buffer (Tavaré and Denton, 1988). Autophosphorylation of the fusion receptors was assessed by immunoblotting (Issad et al., 1995) using 4G10 antiphosphotyrosine antibody (UBI, Lake Placid, NY).
Autophosphorylation of Fusion Insulin Receptors in Intact Cells.
Forty-eight hours after transfection, HEK-293 cells were incubated for 5 min in the absence or presence of insulin and extracted as described previously (Tavaré et al., 1988). Soluble extracts were incubated for 2 h at 4°C with 50 μl of WGL-Sepharose and partially purified proteins were subjected to Western blotting (Issad et al., 1995) using enhanced chemiluminescence (Amersham Pharmacia Biotech, Saclay, France).
Results and Discussion
Expression of Insulin Receptor Fused to Rluc and EYFP in HEK-293 Cells.
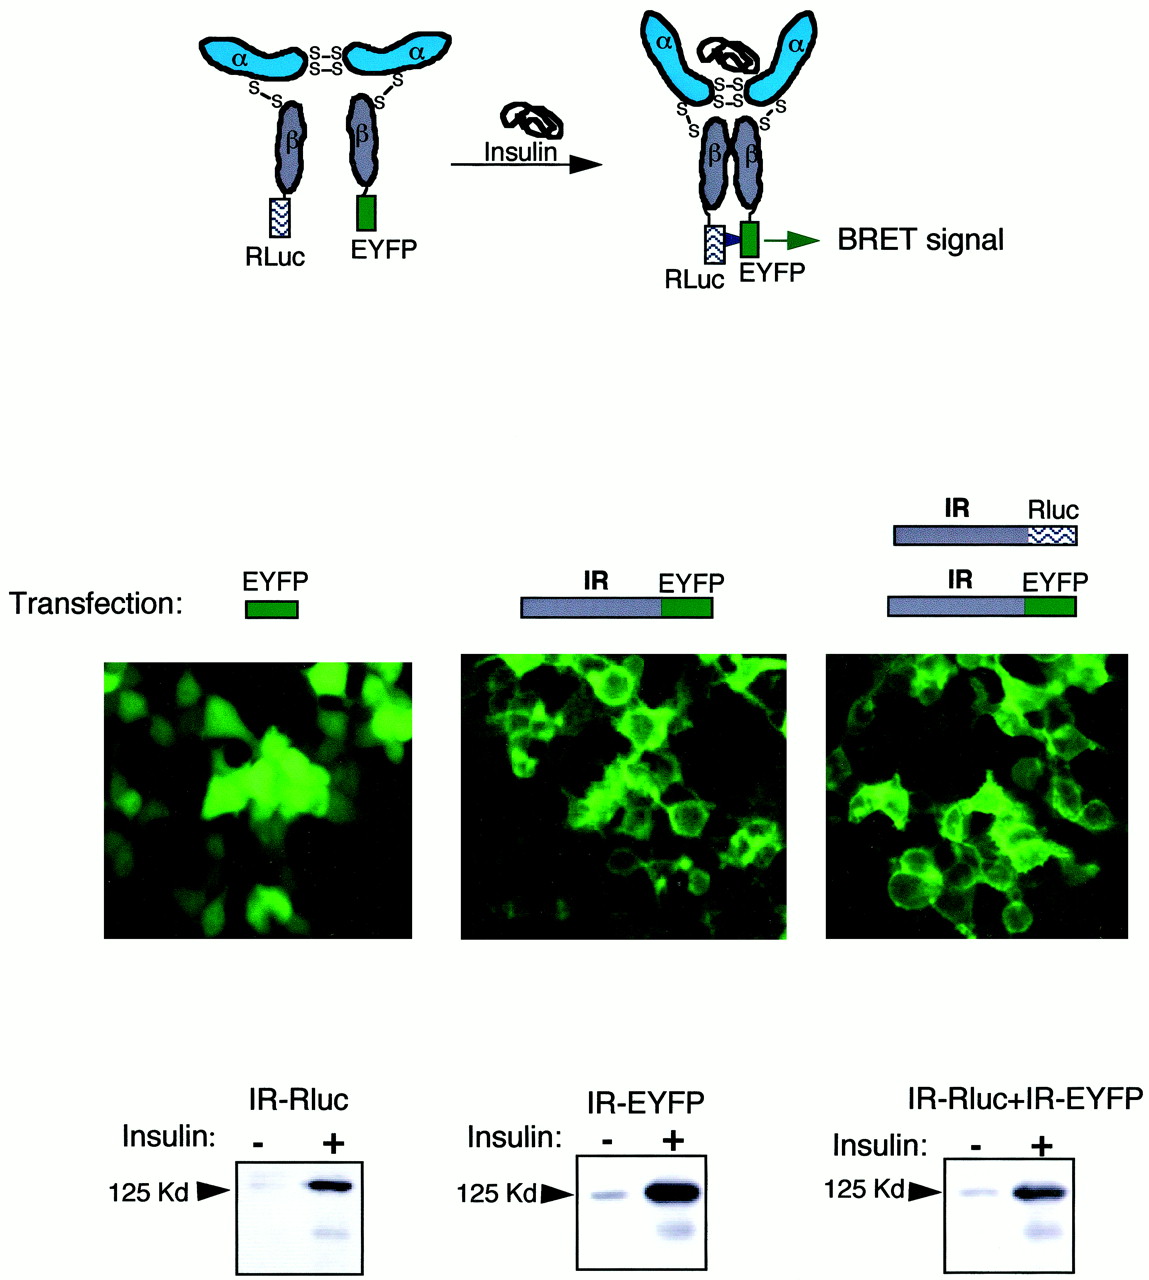
The conformational change induced by insulin on its receptor is believed to bring the two β-subunits nearer to each other, thus allowing trans-phosphorylation of one subunit by the other subunit. To detect this conformational change using the BRET method, the coding sequence of the insulin receptor was fused to either Rluc or EYFP (Fig. 1A). Fluorescent microscopy shows that HEK-293 cells transfected with the cDNA coding for IR-EYFP alone or both IR-Rluc and IR-EYFP expressed the fluorescent fusion protein at the plasma membrane (Fig. 1B).

Fusion insulin receptors are correctly processed in HEK-293 cells. Top, principle of the detection of insulin-induced conformational changes in the insulin receptor molecule using the BRET method. Fusion receptors were obtained by subcloning the entire coding sequence of the insulin receptor cDNA in frame with either Rluc or EYFP. In the presence of coelenterazine, an energy transfer between Rluc and EYFP occurs when the distance between these proteins is less than 100 Å. In the absence of insulin, a basal BRET signal resulting from random interactions between Rluc and EYFP may occur. Binding of insulin to its receptor results in a conformational change that brings together the two β-subunits, allowingtrans-phosphorylation to occur. In this conformation, the probability of having Rluc and EYFP near each other will increase, resulting in a stronger BRET signal. Center, transfection of cDNA coding for EYFP in HEK-293 cells results in a fluorescent signal uniformly distributed in the cell. Transfection of cDNA coding for IR-EYFP alone or together with cDNA coding with IR-Rluc results in the localization of the fluorescence at the plasma membrane. Bottom, HEK-293 cells transfected with cDNA coding for IR-Rluc, IR-EYFP, or both were incubated for 5 min in the presence of 100 nM insulin. Cells were extracted and fusion receptors were partially purified on WGL-Sepharose beads. Autophosphorylation on tyrosine residues was detected by immunoblotting using 4G10 anti-phosphotyrosine antibody.
In HEK-293 cells transfected with cDNA coding for IR-Rluc, IR-EYFP, or both, insulin markedly stimulates the tyrosine phosphorylation of a protein with an apparent molecular mass of approximately 125 to 130 kDa, in agreement with the expected size of the β-subunit fused to Rluc or EYFP. These results indicate that these fusion insulin receptor proteins are correctly expressed at the plasma membrane and have conserved insulin-induced autophosphorylation activity.
Insulin Stimulates Bioluminescence Resonance Energy Transfer between β-IR-Rluc and β-IR-EYFP in Vitro.
BRET measurements performed on intact HEK-293 cells cotransfected with IR-Rluc and IR-EYFP showed that insulin has only a modest effect on BRET signal (Fig. 2A). Similar results were obtained when BRET signal was directly measured on adherent HEK-293 cells (results not shown). Moreover, these results were not cell-type specific, because equivalent results where obtained when BRET measurements were performed using Chinese hamster ovary (CHOK1) or monkey kidney (COS1) cells. Finally, varying the ratio of transfected IR-Rluc cDNA to IR-EYFP cDNA (from 0.1 to 10) did not improve insulin effect on BRET signal (results not shown).

Effect of insulin on BRET signal. Top, basal and insulin stimulated BRET signals were measured either on intact cells or partially purified fusion receptors as described under Materials and Methods. Results are the mean ± S.E.M. of six experiments. Bottom, basal and insulin stimulated BRET signals were measured with increasing amounts of partially purified fusion receptors. Results are representative of two independent experiments.
Basal BRET signal measured on fusion receptors partially purified by WGL chromatography was 2- to 3-fold lower than in intact cells. A robust insulin effect on BRET signal was observed on partially purified fusion receptor. Although reasons for the differences in BRET signal measured in intact cells and partially purified receptors are unclear at the present time, these results indicate that the BRET approach can be used to monitor in vitro insulin-induced conformational changes in the insulin receptor.
Cotransfection with IR-Rluc and IR-EYFP is likely to result in the expression of three populations of fusion receptors: [αβRluc]2, [αβEYFP]2, and hybrid molecules [αβRluc]-[αβEYFP]. Therefore, a BRET signal can theoretically result from either an intramolecular energy transfer within the same [αβRluc]-[αβEYFP] molecule or from an intermolecular energy transfer between two fusion-receptor molecules (for instance between an [αβRluc]2 molecule and an [αβEYFP]2 molecule). Increasing the amount of WGL-eluate in the reaction mixture from 2 μl to 10 μl (i.e., increasing the concentration of partially purified proteins in the assay from 15 ng/μl to 75 ng/μl) did not affect BRET signal (Fig. 2B). This indicates that BRET signal measured on partially purified fusion receptors is independent of protein concentration and reflects an intramolecular energy transfer between β-RLuc and β-EYFP within the same ([αβRluc]-[αβEYFP]) molecule. Moreover, no BRET signal could be detected when WGL-eluates from cells transfected with IR-Rluc alone were mixed with WGL-eluates from cells transfected with IR-EYFP alone (results not shown). This indicates that no energy transfer occurs between [αβRluc]2and [αβEYFP]2 and further supports the notion that the observed energy transfer is an intramolecular process that reflects a conformational change within a [αβRluc]-[αβEYFP] fusion receptor.
Fig. 3A shows that insulin stimulates in vitro the autophosphorylation of the partially purified fusion receptors. The effect of insulin on the autophosphorylation (Fig. 3B) is on the same order of magnitude (2.5- to 3-fold) as the effect of insulin on BRET signal (Fig. 3C). This result indicates that the BRET signal can be considered a representative measurement of the activation state of the insulin receptor. The in vitro effect of insulin on BRET signal (Figs. 2 and 3C) was observed in the absence of ATP in the incubation medium. This indicates that this signal reflects the conformational change induced by insulin before any phosphorylation event. No further increase in BRET signal was observed upon addition of ATP (Fig. 3C). As discussed previously, partially purified receptor preparations are likely to contain [αβRluc]2, [αβEYFP]2, and hybrid [αβRluc]-[αβEYFP] molecules. We observed that [αβRluc]2 and [αβEYFP]2 fusion receptors are capable of autophosphorylation, both in intact cells (Fig. 1C) and in vitro (results not shown). However, there is no direct evidence that hybrid receptors are capable of autophosphorylation. Therefore, we cannot exclude the possibility that the fraction of receptors that is responsible for insulin-induced BRET signal ([αβRluc]-[αβEYFP] hybrid receptors) do not undergo autophosphorylation. If this is the case, autophosphorylation-induced conformational change will remain undetectable. On the other hand, it is also possible that although hybrid receptors do undergo autophosphorylation, the resulting conformational change in the kinase domain (Hubbard, 1997) does not induce further modification in the distance between Rluc and EYFP.

Effect of insulin on autophosphorylation and BRET signal on partially purified fusion receptors. Top left, autophosphorylation of partially purified fusion receptors was performed as described under Materials and Methods in the absence or presence of 100 nM insulin. Top right, quantification of the effect of insulin on the autophosphorylation of the receptor-fusion protein by densitometric analysis. Results are the mean ± S.E.M. of seven experiments. Bottom, partially purified fusion receptors were preincubated for 45 min in the absence or presence of 100 nM insulin and further incubated for 2 min in absence or presence of 100 μM ATP. BRET signal was measured as described under Materials and Methods. Results are the mean ± S.E.M. of three experiments.
Dose-Dependent Effect of Insulin, IGF1, and EGF on BRET Signal.
The effect of increasing concentrations of insulin on BRET signal is shown on Fig. 4A. Maximal insulin effects were obtained around 15 nM. The half-maximal effect of insulin (EC50) was observed at 5 nM insulin. IGF1 also dose-dependently stimulated BRET signal, with an EC50 value of about 200 nM. EGF had no effect on BRET signal. These results are in agreement with known pharmacological properties of these ligands toward the insulin receptor. Autophosphorylation of the fusion receptor in response to these ligands follows similar dose-dependent patterns, indicating that BRET signal indeed reflects the activation state of the insulin receptor (Fig. 4B).

Dose-dependent effect of insulin, IGF1 and EGF on partially purified fusion receptors. Top, partially purified fusion receptors were incubated for 45 min in the presence of increasing doses of insulin, IGF1, or EGF. BRET signal was measured as described underMaterials and Methods. Results are the mean ± S.E.M. of three to nine experiments. Bottom, autophosphorylation of partially purified fusion receptors was performed as described underMaterials and Methods in the presence of increasing doses of insulin, IGF1, or EGF.
Effect of Anti-Insulin Receptor Antibodies on BRET Signal.
83-14 is a monoclonal antibody directed against the α-subunit of the insulin receptor (Soos et al., 1986), which has insulin-like activity on human adipocyte metabolism (Taylor et al., 1987) and on insulin receptor autophosphorylation (O'Brien et al., 1987). Interestingly, this antibody also fully activated insulin receptors from an insulin-resistant patient that could not be activated by insulin because of a mutation that impairs insulin binding (Krook et al., 1996). We observed that 83-14 strongly stimulates BRET signal (Fig.5A). Previous work has shown that, unexpectedly, maximal effect of insulin on autophosphorylation can be further increased by 83-14 antibody, leading to supramaximal activation of the autophosphorylation of the insulin receptor when both ligands are present together. Similarly, combined incubation of the fusion receptor with both insulin and 83-14 also results in a BRET signal that is higher than the maximal effect obtained with insulin alone. The effect of 83-14 antibody on BRET signal is likely to correspond to an intramolecular conformational change. Indeed, this effect was not affected by increasing the amount of partially purified proteins in the assay (results not shown). Moreover, no BRET signal could be induced by 83-14 antibody when WGL-eluates from cells transfected with IR-Rluc alone were mixed with WGL-eluates from cells transfected with IR-EYFP alone.
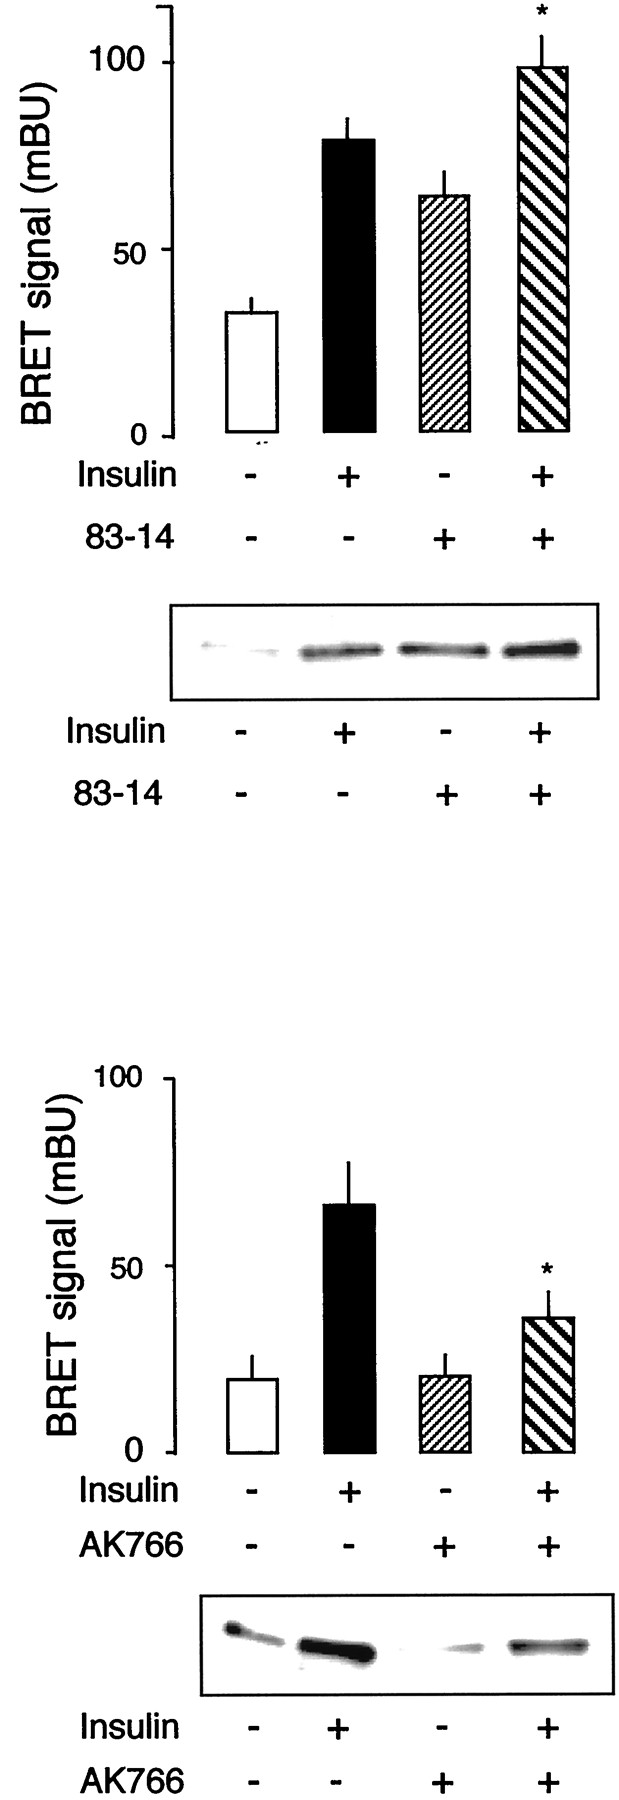
Effects of anti-insulin receptor antibodies on BRET signal. Top, graph, partially purified fusion receptors were incubated for 45 min in the presence of insulin (100 nM), 83-14 antibody (1 ng/μl), or both. BRET signal was measured as described underMaterials and Methods. Results are the mean ± S.E.M. of seven to nine experiments. *p < 0.05 compared with insulin alone (Student's t test). Blot, autophosphorylation of partially purified fusion receptors was performed as described under Materials and Methods in presence of insulin (100 nM), 83-14 antibody (1 ng/μl), or both. Bottom, graph, partially purified fusion receptors were incubated for 45 min in the presence of insulin (100 nM), AK766 antibody (200 ng/μl), or both. BRET signal was measured as described underMaterials and Methods. Results are the mean ± S.E.M. of three experiments. *p < 0.05 compared with insulin alone (Student's t test). Blot, autophosphorylation of partially purified fusion receptors was performed as described under Materials and Methods in presence of insulin (100 nM), AK766 antibody (200 ng/μl), or both.
As shown in Fig. 5B, autophosphorylation of the fusion receptor follows a similar pattern. These results indicate that our procedure detects conformational changes induced by an antibody with insulin-like activity, which has been shown to overcome a defect in insulin-mediated autophosphorylation in an insulin-resistant patient (Krook et al., 1996).
We also observed that an antibody raised against the entire intracellular portion of the human insulin receptor (anti-kinase antibody AK766), which inhibits insulin induced autophosphorylation (Fig. 5D), also markedly reduces insulin effect on BRET signal (Fig.5C). This indicates that inhibitors of insulin receptor activity can also be detected by this method.
Conclusion
We have developed an assay, based on bioluminescence resonance energy transfer, that monitors conformational changes within the insulin receptor. The BRET signal detected in this assay closely reflects the activation state of the receptor. Thus, our procedure allows for very rapid determination of the activation state of the insulin receptor and can be easily used in a high-throughput screening test for the search of novel molecules with insulin-like activities. Indeed, partially purified fusion insulin receptors can be prepared on a large scale by WGL-chromatography and stored at −80°C for subsequent use. This preparation can be distributed in an automated way in 96-well microplates and the effect of molecules on insulin receptor activity can be measured within a few minutes using the BRET method. We thus believe that this assay will be a valuable tool for the search of molecules with therapeutic properties.
Acknowledgments
We are very grateful to Dr. Ralf Jockers for valuable help and discussions on BRET. We also thank Stefano Marullo and Michel Bouvier for useful discussions and Pierre-Olivier Couraud for encouragement during the course of this study. We thank Kenneth Siddle and Jeremy Tavaré for providing us with anti-insulin receptor antibodies 83-14 and AK766. We also thank Marc Stanislawski for providing us with anti-mouse IgG peroxidase-coupled antibody used in immuno-blotting experiments.
Footnotes
-
This work was supported the Center National de la Recherche Scientifique, the Association pour la Recherche sur le Cancer, the Ligue contre le Cancer, and by a Roche-Pharma–Association de Langue Française d'Etude du Diabète et des Maladies Métaboliques) research grant.
- Abbreviations:
- BRET
- bioluminescence resonance energy transfer
- EYFP
- enhanced yellow fluorescent protein
- Rluc
- Renilla luciferase
- HEK
- human embryonic kidney
- MOPS
- 4-morpholinepropanesulfonic acid
- WGL
- wheat-germ lectin
- mBU
- milliBRET unit
- IR
- insulin receptor
- IGF
- insulin-like growth factor
- EGF
- epidermal growth factor
- Received May 7, 2001.
- Accepted June 15, 2001.
- The American Society for Pharmacology and Experimental Therapeutics


