


Abstract
Heme metabolism normally involves enzymatic conversion to biliverdin and subsequently to bilirubin, catalyzed by heme oxygenase and biliverdin reductase, respectively. We examined the ability of exogenously added hemin, biliverdin, or bilirubin to regulate Cyp1a1, an enzyme that may be active in bilirubin elimination. A substantial dose-dependent increase in Cyp1a1 mRNA occurred after treatment of Hepa 1c1c7 cells with either of the three compounds. This increase was readily apparent 1 hr after treatment with biliverdin or bilirubin but required ≥2 hr with hemin. Treatment of Hepa 1c1c7 cells with these compounds also caused a dose-dependent increase in Cyp1a1-dependent 7-ethoxyresorufin-O-deethylase (EROD) activity. Of the three compounds, bilirubin produced the greatest maximal increase in Cyp1a1 mRNA and EROD (5.5-, 10.5-, and 15-fold for 100 μmhemin, biliverdin, and bilirubin, respectively) activity. The RNA polymerase inhibitor actinomycin D completely blocked Cyp1a1 induction by these compounds, indicating a requirement for de novoRNA synthesis via transcriptional activation. The protein synthesis inhibitor cycloheximide did not affect Cyp1a1 mRNA induction, indicating a lack of requirement for labile protein factors. In contrast, EROD induction by hemin, biliverdin, or bilirubin was completely blocked by cycloheximide treatment, indicating that the increase in enzyme activity is dependent on increased Cyp1a1 apoprotein synthesis. Aryl hydrocarbon receptor (AHR)- and AHR nuclear translocator-deficient mutant Hepa 1c1c7 cells did not exhibit increased Cyp1a1 mRNA or EROD activity after treatment with these compounds, indicating the requirement for a functional AHR for this response. Consistent with this, hemin, biliverdin, and bilirubin were able to induce expression of the dioxin-response element/luciferase reporter plasmid pGudLuc1.1 after transient transfection into wild-type Hepa 1c1c7 cells. Gel retardation assays demonstrated that bilirubin, but not hemin or biliverdin, was able to transform the AHR to a form capable of specifically binding to a 32P-labeled oligonucleotide containing a dioxin-response element sequence. These data indicate that bilirubin induces Cyp1a1 gene transcription through direct interaction with the AHR. In contrast, hemin and biliverdin seem to induce Cyp1a1 indirectly by serving as precursors to the endogenous formation of bilirubin via normal heme metabolism pathways. This is the first direct demonstration that the endogenous heme metabolite bilirubin can directly regulate Cyp1a1 gene expression and enzymatic activity in an AHR-dependent manner.
P450s are a superfamily of heme-containing monooxygenase enzymes that metabolize a diverse range of compounds of both endogenous and exogenous origin (1). The level of gene expression for most of these enzymes is influenced by a number of endogenous regulatory factors, such as hormones, as well as by their xenobiotic substrates (2, 3). The Cyp1a1 isoform oxidatively biotransforms various PAHs, such as benzo[a]pyrene, to more polar and, sometimes, more toxic metabolites. Chemicals such as benzo[a]pyrene and TCDD are capable of high level transcriptional activation of theCyp1a1 gene by interaction with the AHR (4). On binding with a PAH ligand, the AHR forms a heterodimer with the AHRT protein and binds to specific DNA recognition sequences known as DREs located upstream of the Cyp1a1 transcription start site (5). Binding to these enhancer sequences causes a change in chromatin structure that facilitates binding of transcription factors to the Cyp1a1promoter (6).
Although substrate metabolism and transcriptional regulation ofCyp1a1 by xenobiotics have been extensively studied, analogous roles for endogenous compounds have not been described. Endogenous heme, derived primarily from the breakdown of cellular hemoproteins, is normally converted to biliverdin by HO, the rate-limiting enzyme of heme metabolism (7). Biliverdin reductase catalyzes the conversion of biliverdin to bilirubin, which may then be conjugated by UDP-GT before biliary excretion (8). A number of studies have indicated that Cyp1a1 may also contribute to heme metabolism. Humans with Crigler-Najjar syndrome and the corresponding Gunn rat animal model experience severe hyperbilirubinemia due to a congenital defect in the UDP-GT gene responsible for bilirubin conjugation (9). Administration of the CYP1A1 inducer TCDD to Gunn rats has been shown to lower serum plasma levels of unconjugated bilirubin (10). A PAH-inducible bilirubin degradation pathway, which is inhibited by an antibody that recognizes CYP1A1 and CYP1A2, has been identified in liver microsomes prepared from rats or chick embryos (11, 12). Consistent with the possibility that bilirubin may be a substrate for CYP1A1 and cause substrate-mediated transcriptional regulation of theCYP1A1 gene, the congenitally jaundiced Gunn rat is hyperbilirubinemic and exhibits an increased level of constitutive CYP1A1 expression (13, 14).
The purpose of this study was to examine and clarify the relationship(s) of endogenous heme metabolism to Cyp1a1 regulation. We examined the effect of treatment with exogenous hemin, biliverdin, and bilirubin on Cyp1a1 mRNA and enzyme activity in mouse hepatoma Hepa 1c1c7 cells. The involvement of the AHR in this process was also investigated using AHR- and ARNT-deficient mutant Hepa 1c1c7 cells, a DRE/luciferase reporter gene, and gel retardation assays. We provide direct evidence for AHR-dependent regulation of Cyp1a1 gene expression and enzyme activity by bilirubin, an endogenous metabolite of heme.
Experimental Procedures
Materials.
Hemin IX chloride, bilirubin IX, and biliverdin IX dihydrochloride were purchased from Sigma Chemical (St. Louis, MO.). Actinomycin D and cycloheximide were from Fluka (Buchs, Switzerland). Dioctylamine was from Aldrich Chemical (Milwaukee, WI). ERF and resorufin were from Molecular Probes (Eugene, OR). Penicillin, streptomycin, amphotericin B, [α-32P]dCTP (3000 Ci/mmol), and [γ-32P]ATP (7000 Ci/mmol) were from ICN Biomedicals Canada (Montreal, Quebec, Canada). Prime-a-Gene random primer DNA labeling kit was from Promega (Madison, WI). Hybond-N nylon filters were from Amersham Canada (Oakville, Ontario, Canada). All restriction enzymes were from Pharmacia Canada (Baie d’Urfe, Quebec, Canada). Taq DNA polymerase, Superscript II RNase H− reverse transcriptase, fetal calf serum, improved minimal essential medium, and gentamycin sulfate were from GIBCO BRL Canada (Burlington, Ontario, Canada). TCDD was a generous gift from Dr. Tim Zacharewski (University of Western Ontario). Poly(dI/dC) was obtained from Boehringer-Mannheim Biochemicals (Montreal, Quebec, Canada). PCR primers were synthesized and purified through HPLC by General Synthesis and Diagnostics (Toronto, Ontario, Canada). All other chemicals (reagent grade or better) were purchased from BDH (Toronto, Ontario, Canada).
Cell culture and treatments.
The mouse hepatoma Hepa 1c1c7 cell lines (wild-type, C4, and C12; generously provided by Dr. O. Hankinson, University of California, Los Angeles) were maintained in a standard media consisting of improved minimal essential medium supplemented with 10% fetal bovine serum, 20 μm l-glutamine, 50 μg/ml gentamycin sulfate, 100 IU/ml penicillin, 10 μg/ml streptomycin, and 25 ng/ml amphotericin B. Cells were grown in 75-cm2 tissue culture flasks at 37° in a 4% CO2 humidified environment.
Hemin, biliverdin, and bilirubin were initially dissolved in a small volume of 1 mm NaOH and made up to the desired final volume with sterile PBS, pH 7.4. These solutions were prepared fresh for each experiment under low light conditions. Actinomycin D was dissolved in 75% ethanol, cycloheximide was dissolved in sterile distilled water, and TCDD was dissolved in dimethylsulfoxide. For all experiments, control groups for each of the treatments were administered the appropriate solvent. For analysis of mRNA expression levels, ∼2 × 10⁷ cells were added to 100-mm tissue culture dishes in 10 ml of normal culture media. For analysis of EROD levels, ∼1 × 10⁵ cells were added to each well of a 96-well tissue culture plate in 250 μl of normal culture media. On 60–80% confluence (1–2 days), appropriate stock solutions of the test chemicals were directly added to the culture media. For experiments involving actinomycin D, cycloheximide, or tin protoporphyrin, these chemicals were added 1.5 hr before the addition of the test compounds.
RNA extraction and analysis.
After incubation with the test compounds for specified time periods, the culture media was aspirated, and the cell monolayers were washed twice with ice-cold PBS. Total cell RNA was isolated by the acid guanidinium thiocyanate-phenol-chloroform extraction method of Chomczynski and Sacchi (15). For Northern blots, aliquots of RNA were separated in a denaturing (2.2 mformaldehyde) agarose (1.1%) gel and transferred to Hybond-N nylon filters. The RNA was fixed to the filters by baking at 80° for 2 hr. Prehybridization of the filters was carried out in a solution containing 6× SSPE (0.9 m NaCl, 0.06 mNaH3PO4·H3O, 0.006 mNa2EDTA), 50% deionized formamide, 5× Denhardt’s solution (0.1% polyvinylpyrrolidone, 0.1% Ficoll, 0.1% bovine serum albumin), 0.5% SDS, and 100 μg/ml sheared salmon sperm DNA for 4 hr at 42°. Hybridization with the32P-labeled cDNA probes was carried out in the same solution, without Denhardt’s reagent, for 16–24 hr at 42°. The filters were then washed twice at room temperature in 2× SSPE/0.5% SDS for 15 min. This was followed by a 30-min wash in 0.1× SSPE/0.5% SDS at 42° and a final 30-min wash in 0.1× SSPE/0.5% SDS at 65° for 30 min. The washed filters were sealed in plastic wrap and exposed to Kodak X-OMAT AR film in the presence of an intensifier screen at −80°. After exposure, the filters were stripped by washing in 0.1× SSPE/0.5% SDS at 100° before subsequent cDNA hybridizations.
The 539-bp cDNA probe for mouse CYP1A1 mRNA was generously provided by Dr. T. Zacharewski (University of Western Ontario). A cDNA probe for rat HO-1 mRNA was prepared by reverse transcription coupled to PCR amplification using the primers FHO1 5′-GAGGTGCACATCCGTGCAGAGA-3′ (forward) and RHO1 5′-GCAGTCATGGTCAGTCAACATGG-3′ (reverse). Briefly, 1 μg of total RNA from the liver of a sodium arsenite-treated rat was used as a template for first-strand cDNA synthesis using reverse transcriptase according to the manufacturer’s (BRL) specifications and by using RHO1 as the primer. Then, 10% of the cDNA products were added to a standard PCR mixture according to the manufacturer’s instructions (BRL) using FHO1 and RHO1 as specific primers. PCR amplification was performed with a Perkin-Elmer Cetus (model 480; Norwalk, CT) DNA thermal cycler using the following temperature profile: initial denaturation for 5 min at 95°; 35 cycles of 45 sec at 95° (denaturation), 45 sec at 60° (annealing), 1.5 min at 72° (extension), and a final extension of 6 min at 72°. Subsequently, the 1132-bp cDNA product, corresponding to nucleotides 67–1196 of the published sequence (16), was purified from the PCR reaction by agarose (1%) gel electrophoresis. An 883-bpEcoRI/HindIII digestion product corresponding to nucleotides 87–970 of rat HO-1 mRNA was used as a specific probe for rat HO-1 mRNA. All probes were 32P-labeled by the random primer method according to the manufacturer’s (Promega) instructions.
EROD assays.
EROD assays were performed on intact, living Hepa cells. An ERF working solution was produced by dilution of stock (0.4 mm in dimethylsulfoxide) ERF to a final concentration of 2 μm in assay buffer (0.05 m Tris, 0.1m NaCl, pH 7.8) that had been prewarmed to 37°. After aspiration of the media containing the test compounds, the cell monolayers were rinsed with warmed (37°) PBS. ERF working solution (75 μl) was then added to each cell well, and the plates were placed in a shaking incubator at 37°. After 5 min, initial fluorescence (excitation, 545 nm; emission, 575 nm; Baxter 96-well fluorometer) measurements were recorded from each cell well, and the plates were replaced in the incubator. After an additional 10 min, a final set of fluorescence measurements of the cell wells was performed. The amount of resorufin formed in each well between the initial and final fluorescence measurements was determined by comparison with a standard curve of known concentrations. Under these assay conditions, the formation of resorufin with respect to time was verified to proceed linearly for a minimum of 15 min after the initial fluorescence measurements. The working solution was then aspirated, the cell wells were rinsed twice with PBS, and 50 μl of distilled water was added to lyse the cells. After placing of the cell plates at −80° for 30 min, the cell lysates were allowed to thaw, and protein levels were determined according to the method of Lowry et al. (17) using a Molecular Devices Emax microplate reader.
Transient transfection and luciferase assays.
Wild-type Hepa 1c1c7 cells were plated onto six-well multiwell tissue culture plates at ∼50–60% confluence 6 hr before transfection in standard growth media. Each well of cells was transfected with 1.5 μg of the β-galactosidase expression plasmid pCH110 (Pharmacia) as a control for transfection efficiency and 2.5 μg of the DRE-luciferase reporter plasmid pGudLuc1.1 (provided by Dr. M. Denison, University of California at Davis) using a standard calcium phosphate coprecipitation technique (18). The medium was aspirated, the cells were washed twice with PBS, and the medium was replaced 24 hr after transfection. Then, test compounds were added directly to the medium (0.1% v/v). The cells were harvested 24 hr later and assayed for β-galactosidase activity using a 96-well absorbance plate reader (Molecular Devices Emax) according to standard techniques (18). Luciferase activity was measured using a 96-well luminometer (Labsystems Luminoskan) using standard methods (19). Luciferase values were corrected for transfection efficiency (β-galactosidase activity) and are expressed as fold-induction relative to solvent-treated control cells.
Gel retardation assays.
For preparation of guinea pig hepatic cytosol, freshly excised livers were homogenized in ice-cold HEGD buffer (25 mm HEPES, 5 mm EDTA, 10% glycerol, pH 7.4) using three passes with a Teflon-glass homogenizer. The resulting homogenate was centrifuged at 9000 × gfor 20 min at 4° followed by centrifugation of the supernatant at 100 000 × g for 60 min at 4°. For preparation of Hepa cytosol, wild-type cells were grown to 90% confluence in 100-mm tissue culture dishes, washed twice with PBS, and detached using trypsin (0.5%). Cells were pelleted at 1000 × g, resuspended in HEGD buffer, homogenized (Kontes Tenbroek, Vineland, NJ), and centrifuged at 100,000 × g for 60 min at 4°. Aliquots of Hepa cell and guinea pig liver cytosol (100,000 ×g supernatant) were flash-frozen in liquid nitrogen and stored at −80° until use.
The following complementary oligonucleotides were synthesized and used in the gel retardation assays: (i) −998 to −973 of the Cyp1a1 regulatory region (5′-gatctctTCTCACGCaActccgag-3′ and 5′-gatcctcggagTtGCGTGAGAaga-3′; henceforth termed DRE) and (ii) −998 to −973 of the Cyp1a1 regulatory region containing a single nucleotide transversion substitution (underlined) within the core DRE motif (5′-gatctctTCTCGCGCaActccgag-3′ and 5′-gatcctcggagTtGCGCGAGAaga-3′; henceforth termed mutant DRE). Oligonucleotides were 32P-labeled at the 5′-end using T4 polynucleotide kinase and [γ-32P]ATP using standard methodology (18). After adding NaCl to a final concentration of 100 mm, the oligonucleotides were annealed by heating to 70° and allowing to cool to room temperature. The 32P-labeled DRE was then purified by loading onto a 15% nondenaturing polyacrylamide gel and electrophoresis in 1× TBE buffer (90 mm Tris, 120 mm boric acid, 4 mm EDTA, pH 8.0). The labeled DRE was visualized by a 10-sec exposure to Kodak X-OMAT AR film, excised from the gel, and eluted into 400 μl of TE buffer (10 mm Tris, 1 mm EDTA, pH 8.0) for 16 hr at 37°.
Assessment of AHR transformation and DNA binding was performed essentially as previously described (20). Briefly, cytosol from Hepa 1c1c7 cells (5 mg/ml) or guinea pig liver (16 mg/ml) was transformed by incubation at 22° for 2 hr with the test compounds dissolved in dimethylsulfoxide. Transformed cytosol (5 μl) was then incubated for 15 min at 22° with HEGD buffer (15 μl) containing KCl (64 mm final concentration for Hepa cytosol, 96 mmfor guinea pig) and 375 ng of poly(dI/dC). For the competition assays, unlabeled, annealed DRE was also added to this initial incubation. Labeled, annealed oligonucleotides (100,000 cpm, 0.5 ng) were then added, followed by a second incubation for 15 min at 22°. The samples were loaded onto a 5% nondenaturing polyacrylamide gel and electrophoresed in 1× TBE. After drying, gels were visualized by exposure to Kodak X-OMAT AR film in the presence of an intensifier screen at −80°.
HO and biliverdin reductase assays.
Wild-type Hepa 1c1c7 cells were grown to 80–90% confluence in 100-mm tissue culture dishes. After treatment with the test compounds for 6 hr, the cell monolayers were washed twice with ice-cold PBS, scraped from the tissue culture dishes with a rubber policeman, and pelleted at 1000 ×g for 1 min at 4°. Cell pellets were resuspended in 100 μl of hypotonic buffer consisting of 10 mm potassium phosphate buffer, pH 7.4, and 50 μm phenylmethylsulfonyl fluoride. After sitting on ice for 10 min, the cell suspensions were flash-frozen in liquid N2 and subsequently allowed to thaw on ice. Two such freeze-thawing cycles resulted in essentially complete cell lysis as assessed by light microscopy. The lysed cell suspension was then centrifuged at 15,000 ×g for 1 min at 4°. The supernatant from this spin, which contains both HO and biliverdin reductase activity, was used for all enzyme assays. Protein concentrations were determined according to the method of Lowry et al. (17).
For determination of biliverdin reductase activity, incubations contained 1.25 mg/ml lysate, 25 μm biliverdin, and 1 mm NADPH in 0.1 m potassium phosphate buffer, pH 7.4. For the HO assays, incubations contained 5 mg/ml lysate, 25 μm hemin, and 1 mm NADPH in 0.1 mpotassium phosphate buffer, pH 7.4. Samples were incubated for 15 min (biliverdin reductase) or 60 min (HO) at 37°. For the HO samples, additional NADPH was added after 20 and 40 min. Reactions were stopped by the addition of two volumes of CHCl3. After vigorous mixing, the samples were centrifuged at 10,000 ×g for 5 min, and the lower CHCl3 phase was removed to a fresh tube. The CHCl3 was evaporated under a gentle stream of N2, and the resulting residue was subsequently dissolved in 100 μl of methanol.
Bilirubin content of the extracted samples was analyzed by reverse-phase HPLC based on the method of McDonagh et al.(21). Briefly, the HPLC system consisted of a Waters (Milford, MA) HPLC pump and injector connected to an Ultrasphere-IP column (5 μm, C-18, 25 × 0.46 cm; Beckman-Altex, Palo Alto, CA). The mobile phase consisted of 0.1 m dioctylamine in methanol/water (96:4 v/v) at a flow rate of 1 ml/min. A Waters tunable absorbance detector was used for continuous monitoring at 460 nm. The retention time for bilirubin was 6.8 min. Quantification of bilirubin was achieved through comparison with known quantities of bilirubin dissolved in a 1 mg/ml bovine serum albumin solution and extracted identically as the unknown samples. The limit of detection for this system was 50 pmol.
Statistics.
Data were analyzed by analysis of variance followed by the Bonferroni/Dunn test for multiple comparisons using StatView 4.01 software (Abacus Concepts, Berkeley, CA).
Results
Increase of Cyp1a1 after heme compound treatment.
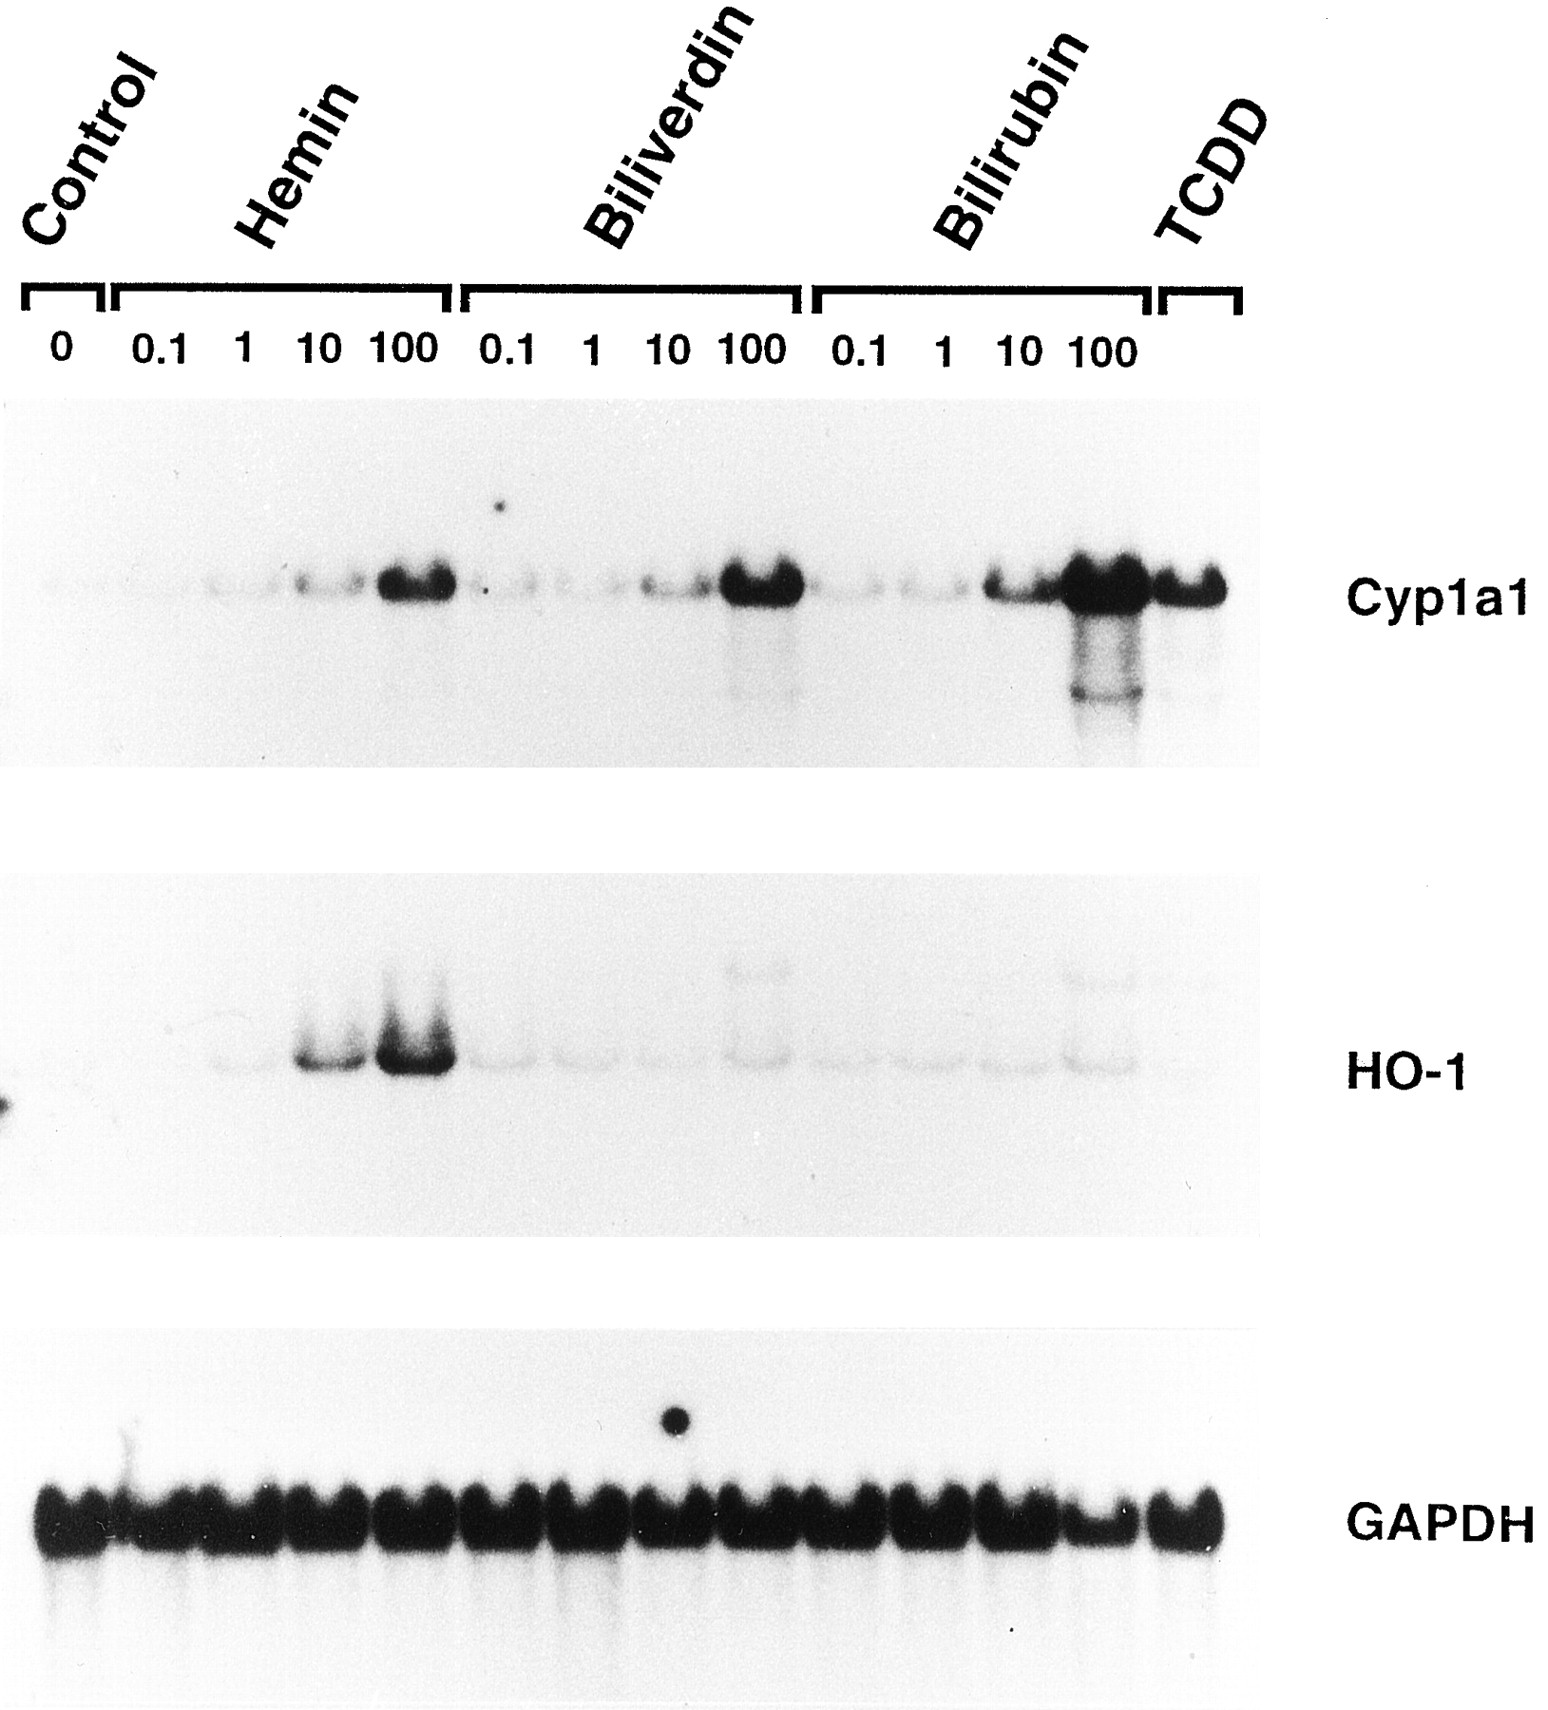
The effect of hemin, biliverdin, or bilirubin on steady state Cyp1a1 mRNA levels as assessed by Northern blots is shown in Fig.1. All of the compounds caused a dose-dependent increase in Cyp1a1 mRNA levels 3 hr after treatment compared with solvent-treated control Hepa 1c1c7 cells. Bilirubin was clearly the most potent and effective, with discernible effects evident at a concentration of 1 μm. At a concentration of 100 μm, bilirubin produced the greatest increase, followed by biliverdin and hemin, respectively. As expected, 1 nm TCDD caused a substantial increase in Cyp1a1 mRNA after 3 hr; however, at this time point the effect was not as great as that with 100 μm bilirubin. Also shown in Fig. 1 is the effect of the tested compounds on the steady state levels of inducible HO-1 isoform mRNA. Only hemin increased HO-1 mRNA levels in a dose-dependent manner. For reference purposes, the blots were stripped and rehybridized with a cDNA probe for GAPDH mRNA as a loading control for all of the Northern blots presented in this study.

Dose-dependent increase in Cyp1a1 mRNA in wild-type Hepa 1c1c7 cells 3 hr after treatment with hemin, biliverdin, or bilirubin as assessed by Northern blot analysis. Total RNA (10 μg) was separated on a 1.1% formaldehyde denaturing gel, transferred to nylon membranes, and hybridized with a 32P-labeled cDNA probe specific for mouse Cyp1a1 mRNA as described in Experimental procedures. The blots were subsequently stripped and rehybridized with a cDNA probe for HO-1, as well as for GAPDH, which was used as a loading control. Transcript sizes for Cyp1a1, HO-1, and GAPDH mRNA were ∼2.9, ∼1.8, and ∼1.3 kb, respectively. Total RNA isolated from cells 3 hr after treatment with 1 nm TCDD was used as a positive control for Cyp1a1 induction.
Fig. 2 shows the time course for Cyp1a1 mRNA increases 0, 1, 2, 4, 8, or 12 hr after treatment with 100 μm hemin, biliverdin, or bilirubin. The onset of Cyp1a1 increase was rapid for all compounds and was readily apparent by 1 hr for biliverdin and bilirubin. However, the increase in response to 100 μm hemin was somewhat delayed, with an increase in Cyp1a1 mRNA levels being clearly achieved only after 2 hr. By 24 hr, the Cyp1a1 mRNA levels were clearly diminished relative to the maximum for each compound but remained elevated relative to that seen at 0 hr in each case.
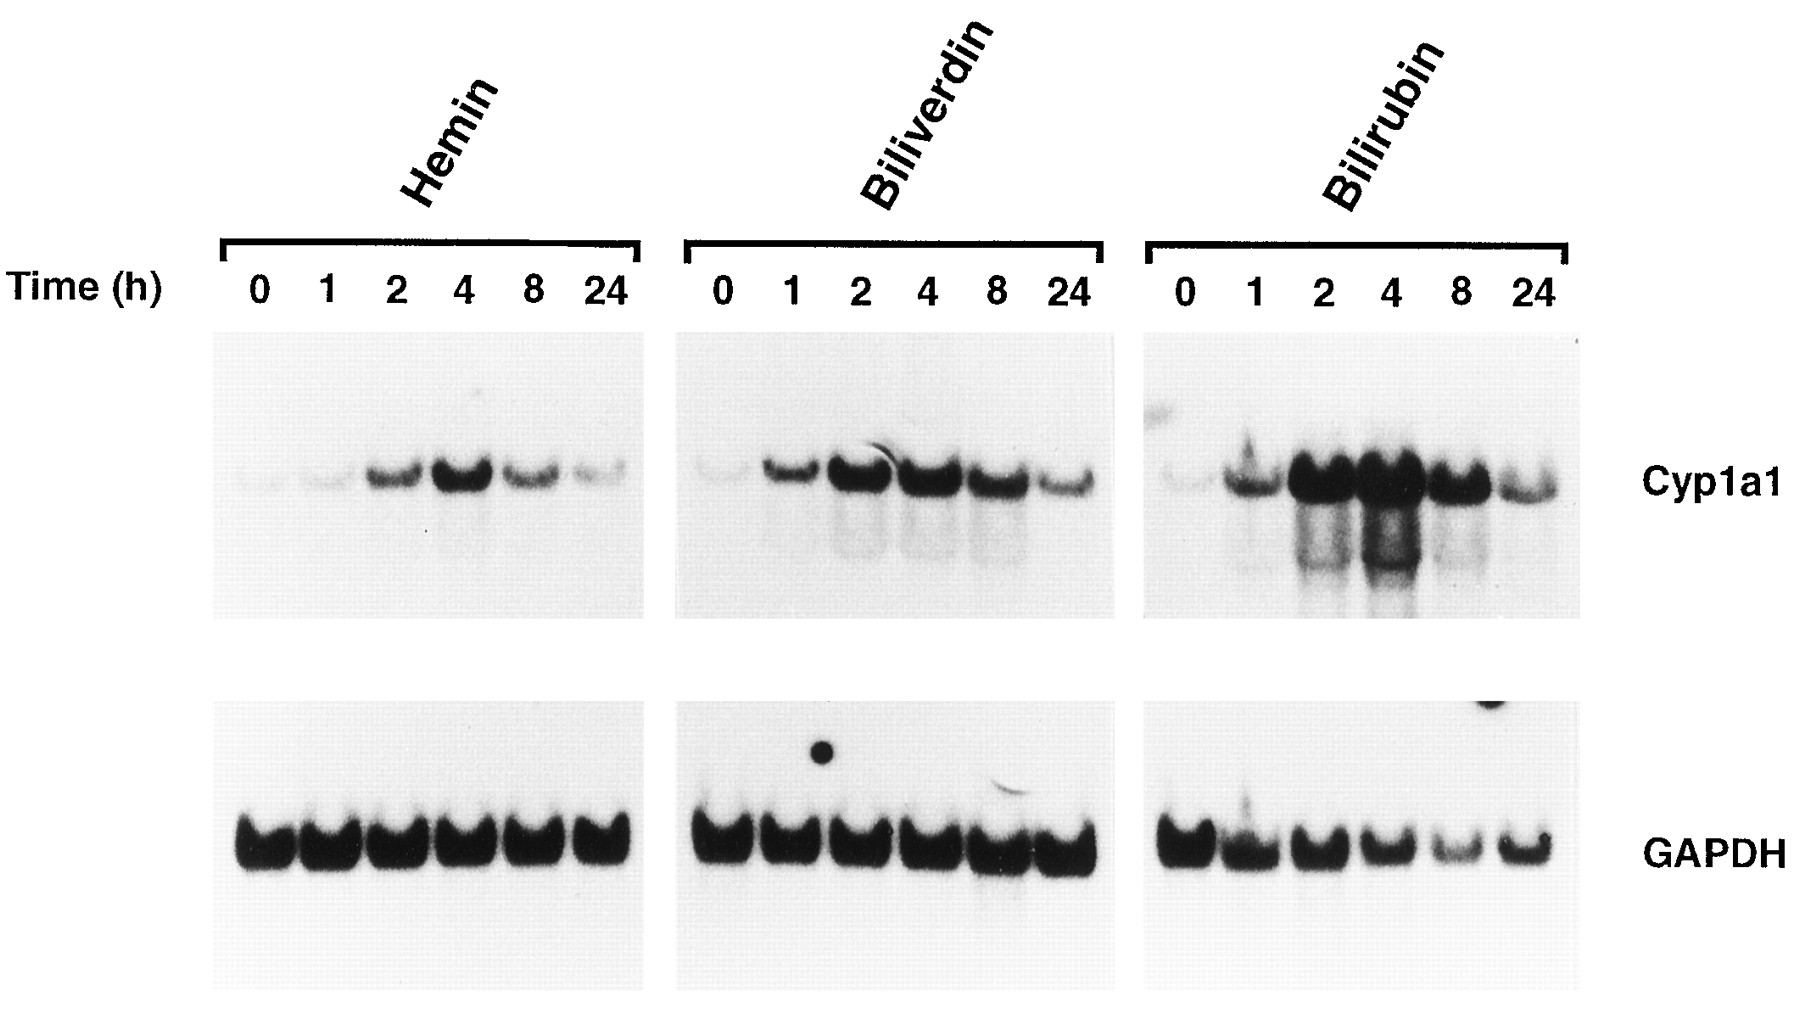
Time-dependent increase in Cyp1a1 mRNA in wild-type Hepa 1c1c7 cells 0, 1, 2, 4, 8, or 24 hr after treatment with 100 μm hemin, biliverdin, or bilirubin as assessed by Northern blot analysis. Total RNA (10 μg) was separated on a 1.1% formaldehyde denaturing gel, transferred to nylon membranes, and hybridized with a 32P-labeled cDNA probe specific for mouse Cyp1a1 mRNA as described in Experimental procedures. The blots were subsequently stripped and rehybridized with a cDNA probe for GAPDH, which was used as a loading control. Transcript sizes for Cyp1a1 and GAPDH mRNA were ∼2.9 and ∼1.3 kb, respectively.
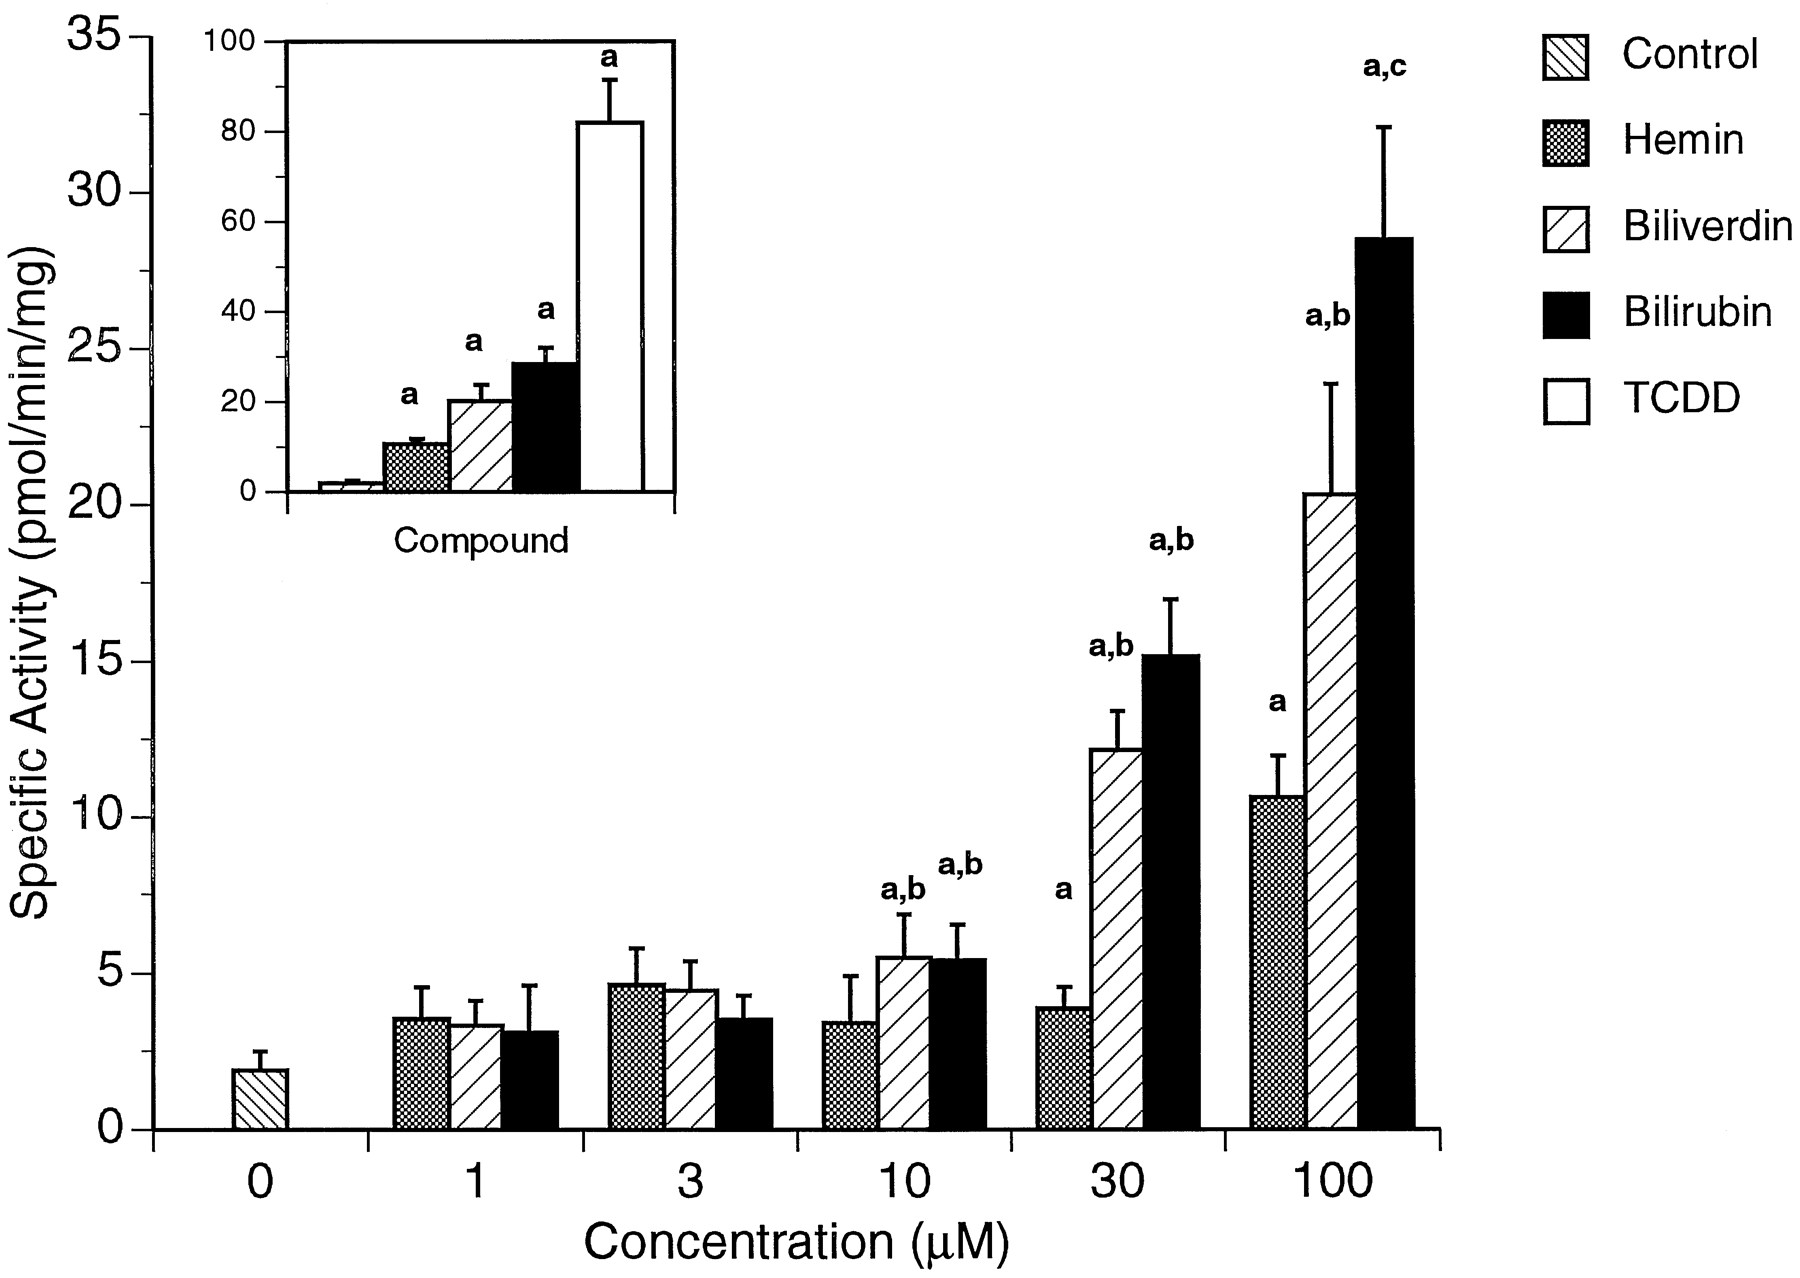
To assess the functional implications of exposure to hemin, biliverdin, or bilirubin, Cyp1a1-dependent EROD activity was also measured in Hepa 1c1c7 cells (Fig. 3). Each of the compounds produced a dose-dependent increase in EROD activity 24 hr after treatment compared with solvent-exposed control cells. Significant increases of EROD activity were measured at 30 and 100 μm for hemin (2.0- and 5.5-fold, respectively) and at 10, 30, and 100 μm for biliverdin (3.0-, 6.5-, and 10.5-fold) and bilirubin (3.0-, 8.0-, and 15.0-fold). Furthermore, biliverdin and bilirubin increased EROD activity significantly more than hemin at 10, 30, and 100 μm, whereas bilirubin produced a significantly greater increase than hemin or biliverdin at 100 μm. The positive control and reference compound TCDD (1 nm) produced a ∼41-fold increase in EROD activity (Fig.3, inset).

Dose-dependent increase in Cyp1a1-dependent EROD activity in wild-type Hepa 1c1c7 cells 24 hr after treatment with hemin, biliverdin, or bilirubin. EROD activity was measured in intact, living cells using a 96-well plate fluorescence assay as described in Experimental Procedures. Inset, cells treated with 1 nm TCDD were used as a positive control for Cyp1a1 induction. Values are mean ± standard deviation of 12 independent experiments performed in duplicate. a, Significantly different from 0 μm (p < 0.01).b, Significantly different from hemin (p < 0.01). c, Significantly different from hemin and biliverdin (p < 0.01).
Effect of RNA and protein synthesis inhibitors.
To determine whether the increase in Cyp1a1 in response to hemin, biliverdin, or bilirubin exposure was a result of de novo RNA synthesis or a post-transcriptional effect, Hepa 1c1c7 cells were cotreated with the RNA polymerase inhibitor actinomycin D. Treatment with 1 μg/ml actinomycin D 2 hr before exposure to 100 μm hemin, biliverdin, or bilirubin completely abolished any increase in Cyp1a1 mRNA (Fig. 4A). As expected, actinomycin D also inhibited induction by 1 nm TCDD, a finding consistent with an increase in Cyp1a1 gene transcription by this compound. Actinomycin D also completely blocked the increase in Cyp1a1-dependent EROD activity in response to 100 μmhemin, biliverdin, or bilirubin (Fig. 4B) or 1 nm TCDD (Fig. 4B, inset). Actinomycin D also significantly decreased basal EROD levels in solvent-treated Hepa 1c1c7 cells.

A, Inhibition of Cyp1a1 mRNA increase in wild-type Hepa 1c1c7 cells by actinomycin D. Cells were treated with 0 (C) or 1 (A) μg/ml actinomycin D 2 hr before exposure to 100 μm hemin, biliverdin, or bilirubin for a subsequent 3-hr time period. Total RNA (10 μg) was separated on a 1.1% formaldehyde denaturing gel, transferred to nylon membranes, and hybridized with a 32P-labeled cDNA probe specific for mouse Cyp1a1 mRNA as described in Experimental Procedures. The blots were subsequently stripped and rehybridized with a cDNA probe for GAPDH, which was used as a loading control. Transcript sizes for Cyp1a1 and GAPDH mRNA were ∼2.9 and ∼1.3 kb, respectively. Total RNA isolated from cells 3 hr after treatment with 1 nm TCDD was used as a positive control for Cyp1a1 induction. B, Inhibition of Cyp1a1-dependent EROD activity increase in wild-type Hepa 1c1c7 cells by actinomycin D. EROD activity was measured in intact, living cells 24 hr after exposure to 100 μm hemin, biliverdin, or bilirubin, and cotreatment with 0 or 1 μg/ml actinomycin D as described in Experimental Procedures. Inset, cells treated with 1 nm TCDD were used as a positive control for Cyp1a1 induction. Values are mean ± standard deviation of six independent experiments performed in duplicate. a, Significantly different from treatment with 0 μg/ml actinomycin D (p < 0.01).
We also determined whether increased Cyp1a1 mRNA levels due to hemin, biliverdin, or bilirubin exposure were dependent on the action or actions of a highly labile or de novo synthesized protein or proteins by treating Hepa 1c1c7 cells with the protein synthesis inhibitor cycloheximide. A 2-hr pretreatment with 1 μg/ml cycloheximide had no discernible effect on the increase in Cyp1a1 mRNA in response to hemin, biliverdin, or bilirubin (Fig.5A). This treatment, however, did increase Cyp1a1 mRNA levels in vehicle-treated and 0.1 nmTCDD-treated cells. With respect to EROD activity, cycloheximide completely abolished the increases normally seen in response to hemin, biliverdin, or bilirubin treatment (Fig. 5B). Furthermore, EROD activity was depressed to values much lower than those observed for vehicle-treated control cells, indicating a requirement for protein synthesis for increased EROD activity, as well as maintenance of basal levels. Similar effects were observed for TCDD-treated Hepa 1c1c7 cells (Fig. 5B, inset).

A, Effect of cycloheximide on Cyp1a1 mRNA increase in wild-type Hepa 1c1c7 cells as assessed by Northern blot analysis. Cells were treated with 0 (C) or 1 μg/ml cycloheximide (X) 2 hr before exposure to 100 μm hemin, biliverdin, or bilirubin for a subsequent 3-hr time period. Total RNA (10 μg) was separated on a 1.1% formaldehyde denaturing gel, transferred to nylon membranes, and hybridized with a32P-labeled cDNA probe specific for mouse Cyp1a1 mRNA as described in Experimental Procedures. The blots were subsequently stripped and rehybridized with a cDNA probe for GAPDH, which was used as a loading control. Transcript sizes for Cyp1a1 and GAPDH mRNA were ∼2.9 and ∼1.3 kb, respectively. Total RNA isolated from cells 3 hr after treatment with 1 nm TCDD was used as a positive control for Cyp1a1 induction. B, Inhibition of Cyp1a1-dependent EROD activity increase in wild-type Hepa 1c1c7 cells by cycloheximide. EROD activity was measured in intact, living cells 24 hr after exposure to 100 μm hemin, biliverdin, or bilirubin and cotreatment with 0 or 1 μg/ml cycloheximide as described in Experimental Procedures. Inset, cells treated with 1 nmTCDD were used as a positive control for Cyp1a1 induction. Values are mean ± standard deviation of 6 independent experiments performed in duplicate. a, Significantly different from treatment with 0 μg/ml actinomycin D (p < 0.01).
AHR-dependent induction of Cyp1a1.
The availability of mutant Hepa 1c1c7 cell lines that lack an AHR-dependent Cyp1a1 induction mechanism (22) permits testing for the involvement of this signal transduction pathway in the actions of a compound. Fig.6 shows the lack of Cyp1a1 mRNA increase in ARNT-deficient Hepa 1c1c7 C4 (C4) and AHR-deficient Hepa 1c1c7 C12 (C12) cells 3 hr after treatment with 100 μm hemin, biliverdin, or bilirubin or the positive control compound, 1 nm TCDD. Consistent with these data, no EROD activity was detected after treatment of C4 or C12 cells with these compounds, solvent (Fig. 7), or 1 nmTCDD (Fig. 7, inset). In contrast, significant increases of Cyp1a1 mRNA and EROD activity were found on treatment of wild-type Hepa 1c1c7 cells with each of the test compounds.

Lack of Cyp1a1 mRNA increase in mutant Hepa 1c1c7 cells as assessed by Northern blot analysis. Wild type (WT), ARNT-deficient (C4), or AHR-deficient (C12) Hepa 1c1c7 cells were exposed to 100 μm hemin, biliverdin, or bilirubin for a 3-hr time period. Total RNA (10 μg) was separated on a 1.1% formaldehyde denaturing gel, transferred to nylon membranes, and hybridized with a32P-labeled cDNA probe specific for mouse Cyp1a1 mRNA as described in Experimental Procedures. The blots were subsequently stripped and rehybridized with a cDNA probe for GAPDH, which was used as a loading control. Transcript sizes for Cyp1a1 and GAPDH mRNA were ∼2.9 and ∼1.3 kb, respectively. Total RNA isolated from cells 3 hr after treatment with 1 nm TCDD was used as a positive control for Cyp1a1 induction.

Lack of increase in Cyp1a1-dependent EROD activity in mutant Hepa 1c1c7 cells 24 hr after treatment with hemin, biliverdin, or bilirubin. EROD activity was measured in intact, living wild-type (WT), ARNT-deficient (C4), or AHR-deficient (C12) cells using a 96-well plate fluorescence assay as described in Experimental Procedures. Cells treated with 1 nm TCDD were used as a positive control for Cyp1a1 induction. Values are mean ± standard deviation of six independent experiments performed in duplicate. a, Significantly different from 0 μm(p < 0.01). ND, not detected.
To obtain further evidence for involvement of an AHR-dependent mechanism, wild-type Hepa 1c1c7 cells were transiently transfected with the DRE-luciferase reporter construct plasmid pGudLuc1.1 (23). This construct contains a sequence of the Cyp1a1 gene (−1301 to −819) that encompasses four copies of the DRE enhancer sequence located upstream of a structural gene coding for the enzyme luciferase. Thus, AHR-dependent inducible expression is conferred on the luciferase gene by the presence of the DRE enhancer sequences. The advantage of this bioassay is that luciferase induction can occur only through the AHR; therefore, other mechanisms, such as mRNA stability (24), that might influence EROD activity are excluded. The treatment of transiently transfected cells with hemin, biliverdin, or bilirubin significantly increased luciferase activity in a dose-dependent manner compared with solvent-treated control cells (Fig.8). Specifically, induction by 10 or 100 μm biliverdin (3.0- and 11.5-fold, respectively) or bilirubin (4.0- and 16.5-fold) was significantly greater than that observed for equimolar hemin (1.5- and 2.5-fold). Furthermore, 100 μm bilirubin increased luciferase activity significantly more than observed for equimolar biliverdin or hemin. As expected, treatment with 1 nm TCDD produced the greatest induction (52-fold) of all tested compounds (Fig. 8, inset). With respect to 10 and 100 μm biliverdin and bilirubin, the magnitude of increase in luciferase activity was similar to that measured for EROD activity; however, the magnitude of luciferase induction (2.5-fold) for 100 μm hemin was approximately half of that seen for EROD induction (5.5-fold).

Dose-dependent increase in DRE/luciferase reporter construct (pGudLuc1.1) activity in wild-type Hepa 1c1c7 cells 24 hr after treatment with hemin, biliverdin, or bilirubin. Wild-type Hepa 1c1c7 cells were transiently transfected with pGudLuc1.1 and pCH110 as described in Experimental Procedures. Inset, cells treated with 1 nm TCDD were used as a positive control for luciferase induction. Fold-induction represents the luciferase activity, corrected for transfection efficiency (β-galactosidase activity from pCH110), relative to that measured in vehicle (0 μm)-treated cells. Values are mean ± standard deviation of six independent experiments performed in duplicate.a, Significantly different from 0 μm(p < 0.01). b, Significantly different from hemin (p < 0.01).c, Significantly different from hemin and biliverdin (p < 0.01).
Ligand-dependent transformation of the AHR is required for AHR-mediated transcriptional activation. We performed gel retardation assays to determine whether hemin, biliverdin, or bilirubin was capable of inducing the in vitro formation of AHR/ARNT heterodimers that are capable of specific binding to32P-labeled double-stranded oligonucleotides containing a normal DRE sequence. After incubation of these test compounds with Hepa 1c1c7 cell cytosol in vitro, only bilirubin induced the formation of a heterodimer/32P-DRE complex that comigrated with that induced by TCDD (Fig. 9A). To obtain evidence that the apparent absence of Hepa AHR transformation by hemin and bilirubin was not due to a lack of sensitivity, gel retardation assays were also performed with guinea pig hepatic cytosol, a preparation that provided a greater magnitude of response in our experiments. Similar to Hepa cells, only bilirubin caused the formation of a heterodimer/32P-DRE complex that comigrated with that induced by TCDD (Fig. 9B). Formation of this complex was dose dependent, occurred in the same concentration range as observed for Cyp1a1 mRNA induction by bilirubin, and was maximal at a concentration of 100 μm bilirubin. The specificity of this interaction was verified by the ability of an excess of unlabeled DRE oligonucleotide to compete away the bilirubin-induced binding of the transformed AHR to a 32P-labeled DRE in a concentration-dependent manner (Fig.10). The sequence specificity of this interaction was further investigated in experiments with a mutant DRE oligonucleotide containing a single nucleotide transversion within the core of the DRE consensus sequence (GCGTG to GCGCG). Mutations in this core sequence dramatically decrease AHR binding (25, 26). The addition of an excess of this unlabeled mutant oligonucleotide failed to compete away the signal representing the protein/DNA complex at concentrations identical to that used for unlabeled wild-type DRE.
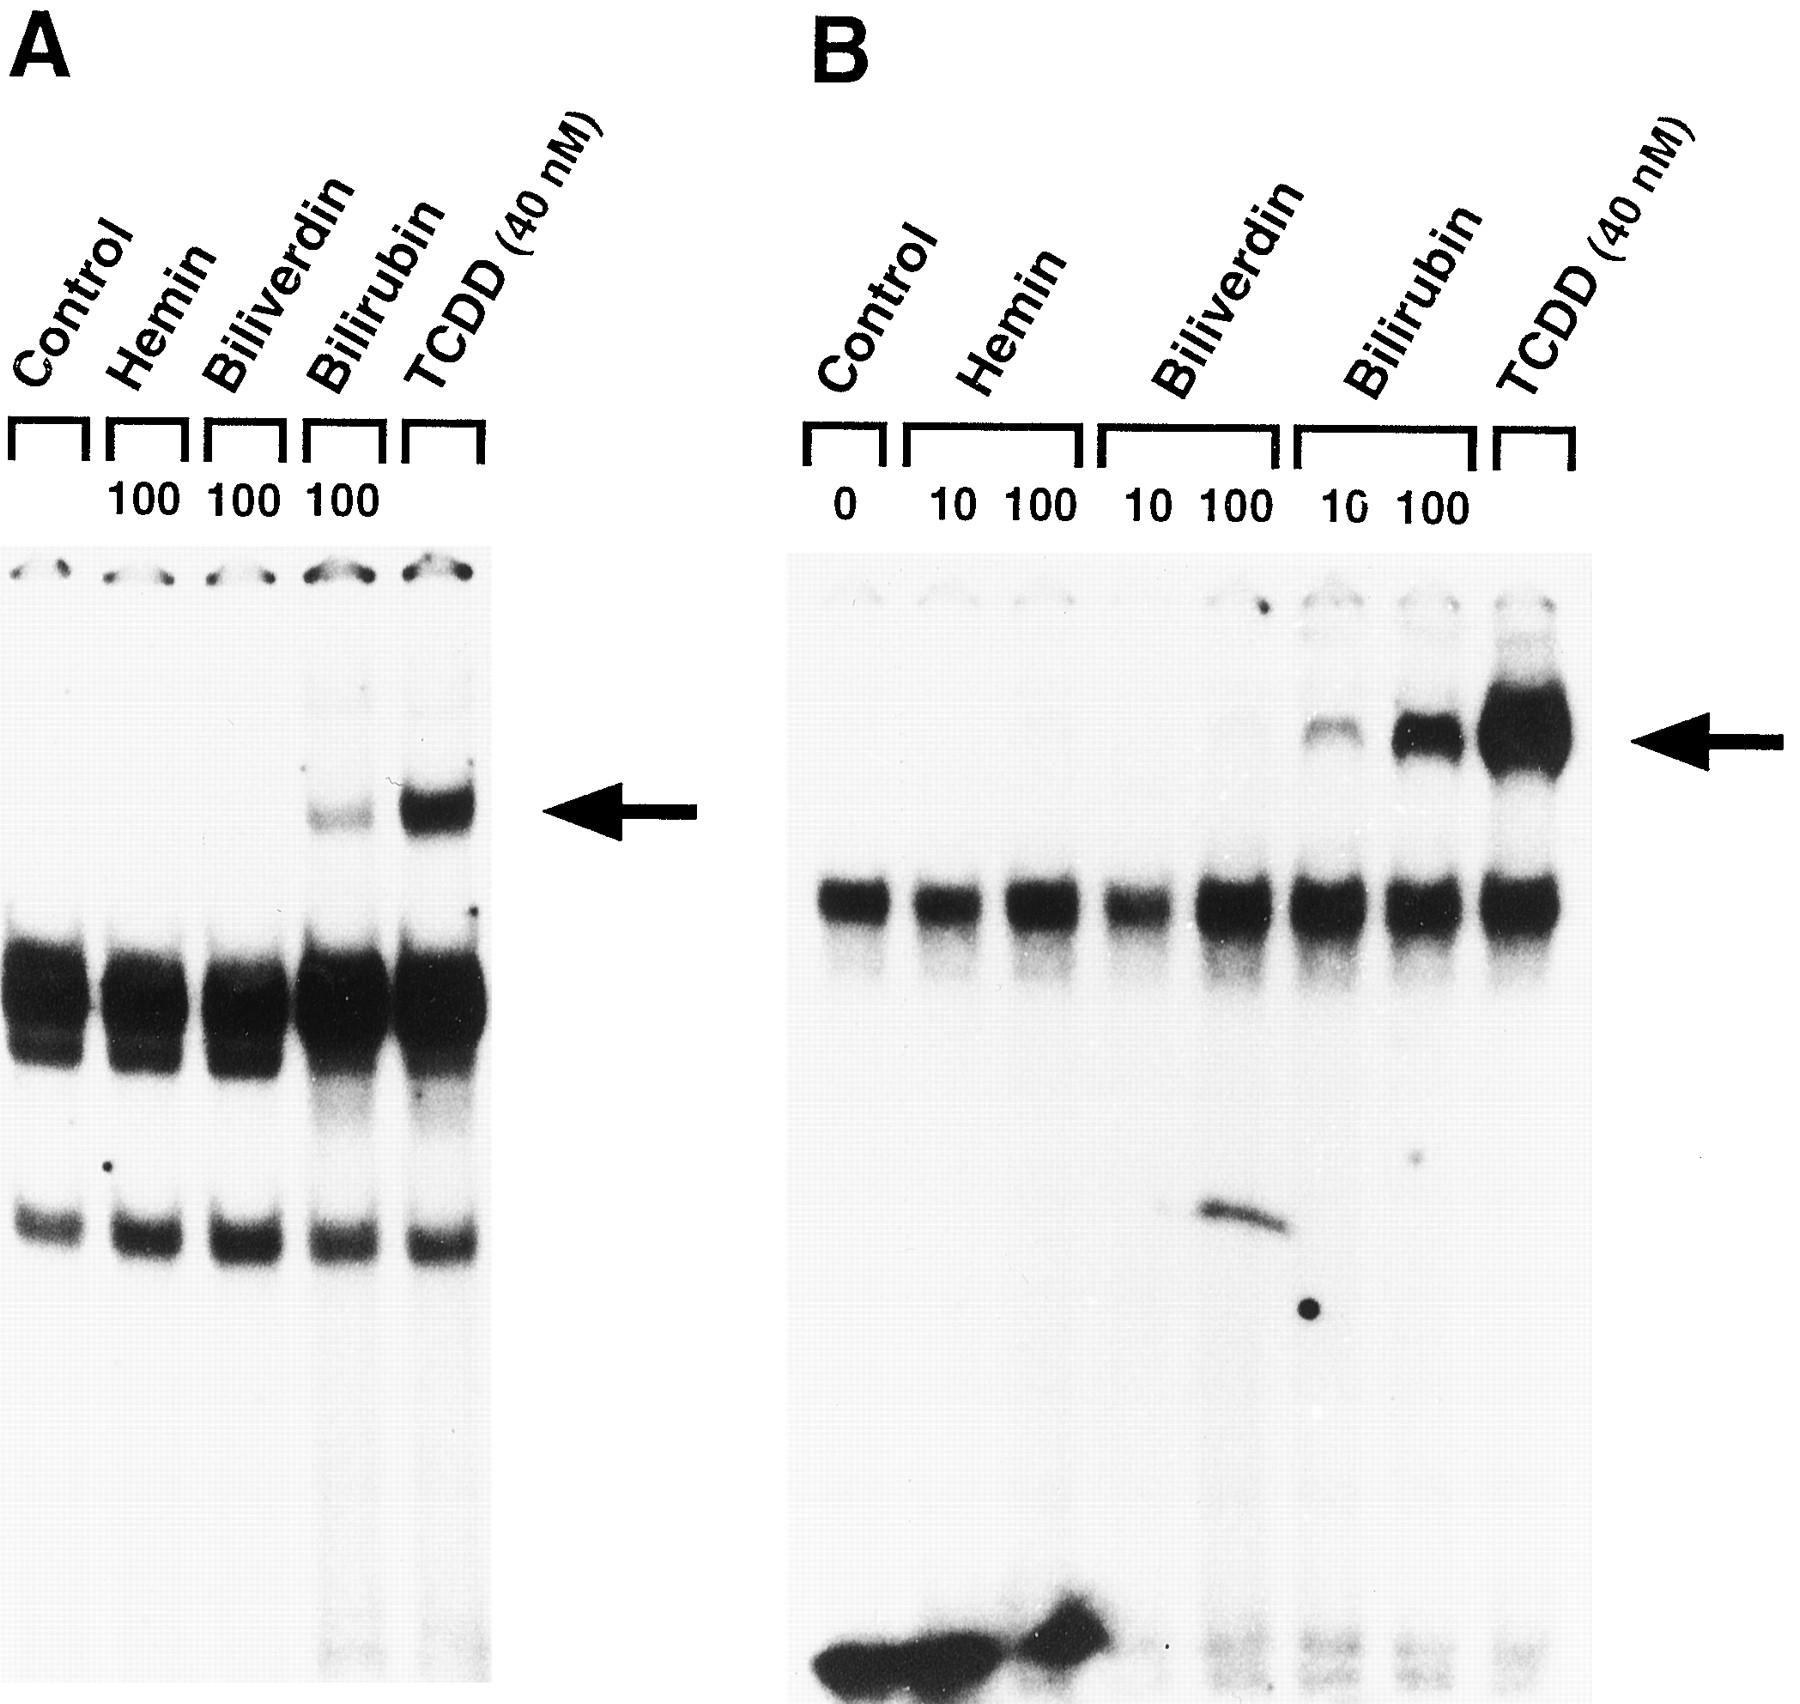
Formation of DRE-binding complexes from (A) Hepa 1c1c7 cell or (B) guinea pig hepatic cytosol after in vitro transformation with bilirubin. Untreated (Control) or hemin-, biliverdin-, or bilirubin-treated cytosol was mixed with a 32P-labeled DRE oligonucleotide, and the formation of protein/DNA complexes was analyzed by gel retardation as described in Experimental Procedures. Cytosol treatedin vitro with 40 nm TCDD was used as a positive control for AHR transformation. Numbers, concentration (μm) of test compound.Arrows, positions of the ligand-inducible protein/DNA complexes.

DNA sequence specificity for the binding of transformed bilirubin/AHR DRE-binding complexes. After 2-hr treatment with 100 μm bilirubin, transformed hepatic cytosol was incubated an additional 15 min with 5-, 15-, or 50-fold excess of unlabeled wild-type or mutant DRE oligonucleotide. Then, the samples were mixed with a 32P-labeled wild-type DRE oligonucleotide, and the formation of protein/DNA complexes was analyzed by gel retardation as described in Experimental Procedures.Arrow, position of the ligand-inducible protein/DNA complex.
Heme metabolism by Hepa 1c1c7 cells.
To determine whether Hepa 1c1c7 cells are capable of heme metabolism, cell lysates were incubated, in the presence of NADPH, with hemin or biliverdin as a substrate. As shown in Table 1, Hepa cells exhibited a constitutive level of HO activity that was induced ∼4-fold 6 hr after treatment of the cells with 100 μmhemin. This was consistent with the increase in HO-1 mRNA observed after hemin treatment (Fig. 1). Hepa cells also expressed constitutive biliverdin reductase activity that was unaffected by hemin treatment (Table 1); however, the rate of biliverdin metabolism in Hepa cell lysates was much greater than that for basal or induced HO activity, indicating that the latter represents the rate-limiting step in heme metabolism to bilirubin.
HO and biliverdin reductase activity of Hepa 1c1c7 cells
Discussion
In this study, we have shown that hemin and the endogenous heme metabolites biliverdin and bilirubin can modulate the expression of Cyp1a1 in Hepa 1c1c7 cells. Previous studies have indicated that endogenous heme may play a role in regulating transcription of a number of P450 genes. For example, it has been reported that induction of CYP1A1/1A2 and CYP2B1/2B2 mRNAs by 3-methylcholanthrene and phenobarbital, respectively, is inhibited by the simultaneous administration of heme biosynthesis blockers such as cobalt chloride (27-29). This inhibition was subsequently overcome by supplementation with low levels of exogenous hemin (27, 28). However, in these studies, heme was indicated to be a positive factor for induction of P450 gene transcription by prototypical inducers, not an inducer itself. In this sense, our data are not consistent with these previous studies in that we have demonstrated that hemin can increase Cyp1a1 mRNA and EROD activity in the absence of other inducers. However, this difference might be reconciled, in part, by assigning an indirect or a precursor role for hemin in Cyp1a1 induction.
The normal route for endogenous heme degradation consists of an initial NADPH- and P450 reductase-dependent oxidation of heme to biliverdin by microsomal HO (7). Subsequently, biliverdin is converted to bilirubin by the NADPH-dependent cytosolic enzyme biliverdin reductase (8). Our data clearly show that this metabolic pathway is active in Hepa 1c1c7 cells and is induced by treatment with hemin. For several reasons, our data suggest that bilirubin, produced by endogenous metabolism of hemin and biliverdin, is the ultimate inducer of Cyp1a1 mRNA and EROD activity. First, bilirubin was a more potent and effective inducer of Cyp1a1 mRNA and EROD activity in Hepa 1c1c7 cells than hemin or biliverdin. The lower efficacy of hemin and, to a lesser extent, biliverdin is consistent with their precursor roles in the biochemical pathway for bilirubin biosynthesis, as well of the relative rates of metabolism observed in Hepa 1c1c7 cell lysates. However, it is important to note that our data do not take into account the relative rate or extent of uptake of these compounds into the cells, a parameter that was not measured as part of this study. Second, the relative lag time for the onset of Cyp1a1 mRNA induction after treatment is greater for hemin than for biliverdin or bilirubin, which is consistent with a temporal requirement for the conversion of hemin to biliverdin by HO, the rate-limiting enzyme of heme degradation in Hepa 1c1c7 cells. The induction of HO-1 mRNA by hemin, but not biliverdin or bilirubin, is of potential relevance in this regard. Third, although experiments with the mutant cell lines indicated an AHR-dependent mechanism for Cyp1a1 induction by all of the compounds, only bilirubin caused ligand-dependent conversion of the AHR to its DNA binding form. The gel retardation assays showed that biliverdin and hemin lack this activity. Taken together, these data suggest that bilirubin, derived from the enzymatic degradation of hemin or biliverdin, is the ultimate inducer of Cyp1a1 mRNA and EROD activity.
The results of the gel retardation assay are direct and convincing evidence for an AHR mechanism for Cyp1a1 induction by bilirubin. Moreover, a number of our other results and comparisons with TCDD support this conclusion. Specifically, the lack of an increase in Cyp1a1 mRNA and EROD activity by bilirubin or TCDD in the ARNT-defective (C4) and AHR-defective (C12) mutant Hepa 1c1c7 cells provides additional proof that an intact AHR signal transduction mechanism is required. Induction of the DRE-luciferase reporter construct pGudLuc1.1 by bilirubin and TCDD in transiently transfected Hepa 1c1c7 cells also strongly implies AHR-dependent transcriptional activation. Inhibition of the Cyp1a1 mRNA increase in cells treated with the RNA synthesis inhibitor actinomycin D demonstrates a requirement for de novo mRNA synthesis, consistent with increased gene transcription mediated by the ligand-bound AHR complex. Finally, the inability of the protein synthesis inhibitor cycloheximide to abrogate increases of Cyp1a1 mRNA in response to bilirubin or TCDD indicates a lack of requirement for other highly labile transcription factors or de novo synthesis of another protein factor or factors required for induction. Surprisingly, cycloheximide did not seem to potentiate the increase in Cyp1a1 mRNA in response to bilirubin as has been reported for TCDD (30). Inhibition of bilirubin induction of EROD activity by cycloheximide indicates that de novoCyp1a1 apoprotein synthesis is required. Taken together, these data suggest that bilirubin induces Cyp1a1 gene transcription in an AHR-dependent fashion, in a manner highly similar but not identical to that for TCDD.
A number of other aspects of our data are also worth noting. First, the level of Cyp1a1 mRNA increase 3 hr after treatment with 100 μm bilirubin was higher than that observed for 1 nm TCDD. In contrast, induction of EROD and luciferase activities 24 hr after treatment with 100 μm bilirubin was usually only ∼25% of that observed for 1 nm TCDD. Initial dose-response experiments were carried out to verify that induction of EROD and luciferase reporter gene activity was maximal when Hepa 1c1c7 cells were treated with 1 nm TCDD (data not shown). It is possible that the discrepancy of TCDD-induced Cyp1a1 mRNA and EROD activity, when compared with 100 μm bilirubin, resulted from a relative lack of endogenous metabolism of TCDD. Thus, although initial levels of Cyp1a1 mRNA are greater with bilirubin, TCDD most likely caused a more sustained induction. The possibility of post-transcriptional effects on Cyp1a1 mRNA and/or protein by TCDD also cannot be definitively ruled out. Second, it is surprising that bilirubin produced such a large magnitude of Cyp1a1 mRNA increase yet did not seem to be nearly as effective as TCDD at transforming the AHR to its DNA binding form. One possible explanation is that additional factors and/or signaling pathways contribute to Cyp1a1 induction by bilirubin, although the lack of Cyp1a1 induction in the mutant Hepa 1c1c7 cell lines argues against this. Furthermore, the similar magnitude of DRE/luciferase reporter gene and EROD induction by 30 or 100 μm bilirubin also suggests that other factors are not involved. Further studies may help to explain this behavior. Finally, the magnitude of induction of luciferase reporter gene activity (2.5-fold) by 100 μm hemin was clearly lower than that observed for EROD activity (5.5-fold). This suggests that hemin itself may have specific transcriptional or post-transcriptional effects on Cyp1a1 independent of its conversion to the AHR ligand bilirubin. Possibilities that have been previously suggested include positive regulation of induced transcription elongation (27) and/or post-translational augmentation of P450 enzyme activity by an increase in free heme available for incorporation into P450 apoprotein (31).
The normal route for bilirubin excretion involves conjugation to bilirubin monoglucuronides and diglucuronides that are subsequently excreted in the bile (8). In humans with Crigler-Najjar syndrome and in the congenitally jaundiced Gunn rat, bilirubin conjugation is absent due to a mutation in the bilirubin UDP-GT gene (9). This results in a an accumulation of unconjugated bilirubin in the plasma. Bilirubin has been reported to have beneficial antioxidant effects (32); however, it is clear that severe neurotoxicity (kernicterus) can result from elevated bilirubin levels (8). Although UDP-GT mutants exhibit pronounced hyperbilirubinemia, the plasma levels of unconjugated bilirubin remain relatively constant, indicating a balance between formation and elimination. This indicates that alternate forms of bilirubin disposal exist and become important in the absence of conjugation. Administration of the CYP1A1 inducer TCDD to Gunn rats significantly decreases unconjugated bilirubin levels in the plasma (10), whereas phenobarbital, an inducer of different P450 isoforms, does not (33). A PAH-inducible bilirubin oxidase activity has been identified in hepatic microsomes prepared from Gunn rats or chick embryos (11, 12). This reaction requires NADPH and O2 and is inhibited by an antibody that recognizes both CYP1A1 and CYP1A2 (12). Taken together, these data suggest a role for CYP1A1 and/or CYP1A2 as an alternate route for bilirubin degradation. Regulation of P450 genes, especially CYP1A1, by their substrates is very common (3). Thus, if bilirubin is in fact a substrate for CYP1A1, it is not surprising that elevated levels of CYP1A1 mRNA and protein have been detected in the liver of Gunn rats (13, 14). Furthermore, pathobiological conditions, such as orthotopic liver transplantation (34) and acute sodium arsenite exposure (35), that increase plasma bilirubin levels have also been associated with an isozyme-selective increase in CYP1A1 expression in lung and kidney.
Plasma bilirubin concentrations in normal humans range from 5 to 20 μm (8). A portion of this bilirubin exists as water-soluble conjugates, but the majority is highly bound with serum albumin. Therefore, under normal physiological conditions, it is unlikely that bilirubin influences CYP1A1 expression to any significant degree. However, in the Gunn rat and in humans with Crigler-Najjar syndrome, in whom bilirubin conjugation and elimination are impaired, plasma levels of bilirubin can reach 50–350 μm and 300–800 μm, respectively (8). Bilirubin concentrations at this level clearly have the potential to substantially affect expression of CYP1A1 and possibly other AHR-regulated genes, as demonstrated by our experiments. It is important to note that our experiments were performed using immortalized cell lines, and as such, extrapolation to the in vivo situation must be done with caution. However, the faithful reproduction of hepatic basal and inducible Cyp1a1 expression by Hepa 1c1c7 cells in combination with the demonstration of bilirubin-inducible AHR transformation using cytosol prepared from guinea pig hepatic tissue suggests that these data may be relevant to regulation of Cyp1a1 by bilirubin in vivo.
The data presented here are consistent with previous studies that have demonstrated functional associations between Cyp1a1 and bilirubin disposal, as well as bilirubin and Cyp1a1 regulation. Furthermore, our data are the first to clearly demonstrate that bilirubin, an endogenous metabolite of heme, can directly regulate Cyp1a1 gene expression and enzymatic activity in an AHR-dependent manner. Also of importance is the demonstration that changes in levels of heme catabolites and, potentially, heme precursors may have significant effects on Cyp1a1 expression. DRE enhancer sequences and AHR-dependent gene regulation have been identified for other P450 genes, such asCYP1A2 (36) and CYP1B1 (37). In addition, a number of other enzymes, including some glutathione-S-transferase and glucuronyl transferase isoforms, as well as NADPH:quinone oxidoreductase, that are involved in chemical detoxication also exhibit AHR-dependent induction mechanisms (38-40). Thus, it is possible, and indeed likely, that heme metabolism is linked to the regulation of some of these genes.
Acknowledgments
The authors express their gratitude to Dr. Timothy Zacharewski and his colleagues for their contribution to this work. In particular, the technical assistance of Dr. Janine Clemons, Bradley Gillesby, and Dr. Zhi Fen Wu is greatly appreciated. The authors are also grateful to Dr. Oliver Hankinson for providing the wild-type and mutant Hepa 1c1c7 cell lines and Dr. Michael Denison for providing the DRE luciferase plasmid pGudLuc1.1.
Footnotes
- Received March 7, 1997.
- Accepted June 17, 1997.
-
Send reprint requests to: Dr. John R. Bend, Department of Pharmacology and Toxicology, University of Western Ontario, London, Ontario, Canada N6A 5C1. E-mail:jbend{at}julian.uwo.ca
-
This work was supported by Medical Research Council of Canada Grant MT9972 (J.R.B.). C.J.S is the recipient of an Ontario Graduate Scholarship.
-
1 In accordance with standard convention (1), Cyp1a1 is used throughout this report in reference to the mouse isoform only. The same isoform is referred to as CYP1A1 in all other species.
Abbreviations
- P450
- cytochrome P450
- AHR
- aryl hydrocarbon receptor
- ARNT
- aryl hydrocarbon receptor nuclear translocator
- PAH
- polycyclic aromatic hydrocarbon
- DRE
- dioxin-response element
- ERF
- 7-ethoxyresorufin
- EROD
- 7-ethoxyresorufin-O-deethylase
- HEPES
- 4-(2-hydroxyethyl)-1-piperazineethanesulfonic acid
- GAPDH
- glyceraldehyde-6-phosphate dehydrogenase
- HPLC
- high performance liquid chromatography
- HO
- heme oxygenase
- PBS
- phosphate-buffered saline
- PCR
- polymerase chain reaction
- SDS
- sodium dodecyl sulfate
- TCDD
- 2,3,7,8-tetrachlorodibenzo-p-dioxin
- UDP-GT
- UDP-glucuronosyltransferase
- SSPE
- standard saline/phosphate/EDTA
- The American Society for Pharmacology and Experimental Therapeutics


