

Abstract
The pilocarpine model of temporal lobe epilepsy was used to study the time-dependent changes in dentate gyrus circuitry after seizures. Seizures caused a decrease in μ- and δ-opioid receptor immunoreactive (MOR-IR and DOR-IR, respectively) neurons in the hilus and MOR-IR neurons in the granule cell layer. Additionally, diffuse DOR-IR, MOR-IR, and GABA immunoreactivities (GABA-IR) were increased in the inner molecular layer. Using the in vitrohippocampal slice preparation to study the physiological consequences of the anatomical changes, we found that the disinhibitory effects of the μ-opioid receptor agonist [D-Ala2,MePhe4,Gly-(ol)5]-enkephalin (DAMGO) and the GABAA receptor antagonist bicuculline were greatly depressed 5–13 d after pilocarpine injection but returned to control levels within 6 weeks. The amplitudes of monosynaptic evoked IPSCs and the effects of DAMGO on this parameter were also slightly decreased 5–13 d after pilocarpine injection but significantly increased at 6 weeks. DAMGO significantly decreased the mean amplitude of spontaneous IPSCs (sIPSCs) at 6 weeks after pilocarpine injection but not in controls. The δ-opioid receptor agonist [d-Pen2,5]-enkephalin (DPDPE) principally inhibited excitatory transmission in saline-treated animals without affecting either sIPSCs or evoked IPSCs. The DPDPE-induced inhibition of excitatory transmission became more pronounced at 6 weeks after pilocarpine injection. These results illustrate the anatomical reorganization and functional changes in dentate gyrus circuitry evident in an animal model of temporal lobe epilepsy and provide evidence of compensatory changes after trauma to the hippocampal formation.
- dentate gyrus
- epilepsy
- GABA
- hippocampus
- mossy fiber sprouting
- neurotoxicity
- synaptic inhibition
- opiate physiology
Temporal lobe epilepsy is one of the most common forms of epilepsy. The pathology associated with this disease is well documented in humans and can be replicated in animal models. Pilocarpine treatment produces a model of temporal lobe epilepsy in which animals exhibit recurrent spontaneous seizures, typical hippocampal sclerosis, and mossy fiber sprouting (see Mello et al., 1992, 1993). Pilocarpine-induced seizures also decrease the number of GABAergic neurons in the hilus, while sparing the GABAergic neurons in the granule cell layer and inner molecular layer (Obenaus et al., 1993). Because μ- and δ-opioid receptors modulate the release of GABA in the hippocampus (see Nicoll et al., 1980; Cohen et al., 1992) and hyperpolarize physiologically identified GABAergic interneurons (Madison and Nicoll, 1988; Pang and Rose, 1989), we investigated changes in both the anatomical distribution and physiological effects of μ- and δ-opioid receptors caused by pilocarpine-induced temporal lobe epilepsy.
The goal of this study was twofold. The first was to provide insight into seizure-induced changes in GABAergic circuitry by investigating changes in GABAergic neurons that express opioid receptors. GABAergic neurons in the dentate gyrus are not homogeneous but are made up of neurochemically distinct subpopulations (Kohler, 1983; Kosaka et al., 1985, 1987, 1988; Leranth and Frotscher, 1986; Katsumaru, 1988). Opioid receptor-expressing neurons are likely to form one such subpopulation. The time course of changes also was documented to resolve apparent discrepancies regarding seizure-induced changes in GABAergic transmission in the dentate gyrus (Tuff et al., 1983a; King et al., 1985; Tauck and Nadler, 1985; deJonge and Racine, 1987; Maru and Goddard, 1987; Sloviter, 1991; Kamphuis et al., 1992; Zhao and Leung, 1992; Mangan et al., 1995). The second goal was to provide insight into the actions of opioid receptors in the dentate gyrus by using well-documented seizure-induced changes in dentate gyrus circuitry. Endogenous opioid peptides play an important role in the modulation of excitability in the normal and epileptic brain (for review, seeTortella, 1988; Hong et al., 1993; Simmons and Chavkin, 1996). Although there are numerous reports regarding seizure-induced changes in δ opioid peptides (Hong et al., 1980; Iadarola et al., 1986; Kanamatsu et al., 1986; McGinty et al., 1986), few studies (Crain et al., 1987) have focused on changes in hippocampal opioid receptors.
Previously characterized antibodies generated against the μ- and δ-opioid receptors (Bausch et al., 1995a,b) were used to define anatomical changes in opioid receptor distribution. Anti-GABA antisera were used to further define anatomical changes in GABA distribution. Extracellular recording of granule cell population spikes and whole-cell voltage-clamp recording of sIPSCs and monosynaptic evoked IPSCs in granule cells were used to investigate changes in GABAergic transmission and in the physiological actions of opioids. Results from this study demonstrate clear changes in opioid receptor distribution and functional effects of opioids in the dentate gyrus of the epileptic animal.
MATERIALS AND METHODS
Pilocarpine injections. Adult male Sprague Dawley rats (110–150 gm) were injected with pilocarpine to induce chronic epilepsy (Turski et al., 1983). Rats were injected with methylscopolamine nitrate (1 mg/kg in saline, i.p.) 30 min before pilocarpine injection to minimize the peripheral effects of pilocarpine (Baez et al., 1976; Turski et al., 1983). Animals were then injected with pilocarpine hydrochloride (375 mg/kg in saline, i.p.). Control animals also received methylscopolamine but were injected with saline instead of pilocarpine. Animals were observed for 6–8 hr after injection with pilocarpine; only animals that exhibited at least 1 hr of sustained status epilepticus (SE) were included in this study. To reduce the mortality rate of the procedure, rats were administered diazepam (4 mg/kg, i.p.) after 1 hr of SE, and every 2 hr thereafter as necessary to control seizures (Mello et al., 1993). In some experiments, additional controls included (1) pilocarpine-injected animals that did not exhibit seizures, (2) saline-injected control animals that also received diazepam, and (3) animals pretreated with 4 mg/kg diazepam (i.p.) 30 min before pilocarpine injection to block seizures (Turski et al., 1989). All animals that received pilocarpine were given rat chow soaked in Gatorade and sucrose for 2 d after injection.
Histology. Rats were anesthetized with pentobarbital and decapitated; brains were removed and placed in ice-cold normal Krebs–bicarbonate buffer [normal artificial CSF (ACSF)] containing (in mm): NaCl 124, KCl 4.9, KH2PO41.2, MgSO4 2.4, CaCl2 2.5, glucose 10, and NaHCO3 25.6 and equilibrated with 95% O2/5% CO2. Brains were then blocked and immersion-fixed for 1 hr in 0.1% sodium sulfide followed by 2% paraformaldehyde in 0.1m phosphate buffer (PB), pH 7.4, containing 30% sucrose. Alternatively, 500 μm hippocampal slices were similarly treated after electrophysiological recording. Brains or hippocampal slices were cut into 40 μm transverse sections using a freezing sliding microtome, and sections were placed into 0.1 m PB and mounted onto glass slides. Mounted sections were then stained with cresyl violet or with neo-Timm stain (Holm and Geneser, 1991). Alternate sections from animals processed for immunocytochemistry were also stained with cresyl violet. Briefly, for the neo-Timm stain, sections were post-fixed through 95%, 70%, and 50% ethanol, rehydrated in distilled water for 20–30 min, then dipped in 0.5% gelatin and allowed to dry overnight. Slides were developed in a solution of 0.11% silver lactate, 0.85% hydroquinone, 30% gum arabic colloid (all w/v) in 0.2 mcitrate buffer for 1–1.5 hr and then rinsed, counterstained with neutral red, dehydrated, cleared, and coverslipped. Images were collected using a Leitz Dialux 20 microscope (for Fig. 1) or a Nikon Diaphot microscope with Image 1 software for analysis of cresyl violet-stained sections, as described below.

Hilar cell loss and mossy fiber sprouting were seen after pilocarpine-induced seizures. Transverse sections from saline- (A, C) and pilocarpine- (B, D) treated rats were stained with either cresyl violet (A, B) or neo-Timm stain (C, D), as described in Materials and Methods. At 5 d to 6 weeks after injection, there was a marked decrease in the number of neurons in the hilus of pilocarpine (B) compared with saline-injected (A) rats. In the same animals, there was a pronounced increase in mossy fibers seen by neo-Timm staining in the inner molecular layer of animals injected with pilocarpine (D) compared with saline (C). All sections shown are from animals killed 6 weeks after injection. g, Granule cell layer;h, hilus; m, molecular layer. Scale bars (shown in A, C), 250 μm.
Immunocytochemistry. Rats were deeply anesthetized with pentobarbital and perfused intracardially with 2% paraformaldehyde in 0.1 m PB containing 0.1% glutaraldehyde for 15 min. Brains were removed from the skull, post-fixed for 2 hr, and cryoprotected by sinking in 30% sucrose in 0.1 m PB. Brains were then cut into 40 μm transverse sections using a freezing sliding microtome and sections placed into 0.1 m PB. Sections were processed for immunocytochemistry, as described previously (Bausch et al., 1995b), using the biotin amplification procedure (Adams, 1992; Lee et al., 1993) All steps were performed at room temperature unless otherwise stated. Slices were pretreated with 1% sodium borohydride in 0.1m PB for 1 hr, 0.1 m PB for 30 min, 70% ethanol for 5 min, 0.3% H2O2 in 100% methanol for 10 min, 70% ethanol for 5 min, followed by 0.1 m TB (Tris–HCl, pH 7.4) for 5 min and 0.1 m TBS (TB containing 0.15 m NaCl and 2.7 mm KCl, pH 7.4) for 15 min. Sections were then pretreated with 1% avidin D in TBS for 20 min, TBS for 10 min, 1% biotin in TBS for 20 min, and TBS for 15 min. Finally, slices were pretreated in a blocking buffer consisting of TBS with 2% gelatin and 10% normal goat serum for 1 hr at 37°C. Sections were then incubated with an affinity-purified anti-peptide antibody generated against the δ-opioid receptor (DT-1, rabbit 8663) or μ-opioid receptor (MT-2, rabbit 2148) or with antisera against GABA or glial fibrillary acidic protein (GFAP) for 1 hr at room temperature followed by 36 hr at 4°C. All antibodies were diluted in TBS containing 0.1% BSA, 10% normal goat serum, and 0.1% Triton X-100. Sections were then processed as follows: rinsed with TBS containing 0.1% Triton X-100 for 1 hr; incubated in biotinylated goat anti-rabbit IgG diluted 1:5000 in diluent for 1 hr; rinsed with TBS containing 0.1% Triton X-100 for 1 hr; incubated in 0.225% ABC elite in TBS containing 0.4% Triton X-100 for 30 min; rinsed in TBS for 40 min; incubated in 0.1% biotinyltyramide and 0.005% H2O2 in TBS for 20 min; rinsed in TBS for 40 min; incubated in 0.1125% ABC elite in TBS containing 0.4% Triton X-100 for 1 hr at 37°C; rinsed in TBS for 40 min; 0.175 msodium acetate for 15 min; treated with 0.005% 3,3′-diaminobenzidine (DAB), 0.625% NiSO4, and 0.00062% H2O2 in 0.175 m sodium acetate for 11 min; and rinsed in 0.175 m sodium acetate for 15 min and TBS for 15 min. Slices were mounted onto glass slides, dehydrated, cleared in xylenes, and coverslipped. Images were collected using a Leitz Dialux 20 microscope (for Figs. 2, 3, 4) or with the transmission mode on BioRad MRC 600 confocal microscope with COMOS 6.01 software, as described below for quantitative analysis.

MOR-IR neurons were decreased in the hilus and granule cell layer of pilocarpine-treated compared with saline-treated rats. Transverse rat brain sections were stained with affinity-purified MT-2 (#2148) using the biotin amplification procedure, as described in Materials and Methods. Stained sections of the dentate gyrus show decreases in MOR-IR neurons in the hilus and the granule cell layer of pilocarpine- (B) compared with saline- (A) treated rats. Sections shown are from rats killed 19 d after injection. Compiled data illustrate decreases in (C) MOR-IR structures >10 × 10 μm and (D) MOR-IR somata in the hilus and granule cell layer of pilocarpine- compared with saline-treated rats. MOR-IR structures and MOR-IR somata localized in the subgranular region were included in the granule cell layer (see Materials and Methods). Data were compiled from 5 to 7 animals at each survival time in each treatment group. Data from different times were averaged, because there was no significant difference over time for either the saline or pilocarpine treatment group and no interaction between time and drug treatment. *Significant difference from saline-injected control rats (two- by three-way ANOVA, *p < 0.05; **p < 0.01).g, Granule cell layer; h, hilus;m, molecular layer. Scale bars (shown inA): A, B, 250 μm.
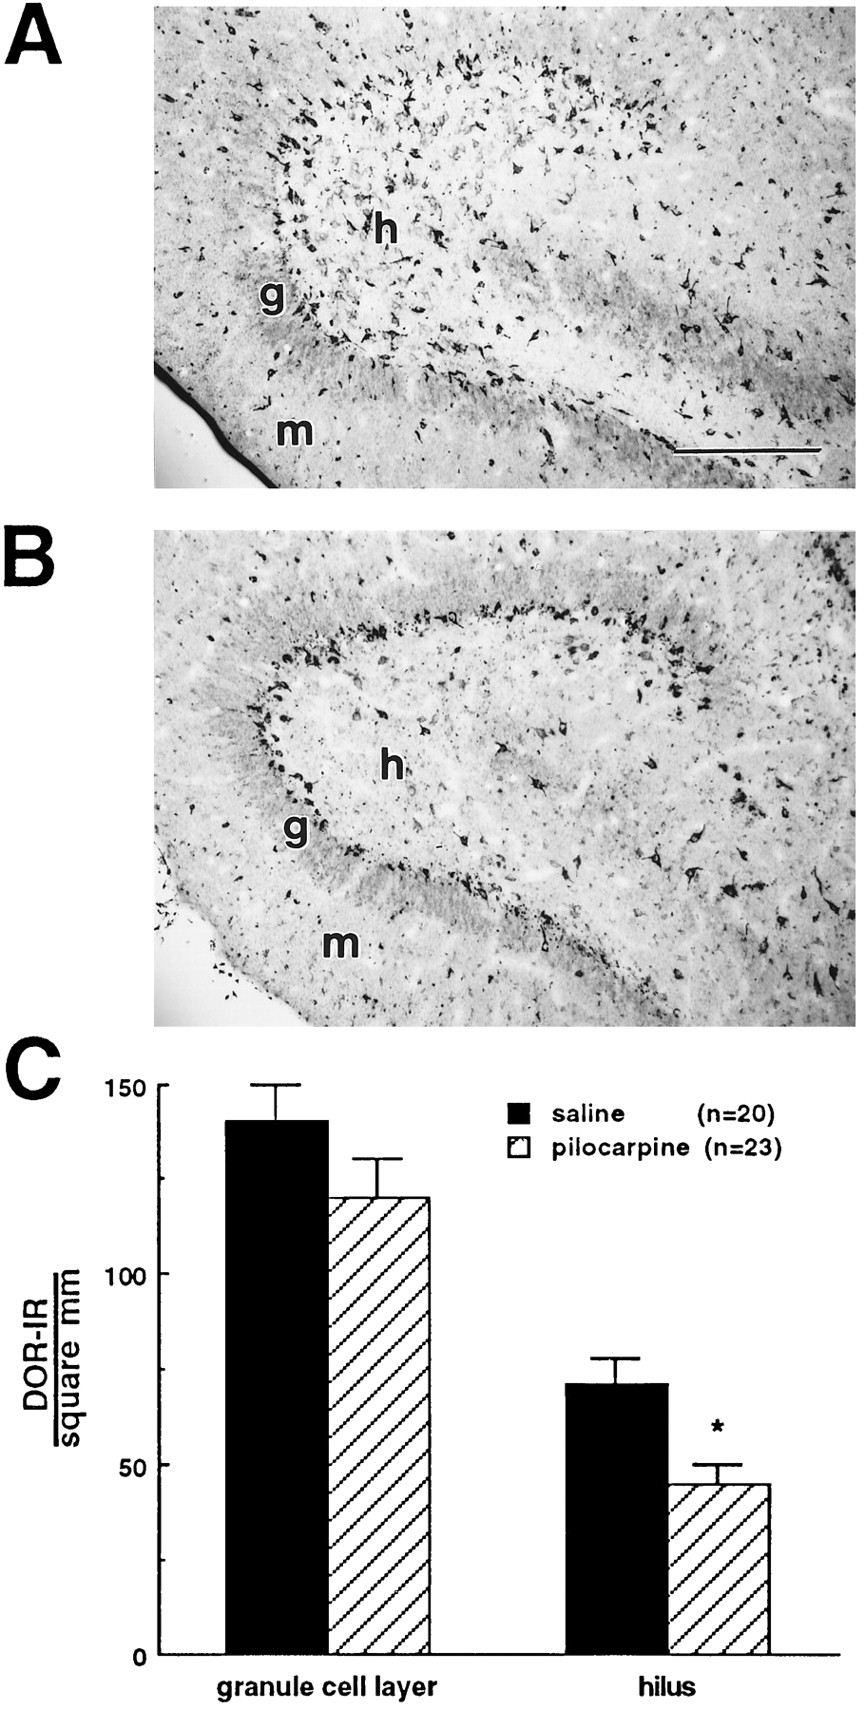
DOR-IR neurons were decreased in the hilus of pilocarpine- compared with saline-treated rats. Transverse rat brain sections were stained with affinity-purified DT-1 (#8663) using the biotin amplification procedure, as described in Materials and Methods. Stained sections of the dentate gyrus show a decrease in DOR-IR neurons in the hilus but not in the granule cell layer of pilocarpine- (B) compared with saline- (A) treated rats. Sections shown are from rats killed 14 d after injection. (C) Compiled data illustrate a decrease in DOR-IR structures in the hilus of pilocarpine- compared with saline-treated rats. Data were compiled from 6 to 9 animals at each survival time in each treatment group. Data from different survival times were averaged, because there was no significant difference over time for either the saline or pilocarpine treatment group and no interaction between time and drug treatment. *Significant difference from saline-injected controls (two- by three-way ANOVA, p < 0.05).g, Granule cell layer; h, hilus;m, molecular layer. Scale bars (shown inA): A, B, 250 μm.

Diffuse MOR-IR, GABA-IR, and DOR-IR were increased in the inner molecular layer of pilocarpine- compared with saline-treated rats. Transverse rat brain sections were stained with affinity-purified MT-2 (#2148) (A,B), anti-GABA antisera (C,D), or affinity-purified DT-1 (#8663) (E, F), using the biotin amplification procedure, as described in Materials and Methods. Immunoreactivity for all three antibodies was increased in the inner molecular layer of sections from pilocarpine- (B,D, F) compared with saline- (A, C, E) treated rats. Sections shown are from rats killed 8–9 d after injection. Sections from control and pilocarpine-treated animals were stained in parallel. All high-magnification photographs were taken from the upper blade near the open end of the granule cell layer. Arrowheads mark the edge of increased labeling. g, Granule cell layer;h, hilus; m, molecular layer. Scale bars (shown in A): A–F, 100 μm.
Histological and immunocytochemical data analysis. Sections for analysis were taken from horizontal stereotaxic coordinates −7.10 from bregma, interaural 2.90 from bregma −4.74, interaural 5.26 according to the atlas of Paxinos and Watson (1986). This region corresponds to approximately the middle two-quarters of the hippocampus and was chosen to enable correlation of anatomical with electrophysiological data. One well-stained section of the appropriate coordinates was chosen randomly from each animal for detailed analysis. Images for quantitative analysis were collected using a Nikon Diaphot microscope with Image 1 software for the cresyl violet-stained sections and the transmission mode on a BioRad MRC 600 confocal microscope (pinhole completely open) with COMOS 6.01 software for the immunocytochemically stained sections. Images for quantitative analysis were assigned coded numbers to permit a blind analysis and imported into Metamorph Image analysis program. Regions were drawn around the granule cell layer and/or hilus. The granule cell layer was defined as the compact layer of granule cells and any cell that fell on the line between the granule cell layer and the hilus (subgranular region). The hilus was defined as the region between the two blades of the granule cell layer and was delimited at the open end by a straight line drawn between the two blades of the granule cell layer, excluding the CA3c pyramidal cell layer. The area of each region was determined using the analysis program (calibrated with a square stage micrometer). Large blood vessels were excluded from area measurements. Cresyl violet-stained cells were counted manually by one investigator, and immunoreactive structures were counted manually by two investigators, using the analysis program. Counts from the two investigators were averaged; the mean of the averages for each experimental group was within one SD from each investigator’s mean. Cresyl violet-stained cells and μ-opioid receptor immunoreactive (MOR-IR) somata were counted if the nucleus was seen in the section. MOR-IR structures were counted if the size of the immunoreactive structure was >10 × 10 μm. δ-Opioid receptor immunoreactive (DOR-IR) images were set to the same threshold, and DOR-IR structures were counted if the size of the immunoreactive structure was >15 × 15 μm.
Changes in inner molecular layer staining and mossy fiber sprouting were scored subjectively by viewing mounted sections using a Leitz Dialux 20 microscope. Slides were assigned coded numbers to permit a blind analysis. Inner molecular layer changes were scored subjectively by comparing the intensity of staining in the inner compared with the outer molecular layer in four to six sections per animal. Scores reflecting an increase in inner molecular layer staining were given if the inner molecular layer was more intensely stained than the outer molecular layer in at least half of the sections. The outer molecular layer was used as an internal standard to control for variability in background staining between experiments. Mossy fiber sprouting was scored using the method of Tauck and Nadler (1985). Briefly, supragranular Timm staining was scored as 0, occasional or no staining; 1, scattered staining in all supragranular regions; 2, patches of heavy staining or continuous light staining; and 3, dense continuous band.
Electrophysiology. Electrophysiological experiments were performed using the in vitro hippocampal slice preparation (Dingledine et al., 1980). Rats were calmed with halothane, anesthetized with pentobarbital, and decapitated; brains removed immediately and placed in ice-cold buffer. The brain was blocked and attached to a wax block using cyanoacrylate glue, and 500 μm transverse slices were cut using a Campden vibratome. Slices from horizontal stereotaxic coordinates −7.34 from bregma, interaural 2.66 from bregma −4.60, interaural 5.40 according to the atlas of Paxinos and Watson (1986) were placed in a temperature-controlled (34°C) submerged tissue chamber and continuously superfused with normal ACSF or with high Mg2+, high Ca2+ ACSF containing (in (mm): NaCl 125, KCl 3, NaH2PO41.24, MgCl2 4, CaCl2 4, glucose 10, and NaHCO3 25.6, and equilibrated with 95% O2/5% CO2. Slices were allowed to equilibrate for at least 1 hr before recording. All drugs were diluted in ACSF just before use and applied by bath superfusion. Opioid receptor-mediated effects were defined as the DAMGO or DPDPE effects that were reversible by 1 μm naloxone (for DAMGO and DPDPE) or by 100 nm–1 μm naltrindole (for DPDPE). These concentrations of naltrindole did not block DAMGO-induced effects (data not shown). To permit multiple applications of agonist to the same slice, washout of drug for at least 50 min was used to define drug effects in some experiments. Drug effects are represented as (% controlagonist minus % controlreversal), and data were excluded from analysis if >10% difference was attributable to consistent rundown or (occasionally) runup of currents or population spike amplitudes. This exclusion was used primarily in experiments in which no drug effects were seen.
Dentate granule cell population spikes were evoked by stimulation (0.3 msec square pulse, 0.03 Hz, 30–300 μA) of the perforant path in the outer molecular layer and recorded in granule cell layer (seeinset Fig. 5A). Voltage-clamp recordings from dentate granule cells were obtained using the “blind” technique (Blanton et al., 1989). Monosynaptic IPSCs were evoked by stimulation (0.3 msec square pulse, 0.1 Hz) at intensities 20 μA below the stimulus intensity required to elicit a maximal response with a single peak (25–100 μA). Concentric bipolar electrodes (SNE 100, Rhodes Medical Supply) were used for stimulation in all experiments. Glass recording microelectrodes were pulled on a Flaming Brown micropipette puller and filled with 3 m NaCl for extracellular recording (3–4 μm outer tip diameter) or with the following solution (in mm): CsF 40, N-methyl-d-glucamine 100, methanesulfonic acid 100, MgCl2 1, HEPES 10, lidocaineN-ethyl bromide (QX-314) 2, and adenosine 5′-triphosphate 5, pH 7.2 with CsOH, (modified from Lambert and Wilson, 1993) for voltage-clamp recording (2–3 μm outer tip diameter). CsF and QX-314 were included in the intracellular solution to block putative postsynaptic effects of opioids. Because opioid receptor effects are mediated through G-protein activation (Childers, 1988), previous activation of G-proteins with fluoride (Rall and Sutherland, 1958) would block opioid receptor effects. Cesium and QX-314 block both postsynaptic opioid effects on potassium channels (Mulle et al., 1985;Andrade, 1991; Hwa and Avoli, 1991; Nunoz and Buno, 1992; Alreja and Aghajanian, 1994) and the GABAB response (Nathan et al., 1990). All data were collected using an Axopatch 200 amplifier (2 kHz analog filter).

Time-dependent changes were seen in the effects of the μ-opioid receptor agonist DAMGO and the GABAAreceptor antagonist bicuculline on dentate granule cell population spikes in pilocarpine-, compared with saline-treated, rats. Population spikes were recorded in normal ACSF, as described in Material and Methods. A, A representative stimulus response curve shows the increase in primary population spike amplitude caused by DAMGO (1 μm) or bicuculline (10 μm). (Rat killed 6 weeks after pilocarpine injection.) Inset shows placement of the stimulating (solid rectangle) and recording (open triangle) electrodes. B, Traces from a representative experiment illustrate the generation of a secondary population spike by DAMGO and bicuculline at a 300 μA stimulus. (Rat killed 14 d after saline injection.) Compiled data show time-dependent changes in the DAMGO-induced (1 μm) (C) and bicuculline-induced (10 μm) (E) increases in primary population spike amplitude evoked by a 300 μA stimulus, after pilocarpine-induced seizures. Compiled data show no changes in the DAMGO-induced (D) or bicuculline-induced (F) secondary population spike in the pilocarpine- compared with saline-injected rats. The amplitude of the secondary population spike was expressed as a percentage of the control primary population spike amplitude, both measured after a 300 μA stimulus. When a secondary population spike was observed in control recordings, only the drug-induced changes in the secondary population spike were included in the analysis. Opioid receptor-mediated effects were defined as the DAMGO effects that were reversible by 1 μm naloxone. Asterisk indicates a significant difference from saline-injected controls and 6 weeks after pilocarpine injection (one-way ANOVA, LSD post hoc comparison; p < 0.05).
Only neurons with a resting membrane potential more negative than −50 mV (as determined in current clamp immediately after establishing whole-cell configuration) were used for voltage-clamp recording. Cells were allowed to stabilize for at least 20 min after establishing whole-cell configuration. Granule cells were held at −70 mV, except where otherwise stated. Series resistance was monitored continuously throughout voltage clamp experiments. Recordings were excluded from analysis if the series resistance was >10 MΩ or varied by >20% for the duration of the experiment. All voltage-clamp recordings were done in the presence of 50 μm APV and 10 μm CNQX to block excitatory amino acid transmission. Voltage-clamp data were collected and analyzed using pCLAMP software. Monosynaptic IPSCs were collected as the average of three consecutive stimulations, and amplitudes were measured from the holding current baseline to the peak of the evoked current. sIPSC data were collected as one to two runs of 30.72 sec duration per run, baseline-subtracted, digitally filtered with a 106 Hz cutoff and 5 msec width, and analyzed off-line using Axograph software. Digital filtering slightly decreased the final sIPSC amplitudes but dramatically decreased noise. Events were counted if the peak amplitude was >15 pA to avoid counting false events attributable to detection of noise. Analyzed data were averaged in experiments in which two runs of data were collected.
Population spikes recorded in normal ACSF were chosen by the following criteria: maximum population spike amplitude ≥ 0.30 mV (range, 0.32–2.30 mV), stimulus threshold for generation of a population spike ≤ 100 μA (range, 30–100 μA), and minimum secondary population spikes under control conditions. Amplitudes of all primary and secondary population spikes were measured from the peak negativity to the next positive peak. When a secondary population spike was present in the control recording (n = 13), only drug-induced changes in the secondary population spike were included in the analysis. Population spikes recorded in high Mg2+, high Ca2+ ACSF could be evoked only in the presence of bicuculline and were chosen by the following criteria: maximum population spike amplitude ≥ 0.50 mV (range, 0.55–1.96 mV) and stimulus threshold for generation of a population spike ≤ 100 μA (range, 50–90 μA).
Statistical analysis. Numbers and bars represent the mean ± SEM in the stated number of animals, except where otherwise stated. All statistical analysis was performed with Statistica software. Data fitting a nonparametric distribution were tested for significance using the Kruskal–Wallis ANOVA by ranks test. Data fitting a normal parametric distribution were tested for significance using either a two- by three-way ANOVA (anatomical data) or one-way ANOVA, LSD post hoc comparison (electrophysiological data). In one situation, a Student’st test was used to test for significance because of the large variability in the accompanying groups. The hypothesis for this variability is presented in the text. Confidence intervals were used to test for significance from zero. There was no significant difference over time in all situations in which age-matched saline-injected controls were compiled as a single group.
Materials. Male Sprague Dawley rats (100–125 gm) were obtained from Bantin and Kingman (Belleview, WA); pilocarpine hydrochloride, (−)-scopolamine methyl nitrate, 3,3′-diaminobenzidine tetrahydrochloride, naloxone hydrochloride, (−)-bicuculline methiodide, and adenosine 5′-triphosphate (magnesium salt) were obtained from Sigma (St. Louis, MO); rabbit anti-GABA and rabbit anti-GFAP antisera from Incstar; avidin D/biotin block, normal goat serum, biotinylated goat anti-rabbit IgG, ABC Elite kit, and Vectashield mounting media from Vector (Burlingame, CA); biotinyl tyramide from DuPont NEN (Boston, MA). DAMGO and DPDPE were purchased from Peninsula Laboratories; APV, CNQX, QX-314, and naltrindole hydrochloride from Research Biochemicals International (Natick, MA).
RESULTS
Anatomical changes in the distribution of μ- and δ-opioid receptors and GABA
General histological changes
The pilocarpine model of temporal lobe epilepsy is a well-established model for complex partial epilepsy in which rats exhibit recurrent spontaneous seizures and present pathology typical of seizure-induced hippocampal sclerosis. This pathology includes hilar cell loss and sprouting of the granule cell axons (mossy fibers) into the inner molecular layer (see Mello et al., 1992). The pilocarpine injection protocol used in this study caused moderate pathological changes in the hippocampus without widespread brain damage in most animals. Although animals were not continuously monitored, rats that displayed at least 1 hr of sustained SE were frequently observed to have recurrent seizures. Recurrent seizures occurred as early as 16 hr after initial recovery from pilocarpine injection, and recurrent seizures were seen throughout the 5 d to 6 week survival period. Brain sections from rats killed 5 d to 6 weeks after saline or pilocarpine injection were processed histologically to document pathological changes.
Within the dentate gyrus, cresyl violet staining (Fig.1) showed a significant (two by three-way ANOVA,p < 0.01) decrease (42%) in the number of hilar neurons in pilocarpine-treated (578 ± 29 neurons/mm2;n = 44) compared with saline injected (1001 ± 34 neurons/mm2; n = 31) animals. Sections from the subset of these animals that were also used for electrophysiological recordings gave similar results [1100 ± 42 and 528 ± 56 neurons/mm2 for saline (n = 7) and pilocarpine (n = 14), respectively]. There was no loss of hilar neurons in animals that were injected with pilocarpine but did not exhibit seizures (1012 ± 40 neurons/mm2; n = 6 total; 3 animals at 8–9 d, 2 at 15–20 d, and 1 at 6 weeks), indicating that the loss of neurons was caused by seizures rather than directly by pilocarpine treatment. There was no significant difference in hilar cell number within either the saline or pilocarpine-treated group over the 5 d to 6 week survival period. There was also no significant difference in the hilar area between age-matched pilocarpine- and saline-treated animals (one-way ANOVA, LSD post hoc comparison,p > 0.05).
Neo-Timm staining of heavy metals in the mossy fibers revealed significant (Kruskal–Wallis ANOVA by ranks, p < 0.01) mossy fiber sprouting into the inner molecular layer of pilocarpine-injected animals (a median score of 2 for all time points after pilocarpine injection; n = 40) compared with saline-injected controls (a median score of 0; n = 17) (Fig. 1). The median Timm scores at specific times after pilocarpine injection were 1 at 6–12 d (n = 10 [9]), 2 at 19–20 d (n = 3), and 2 at 6–7 weeks (n = 27 [26]). Numbers in brackets indicate the number of animals that were also used for electrophysiological recording. The median Timm score for animals injected with pilocarpine but not showing seizures was 0 (n = 1 at 9 d and n = 3 at 6 weeks).
Changes in opioid receptor–immunoreactive neurons in the granule cell layer and hilus
As described previously (Bausch et al., 1995b), the affinity-purified anti-μ-opioid receptor antibody MT-2 (#2148) labeled a scattered subpopulation of neuronal somata, dendrites, and puncta in the rat dentate gyrus. The morphology and localization of these somata (Ribak and Anderson, 1980; Schwartzkroin and Kunkel, 1985;Kunkel et al., 1986) suggest that the stained neurons were GABAergic (Figs. 2A,B, 4). However, because a complete overlap between MOR-IR and GABA-IR has not been demonstrated, it is possible that a subpopulation of MOR-positive neurons may be non-GABAergic. Immunocytochemical controls exhibited no labeling and included (1) omission of primary antibody, (2) incubation with preimmune sera, and (3) preadsorption of the affinity-purified primary antibody with the peptide immunogen (data not shown).
Significantly fewer MOR-IR neurons were observed in the dentate gyrus of pilocarpine-treated rats (Fig. 2B) than were evident in the saline-treated controls (Fig. 2A). When data from all experimental animals killed 8 d to 6 weeks after injection were compiled (n = 34), there was a 45% decrease in MOR-IR structures >10 X 10 μm in the hilus and a 30% decrease in MOR-IR structures in the granule cell layer of pilocarpine compared with saline-treated rats (Fig. 2C). A single neuron with multiple large dendrites could be counted more than once if these immunoreactive structures represent large dendrites. Therefore, changes in the number of labeled somata (defined as immunoreactive structures with discernible nuclei) also were determined. The number of MOR-IR somata decreased by 41 and 33% in the hilus and granule cell layer, respectively (Fig. 2D). This reduction in MOR-IR neurons caused by pilocarpine treatment was consistent with the loss of hilar neurons evident by cresyl violet staining. The number of MOR-IR neurons in the molecular layer of control animals was low and variable, and changes were not quantified. In sections from rats that were injected with pilocarpine but did not exhibit seizures (n = 6 total; n = 2 at 8 d, 2 at 15–20 d, and 2 at 6 weeks), the number of MOR-IR structures (290 ± 20 structures/mm2, granule cell layer; 120 ± 20 structures/mm2, hilus) and MOR-IR somata (200 ± 50 somata/mm2, granule cell layer; 74 ± 10 somata/mm2, hilus) was similar to saline-injected controls.
Immunocytochemistry with the affinity-purified anti-δ-opioid receptor antibody (DT-1, #8663) yielded both punctate and net-like labeling as described previously (Bausch et al., 1995a). The net-like labeling was contained primarily within somata (data not shown), and preliminary electron microscopic data suggested that the immunoreactivity was associated with the membranes of Golgi apparatus (C. Drake, personal communication). Immunocytochemical control experiments were the same as described for the μ-opioid receptor and showed no nonspecific labeling (data not shown). Because changes in MOR-IR structures accurately demonstrated changes in the number of neurons expressing the μ-opioid receptor protein, changes in the net-like DT-1 staining were used to document changes in the number of DOR-IR neurons. A decrease in DOR-IR neurons was seen in the dentate gyrus of pilocarpine-injected (Fig. 3B) compared with saline-injected animals (Fig. 3A). When data from experimental animals killed 8 d to 6 weeks after injection (n = 46) were compiled, there was a significant decrease (37%) in DOR-IR neurons in the hilus but not in the granule cell layer of pilocarpine- compared with saline-injected animals (Fig. 3C).
Changes in the inner molecular layer
In addition to decreases in MOR-IR and DOR-IR neurons in the granule cell layer and hilus, changes in diffuse MOR-IR, DOR-IR, and GABA-IR also were found in the inner molecular layer. Dramatic increases in the intensity of MOR-IR and GABA-IR were observed in the inner molecular layer of animals displaying pilocarpine-induced seizures compared with saline-treated controls (Fig.4A–D). Very faint increases in DOR-IR puncta also were observed in the inner molecular layer of pilocarpine- compared with saline-injected controls (Fig.4E,F). Compilation of the data from this group of experimental animals (Table 1) revealed that increases in diffuse MOR-IR and GABA-IR in the inner molecular layer occurred in as little as 8–9 d after pilocarpine injection and persisted for at least 6 weeks (the longest survival period investigated). Faint increases in diffuse DOR-IR in the inner molecular layer were observed 8–9 d after pilocarpine injection but returned to control levels by 14–21 d.
Inner molecular layer staining—median scores
GFAP staining was not increased in the inner molecular layer 2–6 weeks after pilocarpine-induced seizures. These data serve as a control for the specificity of the increased inner molecular layer staining and indicate that increases in MOR-IR, DOR-IR, and GABA-IR were not attributable to (1) an artifact from the staining protocol, (2) a nonspecific antibody/tissue interaction, or (3) increased expression of DOR, MOR, and GABA in reactive astrocytes. No increases in diffuse DOR-IR, MOR-IR, and GABA-IR were seen in the inner molecular layer in sections from animals pretreated with diazepam before pilocarpine injection to block seizures or in animals that were injected with pilocarpine but did not display seizure activity (data not shown). These results serve as a additional control for the specificity of the increased inner molecular layer staining and indicate that the increases in MOR-IR, DOR-IR, and GABA-IR were seizure-induced rather than caused directly by pilocarpine. The lack of a direct effect of the cholinergic agonist pilocarpine on inner molecular layer staining is particularly important because of the termination of septal cholinergic afferents in the supragranular region and inner molecular layer (Houser et al., 1983; Frotscher and Leranth, 1985, 1986).
Changes in GABAergic transmission and the physiological effects of μ-opioid receptor agonists
In the normal hippocampus, application of μ-opioid receptor agonists causes a net increase in the excitability of principal cells (pyramidal and granule cells) via a disinhibitory mechanism (Zieglgansberger et al., 1979; Lee et al., 1980; Nicoll et al., 1980;Wiesner et al., 1986; Wiesner and Henriksen, 1987; Neumaier et al., 1988). This increase in excitability was seen as a leftward and upward shift in the stimulus-response curve generated by measuring dentate granule cell population spike amplitudes using extracellular recording (Fig. 5A). Additionally, μ-opioid receptor agonists usually elicited a single secondary population spike at high stimulus intensities (Fig. 5B). Both the increase in primary population spike amplitude and the generation of a secondary population spike were reversed by naloxone and mimicked by application of the GABAA receptor antagonist bicuculline (Fig.5A,B). In contrast to the single secondary population spike elicited by the μ-opioid receptor agonist, bicuculline routinely caused multiple secondary population spikes (Fig. 5B) (Dingledine, 1981; Swearengen and Chavkin, 1989).
Decreased inhibitory transmission was expected in pilocarpine- compared with saline-treated animals because of the decreased number of GABAergic neurons (Obenaus et al., 1993). Additionally, compensatory increases in GABAergic transmission were expected based on the delayed increases in GABA-IR in the inner molecular layer (present study) as well as previous reports suggestive of increased GABAergic transmission in the dentate gyrus after seizures (Liebowitz et al., 1978; McNamara et al., 1980; Tuff et al., 1983a,b; King et al., 1985; Shin et al., 1985; deJonge and Racine, 1987; Maru and Goddard, 1987; Nobrega et al., 1990; Cavalheiro et al., 1992; Kamphuis et al., 1992, 1995; Zhao and Leung, 1992; but see Tauck and Nadler, 1985; Sloviter, 1991).
Contrary to predictions, there was no significant difference (one-way ANOVA, LSD post hoc comparison, p > 0.05) between saline- (n = 18) and pilocarpine- (n = 28) treated animals in the following: (1) threshold for population spike generation, (2) stimulus intensity required to elicit a half-maximal response (S1/2), or (3) primary population spike amplitude at either the S1/2 or 300 μA stimulus intensities for at least 6 weeks after injection (data not shown). There was, however, a significant (Kruskal–Wallis ANOVA by ranks, p < 0.05) increase in the incidence of secondary population spikes in slices from pilocarpine- compared with saline-treated animals. In normal Krebs–bicarbonate buffer (ACSF), secondary population spikes were present in recordings in slices from 52% of pilocarpine-treated, compared with 18% of saline-treated animals. This observation was not dependent on survival time after injection, and it is consistent with a reduction in inhibition.
Physiological changes in the effects of opioid receptor ligands also were anticipated based on changes in the anatomical distribution of immunoreactivity for opioid receptors. A decrease in the effects of μ-opioid receptor agonists was predicted by the reduction in μ-opioid receptor-containing neurons, whereas possible compensatory increases were suggested by the increased MOR-IR in the inner molecular layer. As anticipated, there were significant changes in the DAMGO-induced effects on population spike amplitude in slices from rats killed at different times after pilocarpine injection.
Application of the μ-opioid receptor agonist DAMGO caused a 32% increase in primary population spike amplitude in slices from saline-injected control animals. At 5–13 d after pilocarpine-induced SE, there was a greatly decreased effect of DAMGO on the primary population spike (Fig. 5C). This decreased DAMGO effect had partially recovered by 2–3 weeks and returned to control levels by 6 weeks (Fig. 5C). Bicuculline-induced effects on the primary population spike were used to investigate changes in GABAergic transmission. In saline-injected controls, bicuculline caused a 30% increase in primary population spike amplitude. At 5–13 d after pilocarpine injection, there was a 60% decrease in the bicuculline-induced response; however, this decrease was not statistically significant. A return to control level sensitivity to bicuculline was observed at 2–6 weeks after pilocarpine injection (Fig. 5E). There was no significant change in the amplitude of the DAMGO-induced (Fig. 5D) or bicuculline-induced (Fig.5F) secondary population spike at any time point after pilocarpine-induced SE.
In dentate granule cells, μ-opioid receptor agonists can affect NMDA receptor mediated currents (Xie et al., 1992), and seizures alter the physiological properties of NMDA receptor channels (Mody et al., 1988;Kohr et al., 1993). Therefore, the possibility that seizure-induced changes in DAMGO effects were mediated through NMDA receptors was investigated. Similar to results obtained in the CA1 region of the hippocampus (Swearengen and Chavkin, 1987), the NMDA receptor antagonist APV (50 μm) did not affect DAMGO-induced increases in primary population spike amplitude but did completely abolish the DAMGO-induced secondary population spike in both saline- and pilocarpine-treated rats (n = 7, data not shown). No seizure-induced changes were seen in the DAMGO-generated, APV-sensitive, secondary population spike. Additionally, there were no significant (one-way ANOVA, LSD post hoc comparison,p > 0.05) effects of DAMGO on population spike measures in the presence of bicuculline in saline- and pilocarpine-treated animals (n = 17, data not shown). These data suggest that the seizure-induced changes in response to μ-opioid receptor agonists were not mediated through a seizure-induced change in NMDA receptor function.
Given these results, seizure-induced changes in the physiological effects of μ-opioid receptor agonists were investigated further by measuring DAMGO-mediated effects on evoked and sIPSCs in granule cells using whole-cell voltage-clamp conditions that blocked putative postsynaptic opioid effects. Changes in GABAergic transmission were investigated by comparing the mean amplitude and frequency of IPSCs at different times after injection with either pilocarpine or saline. Polysynaptic IPSCs requiring excitatory amino acid-mediated transmission were blocked in these experiments. Monosynaptic IPSCs were evoked from stimulation in either the middle/inner molecular layer border or deep within the hilus (Fig.6A) to differentially stimulate subsets of GABAergic neurons. Molecular layer stimulation should stimulate GABAergic neurons localized in the molecular layer, granule cell layer, and subgranular region as well as in axons and occasional dendrites from the hilar GABAergic neurons. Hilar stimulation should directly activate GABAergic neurons localized in the hilus as well as the few GABAergic neurons localized in the subgranular region with dendrites in the deep hilus (Amaral, 1978; Halasy and Somogyi, 1993;Han et al., 1993). Current spread from the hilar-stimulating electrode did not directly stimulate subgranular GABAergic neurons. No IPSC was evoked from hilar stimulation (≤100 μA) when a knife cut was placed between the hilar-stimulating electrode and the subgranular region. In the same cut slices, IPSCs were evoked from molecular layer stimulation that were similar in amplitude to those evoked in uncut slices (data not shown).

Time-dependent changes were seen in the mean amplitude of monosynaptic evoked IPSCs and the DAMGO-induced depression of monosynaptic evoked IPSCs recorded in dentate granule cells after pilocarpine-induced seizures. Excitatory amino acid transmission was blocked with 50 μm APV and 10 μm CNQX. Putative postsynaptic opioid effects and the GABAB response were blocked with intracellular CsF and QX-314, as described in Materials and Methods. Granule cells were held at 0 mV for at least 30 sec before and after each monosynaptic IPSC data collection series.A, Traces from a representative experiment show that DAMGO (1 μm) decreased the amplitude of the monosynaptic IPSC evoked by both molecular layer (S1) and hilar (S2) stimulation measured in the same dentate granule cell. (Rat killed 6 weeks after saline injection.) Schematic shows placement of the bipolar stimulating (solid rectangles) and recording (open triangle) electrodes.B, C, Compiled data show time-dependent changes in the amplitude of the monosynaptic IPSC evoked from molecular layer (B) and hilar (C) stimulation in pilocarpine- compared with saline-treated rats. D,E, Compiled data show time-dependent changes in the DAMGO-induced (1 μm) depression of the monosynaptic IPSC evoked from molecular layer (D) and hilar (E) stimulation. Opioid receptor-mediated effects were defined as the DAMGO effects that were reversible by 1 μmnaloxone. Error bars indicate the mean ± SEM from the number of cells indicated in parentheses (11–19 animals per group) (B, C); or the number of animals indicated in parentheses (D,E). *Significant difference (one-way ANOVA, LSDpost hoc comparison; p < 0.05).
As anticipated from anatomical changes in distribution, significant changes were seen in the mean amplitude of monosynaptic evoked IPSCs and in the DAMGO-induced effects on these measures in slices from rats killed at different time points after pilocarpine injection. Only minor, statistically insignificant decreases in the amplitude of the monosynaptic evoked IPSCs were observed at 5–13 d after pilocarpine injection compared with saline-injected controls (Fig.6B,C). There was, however, a significant increase in the amplitude of the monosynaptic IPSC evoked from molecular layer stimulation between 13 d and 6 weeks after pilocarpine injection (Fig. 6B). Bicuculline (10 μm) decreased the amplitude of monosynaptic IPSCs to 4 ± 1% (n = 19) and 5 ± 2% (n = 16) of control values when evoked from molecular layer and hilar stimulation, respectively. Similar changes were seen in the DAMGO-induced depression of the monosynaptic evoked IPSCs. In saline-injected control animals, consistent with previous reports (Xie et al., 1992; Piguet and North, 1993), application of DAMGO decreased the peak amplitude of the monosynaptic evoked IPSC by 29% after molecular layer stimulation (Fig.6A,D) and by 45% after hilar stimulation (Fig. 6A,E). At 5–13 d after pilocarpine injection, DAMGO appeared to be less effective at decreasing the amplitude of monosynaptic IPSCs, but these changes were not statistically significant (Fig.6D,E). However, by 6 weeks there was a significant increase (124%) in the ability of DAMGO to decrease the amplitude of the IPSC evoked from hilar stimulation (Fig.6E).
No significant change was observed in the frequency or mean amplitude of sIPSCs after pilocarpine treatment (Fig.7B,C). Application of DAMGO caused no significant change in the mean sIPSC amplitude but did cause a significant (26 ± 4%) decrease in sIPSC frequency in saline-injected control animals (Fig. 7D), consistent with reports in CA1 pyramidal cells (Cohen et al., 1992; Lupica et al., 1992). After pilocarpine treatment, DAMGO had a widely variable effect on sIPSC frequency (Fig. 7D). In six pilocarpine-treated animals, DAMGO caused a much greater decrease in sIPSC frequency compared with controls. In the remaining two animals, the DAMGO-induced decrease in frequency was equivalent to that seen in the controls. DAMGO did cause a significantly greater decrease in the mean sIPSC amplitude at 6 weeks after pilocarpine injection (−37 ± 7%) than in saline-injected controls (−2 ± 7%) (Fig.7A,D).

Effects of DAMGO on sIPSCs recorded in dentate granule cells were increased 6 weeks after pilocarpine-induced seizures. Recordings were done under the same conditions as described in Figure 6. Because recordings were done in the absence of the Na+ channel blocker tetrodotoxin (TTX), spontaneous events include both miniature IPSCs as well as action potential-dependent IPSCs. A, Traces from a representative experiment show that DAMGO (1 μm) decreased the frequency and amplitude of the sIPSCs. (Rat killed 6 weeks after pilocarpine injection.) Compiled data show no significant change in the mean sIPSC amplitude (B) or sIPSC frequency after pilocarpine-induced seizures (C). D, Compiled data show that DAMGO (1 μm) caused a greater depression of the mean sIPSC amplitude and sIPSC frequency 6 weeks after pilocarpine compared with saline injection. Opioid receptor-mediated effects were defined as the DAMGO effects that were reversible by 1 μmnaloxone. Error bars indicate the mean ± SEM from thenumber of cells indicated in parentheses(5–7 animals per group) (B,C) or thenumber of animals indicated inparentheses (D). *Significant difference from saline-injected controls (one-way ANOVA, LSD post hoccomparison; p < 0.05).
Changes in δ-opioid receptor physiology
In slices from saline-injected control animals, application of the δ-opioid receptor agonist DPDPE had no significant effect on the amplitudes of granule cell population spikes (Fig.8A). DPDPE did not elicit a secondary population spike (data not shown). In contrast, 5–13 d after pilocarpine treatment, for rats showing seizures application of DPDPE caused a small but consistent decrease in population spike amplitude (Fig. 8A); by 2–6 weeks, the response to DPDPE was variable again. The results suggested that DPDPE inhibited both an inhibitory and an excitatory pathway, with the net effect differing between slices. Furthermore, the seizure-induced decreases in inhibition after pilocarpine treatment (as suggested by the increased incidence of multiple population spikes) served to “unmask” the effect of DPDPE on an excitatory pathway. The effects of DPDPE on excitatory and inhibitory pathways were investigated further to test this hypothesis.

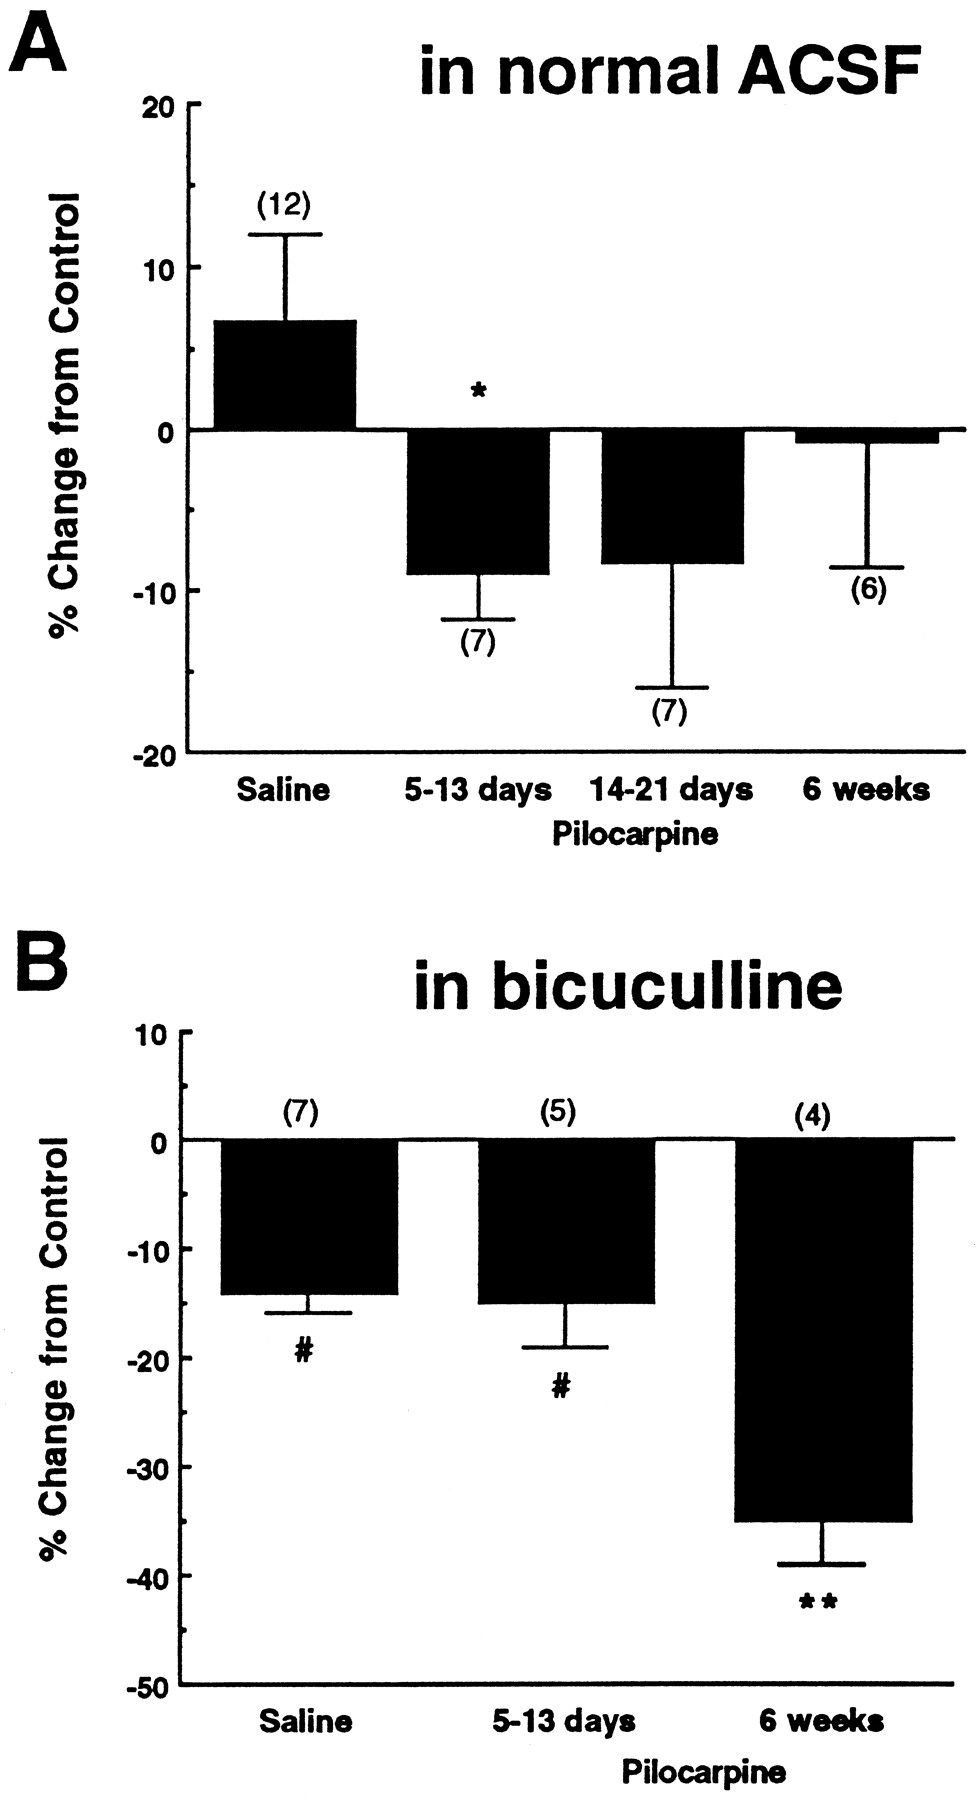
Time-dependent changes were seen in the effect of the δ-opioid receptor agonist DPDPE on the amplitudes of dentate granule cell population spikes after pilocarpine-induced seizures.A, Compiled data show time-dependent changes in primary population spike amplitude caused by DPDPE (1 μm) in normal ACSF in pilocarpine- compared with saline-injected rats. Population spikes were evoked by a 300 μA stimulus. B, Compiled data show seizure-induced, time-dependent changes in the effect of DPDPE (1 μm) on primary population spike amplitude in the presence of 10 μm bicuculline and high Mg2+ and high Ca2+ ACSF. Population spike amplitudes were measured at the control S1/2(stimulus intensity required to elicit a half-maximal response). Opioid receptor-mediated effects were defined as the DPDPE effects that were reversible by 1 μm naloxone or 100 nm −1 μm naltrindole. *Significant difference from saline-injected controls (Student’s t test,p < 0.05). **Significant difference from saline-injected controls and 5–13 d after pilocarpine injection (one-way ANOVA, LSD post hoc comparison;p < 0.01). #Significant effect based on a 99% confidence interval.
The effect of DPDPE on excitatory transmission was investigated using extracellularly recorded population spikes in the presence of the GABAA receptor antagonist bicuculline. A buffer containing higher concentrations of Mg2+ and Ca2+ was used to minimize hyperexcitability caused by bicuculline. Because a progressive increase in excitatory mossy fiber collaterals into the inner molecular layer occurs as a result of seizures (Tauck and Nadler, 1985; Cronin et al., 1992), possible changes in population spike measures were anticipated. In the presence of bicuculline, there was no significant difference (one-way ANOVA, LSD post hoccomparison, p > 0.05) between saline- (n = 13) and pilocarpine- (n = 14) treated animals in the following: (1) threshold for population spike generation, (2) stimulus intensity required to elicit a half-maximal response (S1/2), or (3) primary population spike amplitude at either the S1/2 or 300 μA stimulus intensities for at least 6 weeks after injection (data not shown). In the presence of bicuculline, DPDPE decreased the population spike amplitude by 15% in slices from saline-injected control and pilocarpine-injected rats at 5–13 d after pilocarpine treatment (Fig.8B). At 6 weeks after pilocarpine treatment, DPDPE caused a significantly greater depression (35%) of the population spike amplitude (Fig. 8B). These data indicate that δ-opioid receptors inhibit excitatory transmission in the dentate gyrus of normal rats, as suggested previously, (Moore et al., 1988) and that this effect is enhanced after pilocarpine-induced seizures.
The effect of DPDPE on inhibitory transmission was investigated using monosynaptic evoked IPSCs and sIPSCs recorded in granule cells under voltage-clamp conditions that blocked putative postsynaptic opioid effects. There were no significant effects of DPDPE on either the mean amplitude or the frequency of sIPSCs (n = 9, data not shown) or on the amplitude of the monosynaptic IPSC evoked from molecular layer stimulation for at least 6 weeks after either saline or pilocarpine injection (Fig. 9A). DPDPE had no effect on the monosynaptic IPSC evoked from hilar stimulation in saline-injected controls or at 5–13 d after pilocarpine injection. However, DPDPE did cause a small (24%) but significant increase in the amplitude of the monosynaptic IPSC evoked from hilar stimulation at 6 weeks after pilocarpine injection (Fig. 9B). These results indicate that δ-opioid receptor activation has no direct effect on monosynaptic GABAergic transmission in saline-injected animals and or in animals killed 5–13 d after pilocarpine injection.

The δ-opioid receptor agonist DPDPE increased the amplitude of the monosynaptic IPSC recorded in dentate granule cells and evoked from hilar stimulation 6 weeks after pilocarpine injection. Recordings were done under the same conditions as described in Figure 6. A, B, Compiled data show no effect of DPDPE (1 μm) on the amplitude of the monosynaptic IPSC evoked by molecular layer stimulation (S1) (A). DPDPE (1 μm) did significantly increase the amplitude of the monosynaptic IPSC evoked by hilar stimulation (S2) (B) in rats killed 6 weeks after pilocarpine injection. Opioid receptor-mediated effects were defined as the changes in response caused by DPDPE that were reversible by 1 μm naloxone or 100 nm −1 μm naltrindole. *Significant difference from saline-injected controls (one-way ANOVA, LSD post hoccomparison; p < 0.05). #Significant effect based on a 99% confidence interval.
DISCUSSION
Correlation of time-dependent changes in anatomical and physiological data
A loss of cresyl violet-stained neurons was observed in the hilus by 8 d and persisted for least 6 weeks after pilocarpine treatment. Similar decreases in MOR-IR and DOR-IR were observed in the same region, suggesting a loss of neurons rather than downregulation of opioid receptor expression. These changes are mirrored by a loss of GAD-mRNA-expressing neurons in the hilus (Obenaus et al., 1993). The decrease in MOR-IR in the granule cell layer may represent a long-term downregulation of expression, because no loss of GAD-expressing neurons was reported in this region.
Electrophysiological results showed decreased DAMGO effects at 5–13 d after pilocarpine-induced SE. However, by 6 weeks after pilocarpine injection, GABAergic transmission and DAMGO effects recovered to control or increased levels. Recovery of physiological effects occurred despite the persistent loss of opioid receptor-expressing neurons, suggesting the existence of compensatory mechanisms.
Anatomical increases in GABA-IR (present study), GAD-IR (Davenport et al., 1990), and MOR-IR in the inner molecular layer as well as altered hippocampal GABA levels and release (Liebowitz et al., 1978; Cavalheiro et al., 1992) after seizures suggest the following: (1) sprouting of GABAergic axons and terminals, (2) increased levels of GABA and μ-opioid receptors in existing terminals, or (3) a combination of both as possible compensatory mechanisms. Significantly increased IPSC amplitudes and DAMGO effects on these measures at 6 weeks after pilocarpine injection also suggest increased GABAergic transmission, although an increased number of GABAA receptors on granule cells could partially account for this finding (Otis et al., 1994). Increased numbers of postsynaptic μ-opioid receptors, however, cannot account for the physiological data presented, because changes in DAMGO effects on GABAergic transmission occurred under conditions that blocked putative postsynaptic opioid effects. Additionally, no μ-opioid receptor-mediated effects were seen in the presence of bicuculline. Also in support of GABAergic neuron plasticity was the very similar time course of changes seen in GABAergic transmission measured physiologically and in hippocampal GABA levels measured biochemically (Cavalheiro et al., 1992) after pilocarpine-induced seizures. Seizure-induced increases of GAD mRNA in scattered hilar and granule cell layer neurons (Feldblum et al., 1990; Najlerahim et al., 1992) suggest that these neurons may be a source of increased GABA and μ-opioid receptors or sprouted axons.
Time-dependent changes observed in this study may resolve discrepancies in the literature regarding seizure-induced changes in GABAergic transmission in the dentate gyrus. Similar time-dependent changes may occur in other models of temporal lobe epilepsy, with decreased inhibition predominating at short time points and normal or increased inhibition prevailing at longer time points. This hypothesis has been proposed by Sloviter (1987, 1991) and Dudek and colleagues (1994) and is supported further by reports of a transient loss followed by partial recovery of some measures of inhibition in the CA1 region of kainate-treated rats (Franck and Schwartzkroin, 1985; Meier et al., 1992).
μ-Opioid receptor distribution and physiological effects
The number of MOR-IR somata (180 ± 20/mm2) was comparable with the number of GAD-positive neurons (184–195 ± 23–25/mm2) (Obenaus et al., 1993) in the granule cell layer, suggesting that most GABAergic neurons in this region have somatic μ-opioid receptors. In the hilus, GAD-expressing neurons (328–352 ± 27–29/mm2) (Obenaus et al., 1993) far outnumbered MOR-IR somata (88 ± 8/mm2). Although differences in methods (i.e., thickness and plane of section) could account for moderate differences, the large discrepancy strongly suggests that only a subpopulation of hilar GAD-positive neurons have somatic μ-opioid receptors.
The data showing seizure-induced changes in DAMGO effects on the primary, but not the secondary, population spike were surprising for three reasons: (1) the DAMGO-induced secondary population spike was NMDA receptor dependent, (2) seizures change the properties of NMDA receptors in granule cells (Mody et al., 1988; Kohr et al., 1993), and (3) μ-opioid receptor agonists modulate NMDA receptor-mediated currents in dentate granule cells (Xie et al., 1992). These data suggest that either separate mechanisms of action, which are differentially affected by seizures, mediate DAMGO effects on the primary and secondary population spikes or that the alterations in NMDA receptor properties mask any changes in DAMGO effects on the secondary population spike.
μ-Opioid receptor distribution and physiological effects
At 6 weeks after pilocarpine injection, DPDPE caused an increased inhibition of excitatory transmission (in the presence of bicuculline) and an increase in GABAergic transmission after hilar stimulation. Each of these actions should decrease population spike amplitudes. However, at 6 weeks after pilocarpine injection, the effects of DPDPE on population spike measures (no bicuculline) were variable. These results imply that DPDPE also caused disinhibition. Piguet and North (1993)described μ- and δ-opioid receptor-mediated presynaptic inhibition of monosynaptic IPSPs recorded from rat dentate granule cells and evoked from hilar stimulation. Furthermore, Piguet and North described an opioid-induced hyperpolarization of the granule cells that was attributed to direct, postsynaptic effects of DPDPE. However, in our study, in which direct effects of DPDPE on the granule cell were blocked, there was no effect of the δ-opioid agonist on either monosynaptic evoked or sIPSCs in control animals. The simplest reconciliation is a direct action of DPDPE on granule cells that acts to decrease the effectiveness of GABAergic transmission. Consistent with this hypothesis, Commons and Milner (1995) showed electron microscopic localization of DOR-IR in dendritic spines and, occasionally, in discrete regions of dendritic and somatic plasma membrane that were usually associated with synapses. This discrete subcellular localization of DOR-IR suggests that δ-opioid receptor activation could modulate neurotransmission postsynaptically at individual excitatory and inhibitory synapses.
Xie and Lewis (1995) showed that δ-opioid receptor activation blocked long-term potentiation of feedforward but not feedback polysynaptic inhibitory transmission in an NMDA receptor-dependent manner. Furthermore, this potentiation did not occur at the GABAergic neuron/granule cell synapse, suggesting that δ-receptor activation may modulate excitatory perforant path transmission to GABAergic neurons. This modulation could occur through actions on perforant path terminals or on postsynaptic GABAergic neurons. Consistent with the latter explanation, DOR-IR has been co-localized with GABA-IR in both mouse (Bausch et al., 1995a) and rat (Commons and Milner, 1995). Although DPDPE had no effect on IPSC measures in our experiments, a subtle effect of δ-opioid receptor activation could modulate transmission at individual synapses similar to that described above.
Proposed model for the role of opioids and opioid receptors in the epileptic dentate gyrus
Concomitant with increased MOR-IR in the inner molecular layer are seizure-induced increases in hippocampal enkephalin levels (Hong et al., 1980; Iadarola et al., 1986; Kanamatsu et al., 1986; McGinty et al., 1986). High-frequency stimulation of the enkephalin-containing (Gall et al., 1981; McLean et al., 1987) perforant path causes release of the endogenous opioid, which can act at μ- and δ-opioid receptors (Bramham et al., 1988, 1991; Wagner et al., 1990; Xie and Lewis, 1991). The increased levels of both enkephalins and μ-opioid receptors suggest that endogenously released enkephalin could more potently inhibit GABAergic tone and unmask increased levels of glutamatergic transmission caused by mossy fiber sprouting (Tauck and Nadler, 1985; Cronin et al., 1992). In this model, activity in the dentate gyrus is normal until a period of high-frequency stimulation would serve to shift the balance of GABAergic and glutamatergic tone. Although changes in endogenous opioids and opioid receptors may help shift the balance between excitatory and inhibitory control, a combination of phenomena is likely to be responsible for seizure activity.
Changes in functional μ-opioid receptor distribution as a measure of changes in GABAergic circuitry
As stated previously, μ-opioid receptor-positive neurons are GABAergic based on morphology, location, and physiological responses (Nicoll et al., 1980; Ribak and Anderson, 1980; Schwartzkroin and Kunkel, 1985; Kunkel et al., 1986; Madison and Nicoll, 1988; Pang and Rose, 1989; Cohen et al., 1992). Because changes in μ-opioid receptor action occurred only on GABAergic transmission, results of this study further define changes in a subset of GABAergic neurons after seizures. Significant decreases in μ-opioid receptor-mediated effects at 1–2 weeks after pilocarpine injection most likely reflect the loss of a subset of GABAergic neurons. The return of GABAergic transmission and opioid receptor-mediated effects to control or increased levels at later time points supports the hypothesis that a compensatory mechanism restored GABAergic transmission. The increase in GABAergic transmission and μ-opioid receptor action was independent of excitatory transmission. Therefore, excitatory reinnervation of the surviving GABAergic neurons via mossy fiber sprouting was not solely responsible for increased inhibition and μ-opioid receptor mediated effects.
Footnotes
This work was supported by U.S. Public Health Service Grant NS33898, and predoctoral training support for S.B.B. was provided by Grant DA07888. Image analysis was performed at the W. M. Keck Center for Advanced Studies of Neuronal Signaling at the University of Washington. We thank Ms. Tiffany Esteb and Dr. Michele Simmons for assistance and Dr. Gregory W. Terman for helpful discussions. All treatment of animals was according to National Institutes of Health and institutional guidelines.
Correspondence should be addressed to Dr. Charles Chavkin, Department of Pharmacology, Box 357280, University of Washington, Seattle, WA 98195-7280.
Dr Bausch’s present address: Department of Medicine (Neurology), Box 3676, Duke University Medical Center, Durham, NC 27710.


