


Abstract
Cytochrome P450 (CYP) involved in the two major pathways of imipramine (IMI) was reappraised using human liver microsomes phenotyped forS-mephenytoin 4′-hydroxylation in vitro and 11 recombinant human CYP isoforms. Individual Eadie-Hoffstee plots for IMIN-demethylation and 2-hydroxylation showed a monophasic profile in microsomes obtained from three putativeS-mephenytoin poor metabolizer (PM) livers, whereas the plots gave a biphasic relationship (except for one case in 2-hydroxylation) in those from the three extensive metabolizer (EM) livers. Effects of CYP-selective inhibitor/substrate probes on the two metabolic reactions were examined at the two IMI concentrations (2 and 400 μM) with microsomes obtained from the two PM and three EM livers.S-mephenytoin inhibited IMI N-demethylation by 50% at the low concentration in microsomes from the EM livers with no discernible effect on this pathway in those from the PM livers. Furafylline inhibited the N-demethylation by about 60% at the low and high substrate concentrations in microsomes from both the EM and PM livers. Quinidine abolished the 2-hydroxylation at the low and high concentrations in microsomes from both the EM and the PM livers. Among the recombinant human CYPs, CYP2C19, 2C18, 2D6, 1A2, 3A4 and 2B6 in rank order catalyzed the N-demethylation, whereas CYP2D6, 2C19, 1A2, 2C18 and 3A4 catalyzed the 2-hydroxylation. TheK m values obtained from recombinant CYP2C19 and 1A2 approximated those of the high- and low-affinity components from human liver microsomes for IMI N-demethylation, respectively. For IMI 2-hydroxylation, the respectiveK m values obtained from recombinant CYP2D6 and 2C19 were close to those of the high- and low-affinity components from human liver microsomes. Our human liver microsomal study using the near-therapeutic IMI concentration (2 μM) suggests that 1) CYP2C19 and 1A2 are involved in the N-demethylation and the 2-hydroxylation is mediated exclusively by CYP2D6 and partially by CYP2C19 in the EM livers, and 2) CYP1A2 and 2D6 play a major role in IMI N-demethylation and 2-hydroxylation, respectively, in the PM livers. Our recombinant human CYP isoform study, in general, supports this conclusion.
IMI has been an antidepressant for the treatment of major depression for more than 30 years (Sallee and Pollock, 1990). The major metabolic pathways of IMI involve 2-hydroxylation to form 2-OH-IMI and N-demethylation to form DMI, which is further 2-hydroxylated (Rudorfer and Potter, 1987; Sallee and Pollock, 1990). In vitro and in vivo studies (Brøsen and Gram, 1988; Brøsen et al., 1986a and b;Brøsen et al., 1991) have suggested that IMI 2-hydroxylation cosegregates with the genetically determined activity of debrisoquine 4′-hydroxylase, designated as CYP2D6. This isoform has shown a number of variant alleles associated with the PMs (Dalyet al., 1996) and has been known to be responsible for the metabolism of more than 30 drugs, including tricyclic antidepressants (Dahl and Bertilsson, 1993).
The polymorphic S-mephenytoin 4′-hydroxylation, another pharmacogenetic entity, is catalyzed by a CYP2C subfamily (Wrightonet al., 1993; Goldstein et al., 1994; de Moraiset al., 1994a; Goldstein and de Morais, 1994) designated as CYP2C19, and CYP2C19m1 and m2 have been reported as the mutant genes causing the deficient isozyme activity (de Morais et al., 1994a and b; Goldstein and de Morais, 1994). This genetic polymorphism also shows a cosegregation with the oxidative metabolism of several clinically important drugs (Goldstein and de Morais, 1994). Furthermore, this pharmacogenetic entity has demonstrated a marked interethnic difference in the incidence of the PM phenotype: approximately 3 to 6% of Caucasian (Wilkinson et al., 1989,Nakamura et al., 1985) and 13 to 23% of Oriental populations (Nakamura et al., 1985, Horai et al., 1989) are PMs of S-mephenytoin 4′-hydroxylation. In vivo human panel studies (Skjelbo et al., 1991; Koyamaet al., 1994) have reported that IMIN-demethylation cosegregates with the CYP2C19-related pharmacogenetics. For instance, the mean N-demethylation clearance of IMI is reduced by approximately 50% in PMs ofS-mephenytoin 4′-hydroxylation as compared with EMs. In addition, an in vitro study with Japanese human liver microsomes (Chiba et al., 1994) has shown that there was a significant correlation between the IMI N-demethylase and the S-mephenytoin 4′-hydroxylase activities, a result that supports the in vivo results. In contrast, other in vitro studies (Skjelbo and Brøsen, 1992; Lemoine et al., 1993) have suggested that CYP2C19 is not involved in IMIN-demethylation. Consequently, we carefully reappraised the experimental conditions used for the previous in vitrostudies (Skjelbo and Brøsen, 1992; Lemoine et al., 1993;Chiba et al., 1994) from which the differing conclusions have been drawn in terms of the possible involvement of CYP2C19 in the metabolism of IMI. Then we became aware of the two possible causes of the conflicting results observed in these in vitroexperiments: first, no in vitro study has been conducted with microsomes obtained from the EMs and PMs ofS-mephenytoin 4′-hydroxylation separately and compared between them. Another possible cause is differences in the substrate concentrations (e.g., therapeutically relevant in vivo or not) used for determining CYP isoforms involved in the metabolic pathways of IMI. Indeed, Yasumori et al. (1993)have shown that different CYP isoforms are involved in the metabolism of diazepam at the low and high substrate concentrations and that the involvement of human CYP2C in the N-demethylation occurs in a substrate concentration-dependent manner. Similarly, Pearce et al. (1996) have documented that different CYP isoforms are involved in the metabolism of lansoprazole with the use of different substrate concentrations.
Thus, in the present study, we intended to reappraise the principal CYP isoforms involved in the major metabolic pathways (N-demethylation and 2-hydroxylation) of IMI at a substrate concentration near the therapeutic range and at a supratherapeutic or highly toxic concentration as a counterpart using human liver microsomes and 11 cDNA-expressed human CYPs.
Materials and Methods
Chemicals.
IMI HCl, DMI HCl and TAO were purchased from Sigma Chemical Co. (St. Louis, MO). 2-OH-IMI HCl and 2-OH-DMI oxalate were a generous gift from Ciba-Geigy (Basel, Switzerland). Mianserin was kindly provided by Organon (Oss, the Netherlands). Furafylline was obtained from Salford Ultrafine Chemicals and Research (Manchester, U.K.). Rac-mephenytoin was generously donated by Dr. Küpfer (University of Bern, Bern, Switzerland). S- andR-mephenytoin were separated on a Chiralcel OJ column (10 μm, 4.6 × 250 mm, Daisel Chemical Co. Ltd., Tokyo, Japan) according to the method of Yasumori et al. (1990). NADP, glucose-6-phosphate and glucose-6-phosphate dehydrogenase were purchased from Oriental Yeast (Tokyo, Japan). Quinidine, acetonitrile and other reagents of analytical grade were obtained from Wako Pure Chemical Industries (Osaka, Japan).
Human liver microsomes.
Human liver microsomes were obtained from six patients (aged 53 to 61 years, two males and four females) who underwent partial hepatectomy for metastatic liver tumor(s) in the Division of General Surgery, International Medical Center of Japan, Tokyo, Japan, as reported previously (Chiba et al., 1993b). The use of human livers for this study was approved by the institutional ethics committee. Human liver microsomes were prepared by differential centrifugation as described by Chiba et al.(1993a). After the protein content was measured according to the method of Lowry et al. (1951), the suspended microsomal samples were aliquoted, frozen and stored at −80°C until used.
Microsomal preparations from 11 different cDNAs expressing each of the human CYP isoforms (i.e., CYP1A1, 1A2, 2A6, 2B6, 2C8, 2C9, 2C18, 2C19, 2D6, 2E1 and 3A4) and yeast NADPH-P450-reductase simultaneously expressed in Sacharomyces cerevisiae AH22 cells were obtained from Sumitomo Kagaku (Osaka, Japan). Expression levels and catalytic activities of cDNA-expressed human CYP isoforms in yeast cell lines have been confirmed and reported by Imaoka et al. (1996).
Incubation conditions.
The formation of DMI and 2-OH-IMI from IMI was assessed using the incubation conditions developed in our laboratory (Chiba et al., 1994). Typically, using a 2-ml polypropylene tube, reaction mixtures containing 0.1 or 0.2 mg/ml of human liver microsomes, 0.5 mM NADP, 2.0 mM glucose-6-phosphate, 1 IU/ml of glucose-6-phosphate dehydrogenase, 4 mM MgCl2, 0.1 mM EDTA, 100 mM potassium phosphate buffer (pH 7.4) and 0.25 to 400 μM of IMI in a total volume of 250 μl were incubated at 37°C for 30 min. The reaction was stopped by adding 100 μl of cold acetonitrile. After the termination of incubation, 10 μl of 25 μM mianserin in methanol as an internal standard and 50 μl of 100 mM potassium phosphate buffer (pH 3.0) were added to the sample. The mixture was centrifuged at 8385 × g for 10 min, and the supernatant was injected onto an HPLC apparatus as described below.
Incubation conditions used for the 11 different recombinant human CYP isoforms obtained from genetically engineered yeast cells were the same as those used for human liver microsomes, except for the preincubation time (i.e., 3 min), incubation time and microsomal protein. The standard incubation conditions in each of the CYP isoforms were chosen on the basis of the results of preliminary experiments with the varying incubation times and microsomal proteins. Thus the kinetic studies were performed under the following conditions of the respective P450 concentrations and incubation times: for CYP1A2, 17.6 pmol P450/ml and 15 min; for CYP2B6, 9 pmol P450/ml and 10 min; for CYP2C18, 14.3 pmol P450/ml and 5 min; for CYP2C19, 13.6 pmol P450/ml and 5 min; for CYP2D6, 8.4 pmol P450/ml and 2 min; and for CYP3A4, 13.2 pmol P450/ml and 15 min. As for the other CYP isoforms (CYP1A1, 2A6, 2C8, 2C9 and 2E1), incubation conditions were performed with a 10-min incubation time and at the P450 concentrations of approximately 80 pmol P450/ml. Michaelis-Menten parameters were determined in incubations performed using eight IMI concentrations (10–600 μM) for CYP1A2, seven concentrations (40–800 μM) for CYP2B6, eight concentrations (1–200 μM) for 2C18, eight concentrations (1–200 μM) for CYP2C19, six concentrations (1–40 μM) for CYP2D6 and eight concentrations (20–1500 μM) for CYP3A4.
In vitro assessment of S-mephenytoin 4′-hydroxylation phenotype and DMI 2-hydroxylation capacity.
The R/S value for assessing the S- and R-mephenytoin 4′-hydroxylase activities was determined according to the method ofYasumori et al. (1990). 4′-Hydroxymephenytoin formed fromS- and R-mephenytoin in the incubation mixtures was determined according to the method of Chiba et al.(1993b). The one-component kinetic parameters (K m, V max andV max/K m) ofS-mephenytoin 4′-hydroxylation were estimated as reported from our laboratory (Chiba et al., 1993a and b). Individual data on the R/S values and kinetic parameters observed in microsomes from the six human livers are listed in table 1. Among the six microsomal samples used in the present study, two samples (HL-32 and HL-35) were estimated as having been obtained from the putative S-mephenytoin PMs, because the R/S values were >0.7 according to the criteria (Yasumori et al., 1990) that have been validated by Chiba et al. (1993b). In addition, HL-37 was identified as a putative S-mephenytoin PM liver by its lower V max andV max/K m values, which ranged between those obtained from HL-32 and from HL-35 (table 1), although the R/S value obtained from this liver was <0.7 because of the extremely low activity of R-mephenytoin 4′-hydroxylation. The remaining three samples were estimated as having been obtained from the putative EMs (table 1).
Characteristics of six human livers
The in vitro DMI 2-hydroxylation capacity was assessed by incubating 0.5 to 300 μM DMI in the same incubation mixtures as used for those to determine DMI and 2-OH-IMI formed from IMI. The individual formation capacities of 2-OH-DMI from DMI in the putative EM and PM livers of S-mephenytoin are listed in table 1; they indicate that all of the six livers had certain activities to 2-hydroxylate DMI. Thus those livers were assumed to come from the putative EMs of debrisoquine-type oxidation pharmacogenetics [i.e., DMI 2-hydroxylation mediated via CYP2D6 (Spina et al., 1984)].
HPLC assay for IMI metabolites and DMI 2-hydroxylation.
DMI and 2-OH-IMI formed from IMI and 2-OH-DMI from DMI were assayed by a modification of the HPLC methods of Chiba et al. (1994) andKoyama et al. (1993). Briefly, the assay was carried out with the HPLC system consisting of a model EP-10 pump (Eicom, Kyoto, Japan), a model L-7200 UV detector (Hitachi Ltd., Tokyo, Japan), a model ECD-100 electrochemical detector (Eicom) equipped with a model WE-GC glassy carbon working electrode (Eicom) the applied potential of which was set at 820 mV against an Ag/AgCl electrode (Eicom), a model AS-2000 autosampler (Hitachi), a model D-2500 integrator (Hitachi) and a 4.6 × 250 mm CAPCELL PAK phenyl SG-120 column (Shiseido Co. Ltd., Tokyo, Japan). The mobile phase consisted of acetonitrile-potassium phosphate buffer (0.05 M, pH 3.0) in the proportions 26:74 (v/v) and was delivered at a flow rate of 1.0 ml/min. The column temperature was maintained at 30°C by Thermo Minder SM-05 (TAITEC, Saitama, Japan). The eluate was monitored at the wavelength of 204 nm by UV detection as mentioned above. A 75-μl or 15-μl sample was separately injected into the HPLC system with UV detection or ECD, respectively. Calibration curves were prepared from the metabolite solutions containing concentrations between 10 and 200 ng/ml. The retention times of 2-OH-IMI and DMI formed from IMI and of 2-OH-DMI formed from DMI and mianserin as the internal standard were 9.6, 22.5, 8.6 and 14.6 min, respectively. The detection limits of DMI, 2-OH-IMI and 2-OH-DMI were 4.8 ng/tube, 1.5 ng/tube and 1.5 ng/tube, respectively.
Inhibition study.
The inhibitors/substrates used for the respective human P450s were as follows: furafylline for CYP1A2 (Tassaneeyakul et al., 1993), S-mephenytoin for CYP2C19 (Wrighton and Stevens, 1992), quinidine for CYP2D6 (Kobayashi,et al., 1989) and TAO for CYP3A (Watkins et al., 1985). Each of the low and high concentrations of IMI (2 and 400 μM), respectively, was incubated with one of the inhibitor/substrate probes at concentrations ranging from 0.001 to 100 μM, except forS-mephenytoin (i.e., 50–750 μM), under the incubation conditions described above. Incubation mixtures containing furafylline and TAO were preincubated in the presence of the NADPH-generating system at 37°C for 15 min, and the reactions were initiated by the addition of IMI solution. These inhibitors are mechanism-based and therefore require the NADPH-dependent complexation for inactivation (Kunze and Trager, 1993; Tassaneeyakul et al., 1993; Watkins et al., 1985). All other incubation mixtures contained IMI and S-mephenytoin or quinidine simultaneously, and the reactions were initiated by the addition of the NADPH generating system without previous incubation. Experiments were performed with microsomal preparations obtained from the human livers of two different putative PMs and three different putative EMs as listed in table 1. The microsomal sample of one putative PM liver (HL-35, table 1) was not sufficient for the inhibition study but remained available for the in vitro kinetic study.
Data analysis.
The Michaelis-Menten kinetic parameters for the formation of DMI and 2-OH-IMI from IMI in microsomes obtained from the putative S-mephenytoin EM livers were estimated by fitting the data to the following equation:
The one-component enzyme kinetic parameters (K m,V max andV max/K m without the numerical subindices) for the formation of DMI or 2-OH-IMI from IMI in microsomes of the putative S-mephenytoin PM livers and 2-OH-DMI from DMI in both the putative S-mephenytoin EM and PM livers and recombinant human CYP isoforms were estimatedvia linear regression analysis by using unweighted raw data, because they exhibited simple Michaelis-Menten kinetic behavior (i.e., a one-enzyme kinetic approach).
In addition, an atypical Eadie-Hoffstee plot was obtained for theN-demethylation by CYP3A4 and 2C18 and the 2-hydroxylation by CYP2C18. Thus these data could not be fitted to the typical Michaelis-Menten expression. Instead, a sigmoidV
max model equivalent to the Hill equation was fitted to the data according to
Results
Kinetic profiles of IMI metabolism and DMI 2-hydroxylation by human liver microsomes.
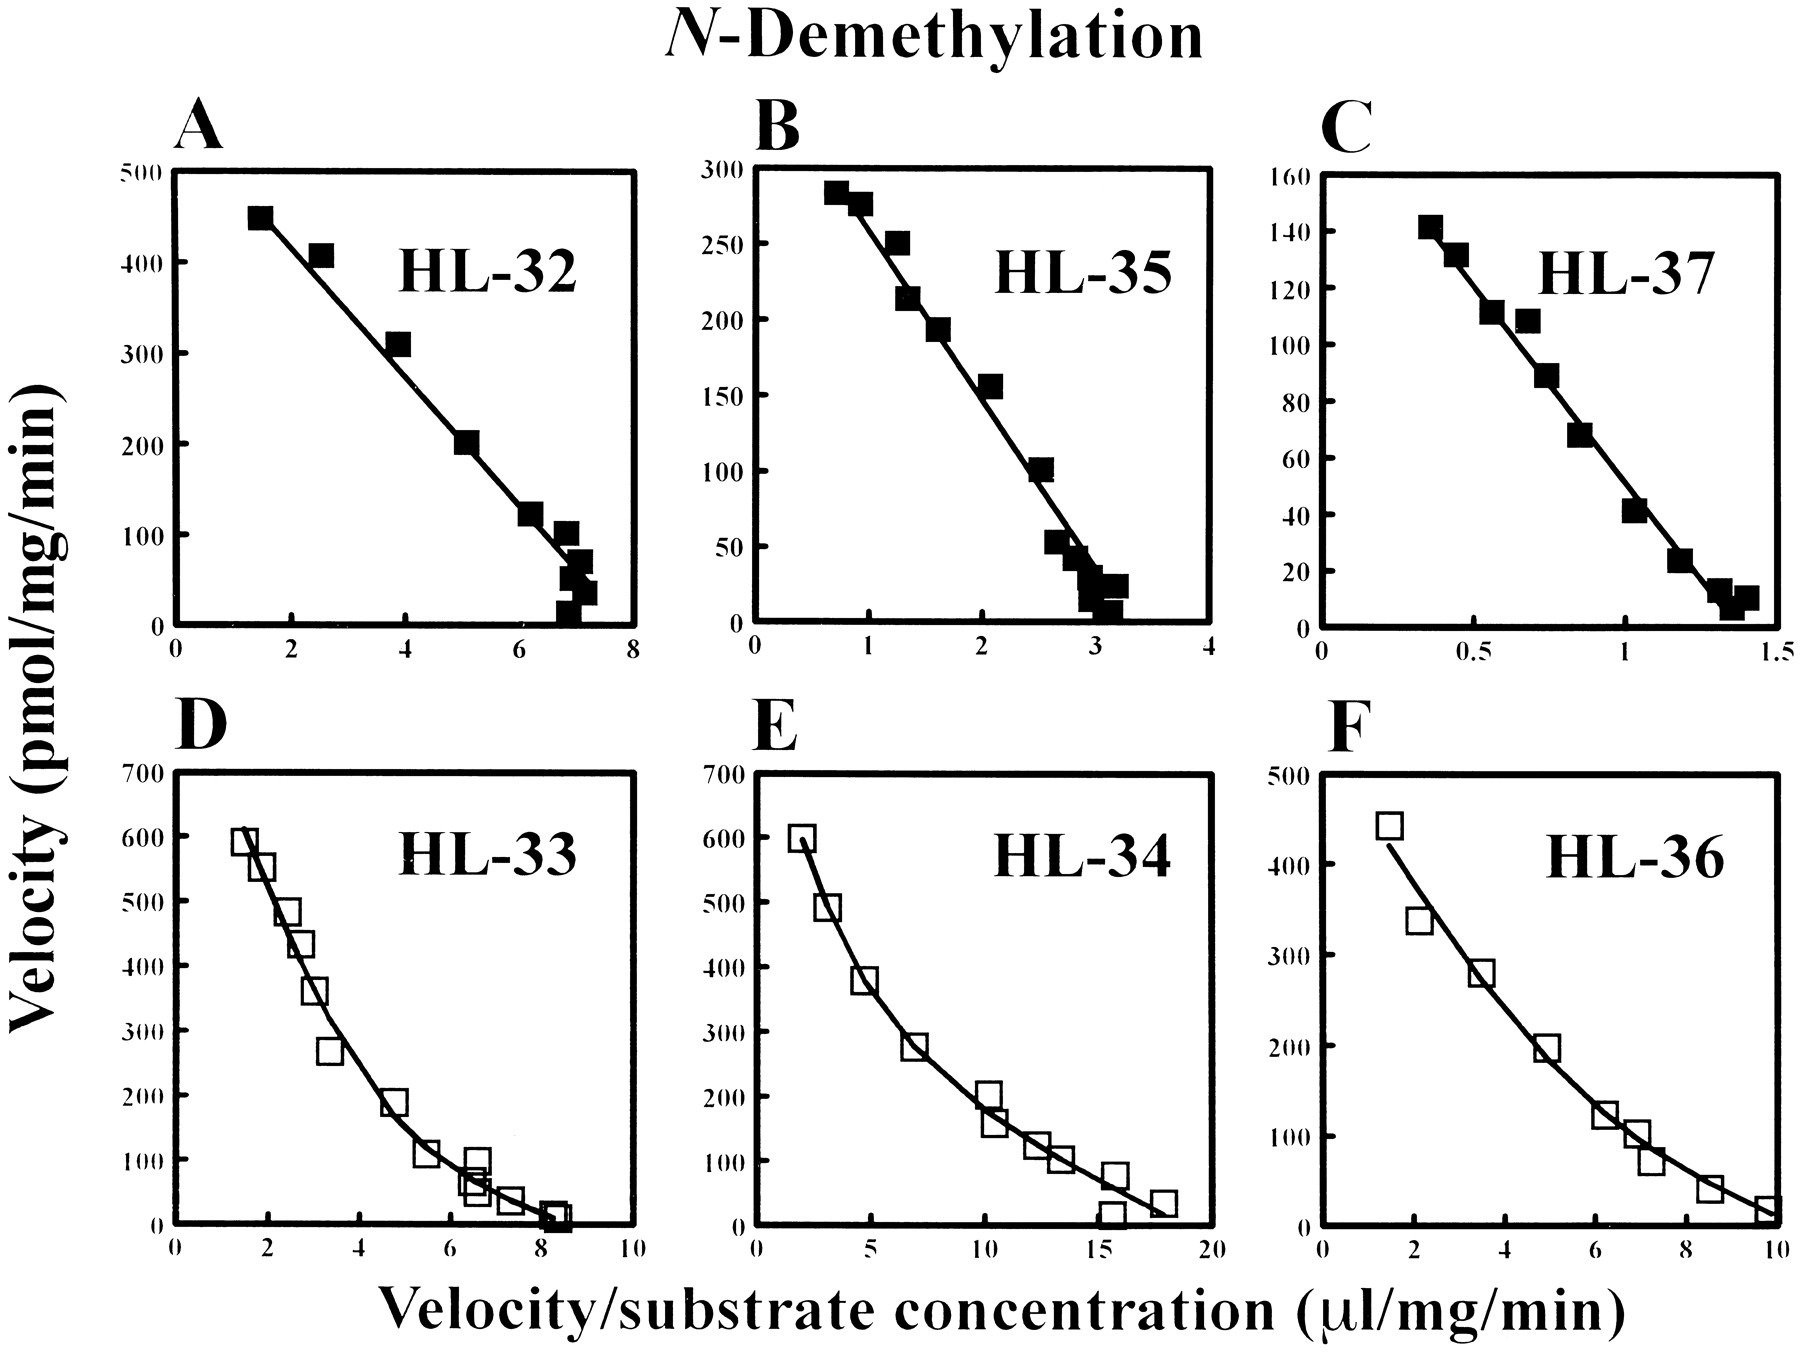
The individual Eadie-Hoffstee plots for the formation of DMI and 2-OH-IMI from IMI with microsomes obtained from six different human livers are shown in figures 1 and2 (A to F), respectively. The N-demethylation and 2-hydroxylation of IMI gave a biphasic relationship in microsomes from the putative EMs, except for the 2-hydroxylation in HL-36 (fig.2F), whereas the kinetics of the two metabolic reactions showed a monophasic profile in those from the putative PMs (figs. 1 and 2, A to C). These results suggest that at least two enzymes are involved in theN-demethylation and 2-hydroxylation of IMI in three and two microsomes, respectively, of the putative EM livers, but not in those of the three putative PM livers.

Individual Eadie-Hoffstee plots for theN-demethylation of IMI by human liver microsomes obtained from six different human livers. ▪ = data obtained from the putative PMs (panels A to C) and □ = data obtained from the putative EMs ofS-mephenytoin 4′-hydroxylation (D to F).

Individual Eadie-Hoffstee plots for the 2-hydroxylation of IMI by human liver microsomes obtained from six different human livers. Symbols are the same as those given in fig.1.
The 2-hydroxylation of DMI with microsomes from the six human livers showed a monophasic profile in the Eadie-Hoffstee plots (data not shown). The individual kinetic parameters of DMI 2-hydroxylation obtained from the putative S-mephenytoin EM and PM liver microsomes are listed in table 1. The intrinsic clearance, defined asV max/K m, for DMI 2-hydroxylation ranged from 5.3 to 103.1 μl/mg/min, and the microsomes of HL-36, where the 2-hydroxylation of IMI showed an apparent monophasic profile (fig. 2F), gave the highestV max/K m value (table 1). Although no in vitro criteria to discriminate between the EM and PM phenotypes of debrisoquine-type (i.e., CYP2D6-related) oxidation pharmacogenetics with use of DMI are known, it is assumed that all of the six liver microsomes came from the patients with an EM phenotype. This appears to be reasonable, because the frequency of the PMs of debrisoquine-type oxidation pharmacogenetics is quite low (<1%) in a Japanese population (Horaiet al., 1989; Nakamura et al., 1985).
Kinetic analysis of metabolic profiles of IMI by human liver microsomes.
Table 2 summarizes the individual and mean (± S.D.) kinetic parameters derived from the Michaelis-Menten theoretical analysis by using the two-enzyme kinetic approach (K m1, K m2,V max1, V max2,V max1/K m1 andV max2/K m2) and those derived from the one-enzyme kinetic approach (K m, V max andV max/K m) observed in microsomes from the six human livers.
Apparent Michaelis-Menten kinetic parameters of IMIN-demethylation and 2-hydroxylation in microsomes obtained from six different human livers
Inhibition study.
Shown in figure 3 are the mean inhibition study data on IMI N-demethylation using human liver microsomes obtained from two putative PMs and three putative EMs. Furafylline was a potent inhibitor of theN-demethylation in microsomes obtained from the two groups at the low concentration (fig. 3A). The IC50 values gave a large variability and ranged from 0.81 to >100 μM in the five different microsomes. The mean maximum inhibition produced by furafylline on IMI N-demethylation at the low concentration was 58% and 57% in microsomes obtained from the PMs and EMs, respectively. However, furafylline produced a weaker inhibitory effect at the high (fig. 3B) than at the low concentration (fig. 3A). On the other hand, S-mephenytoin inhibited theN-demethylation by 47% in microsomes obtained from the EMs, whereas no inhibitory effect was discernible in those obtained from the PMs at the low concentration (fig. 3C). In contrast, no inhibitory effect by S-mephenytoin on the N-demethylation was seen at the high concentration in microsomes of the two phenotype groups (fig. 3D). Quinidine exhibited a weak inhibition (by about 20%) at the low concentration in the EM group and (by around 15%) at the high concentration in the two groups (fig. 3E and F), respectively. TAO produced a weak inhibition (by <17%) in microsomes from the PMs at the low concentration (fig. 3G), whereas the mean maximum inhibitory effects were about 30% and 35%, respectively, in microsomes obtained from the PMs and EMs at the high concentration (fig. 3H).

Effects of selective CYP inhibitor and/or substrate probes on the N-demethylation of IMI by human liver microsomes. Data are the mean values of experiments performed with microsomes obtained from the putative PMs (▪, n = 2) and EMs (□, n = 3).
Figure 4 shows the inhibition study data with respect to IMI 2-hydroxylation. Quinidine inhibited the 2-hydroxylation almost completely in all microsomes at the low concentration (fig. 4E). The mean IC50 values were 0.026 and 0.047 μM, and the maximum inhibitory effects were 95% and 93% in microsomes obtained from the PMs and EMs, respectively. On the other hand, the extent of inhibition on the 2-hydroxylation by quinidine tended to be weaker at the high concentration (400 μM) (fig. 4F) than at the low concentration (2 μM) (fig. 4E). Except for quinidine, none of the inhibitor/substrate probes produced inhibitory effects in excess of 20% on IMI 2-hydroxylation.

Effects of specific CYP inhibitor and/or substrate probes on the 2-hydroxylation of IMI by human liver microsomes. Data are the mean values of experiments performed with microsomes obtained from the putative PMs (▪, n = 2) and EMs (□,n = 3).
Recombinant human CYP isoform study.
Microsomes from yeast cell lines expressing each of 11 human CYP isoforms were examined in terms of the abilities of individual CYPs to catalyze IMIN-demethylation and 2-hydroxylation at the low (2 μM) and high concentrations (400 μM) (table 3). Among the CYP isoforms studied, a substantial catalytic activity for theN-demethylation at the low and high concentrations was observed mainly for CYP2C19 and 2C18. In addition, certain activities for the N-demethylation were detected for CYP1A2, 2D6, 3A4 and 2B6 (>10 pmol/pmol P450/10 min). On the other hand, CYP2D6 and 2C19 exhibited a potent catalytic activity for the 2-hydroxylation at the low concentration. Furthermore, CYP1A2, 2C18, 2B6 and 3A4 showed an appreciable activity for the 2-hydroxylation at the high concentration of IMI (table 3).
IMI N-demethylase and 2-hydroxylase activities in microsomes of yeast cells expressing each CYP isoform
Eadie-Hoffstee plots for IMI N-demethylation and 2-hydroxylation in microsomes from yeast cell lines expressing each of CYP1A2, 2B6, 2C19, 2C18, 2D6 and 3A4 are shown in figures5 and 6, respectively. Their plots, except for the N-demethylation by CYP2C18 (fig. 5C) and 3A4 (fig. 5F) and the 2-hydroxylation by CYP2C18 (fig. 6B), exhibited a typical Michaelis-Menten kinetic profile. The mean kinetic parameters estimated from each of the CYP isoforms using the Michaelis-Menten kinetic equation are listed in table 4. The data shown in figure 5C and F and figure 6B were fitted by using a sigmoidV max function equivalent to the Hill equation. The mean apparent kinetic parameters derived from the Hill equation are summarized in table 5.

Representative Eadie-Hoffstee plots for theN-demethylation of IMI by microsomes obtained from yeast cells expressing cDNA of CYP1A2 (panel A), 2B6 (panel B), 2C18 (panel C), 2C19 (panel D), 2D6 (panel E) and 3A4 (panel F). Data for the remaining five CYP isoforms are not shown, because these isoforms did not show the catalytic activities.
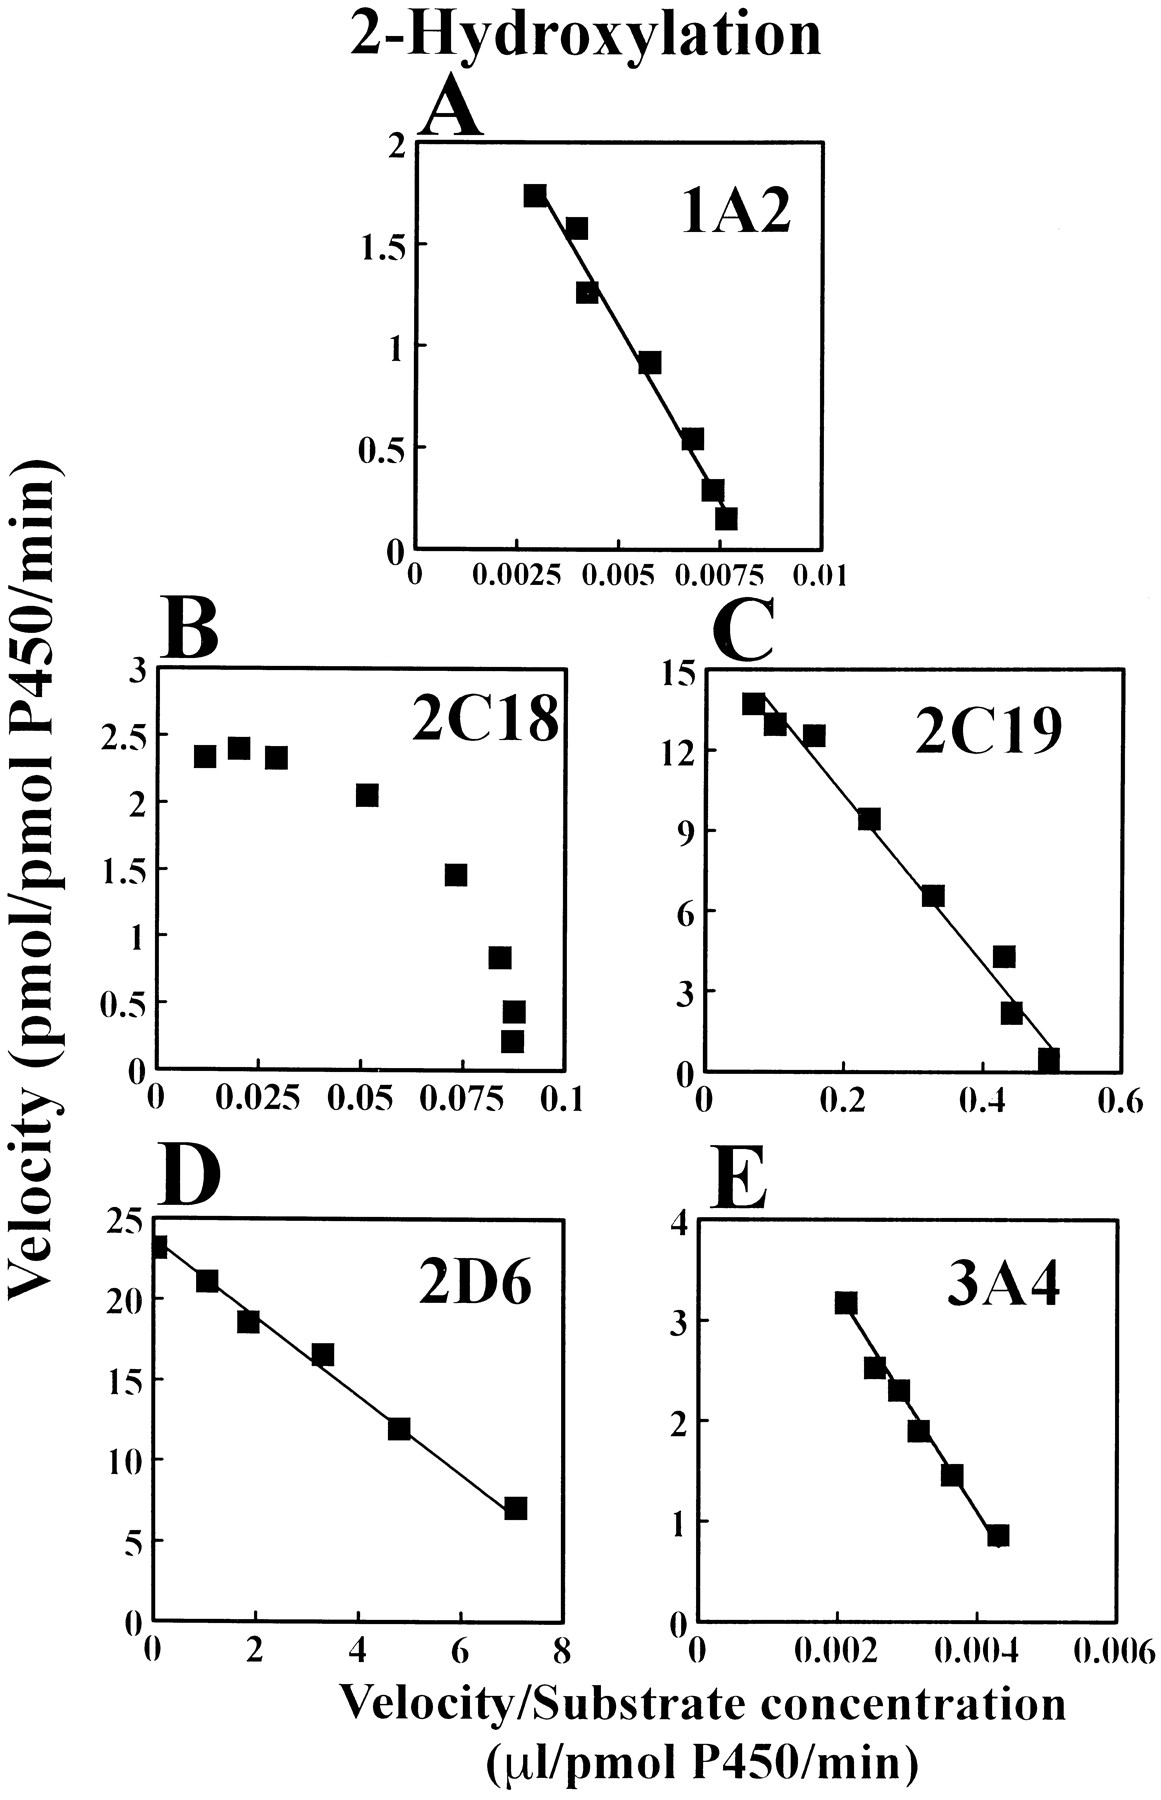
Representative Eadie-Hoffstee plots for the 2-hydroxylation of IMI by microsomes obtained from yeast cells expressing cDNA of CYP1A2 (panel A), 2C18 (panel B), 2C19 (panel C), 2D6 (panel D) and 3A4 (panel E). Data for the remaining six CYP isoforms are not shown, because these isoforms did not show the catalytic activities.
Apparent Michaelis-Menten kinetic parameters of IMIN-demethylation and 2-hydroxylation in microsomes obtained from yeast cells expressing each CYP isoform
Apparent kinetic parameters of IMI N-demethylation and 2-hydroxylation in microsomes obtained from yeast cells expressing each CYP isoform according to a Hill equation
The mean apparent K m andV max/K m values of theN-demethylation obtained from recombinant human CYP2C19 were lower and greater, respectively, than those from other CYP isoforms (CYP1A2, 2B6 and 2D6) (table 4). Although the kinetic data derived from the different CYPs should not be directly compared because different kinetic-analysis models were used in the study, the meanV max value for IMI N-demethylation was the greatest obtained from CYP2C19 in the rank order of CYP1A2, 2C18, 2D6, 2B6 and 3A4 (tables 4 and 5). The meanK m value of the N-demethylation obtained from the recombinant human CYP2C19 (table 4) was close to that of the high-affinity component (K m1) from theS-mephenytoin EM liver microsomes (table 2), whereas the mean K m value of the isozyme responsible for the low-affinity component (K m2) of theN-demethylation in the EM liver microsomes (table 2) approximated that obtained from the recombinant human CYP1A2 (table 4).
CYP2D6 had the lowest K m and the highestV max/K m values for IMI 2-hydroxylation (table 4). The mean V max values obtained from 2D6 and 2C19 were 3 to 10 times greater than those from other CYP isoforms (CYP1A2, 2C18 and 3A4) (tables 4 and 5). The meanK m values for the 2-hydroxylation in human liver microsomes (K m1 from the EM livers andK m from the PM livers, table 2) were nearly equal to that obtained from the recombinant human CYP2D6 (table 4). In addition, the mean K m value of the 2-hydroxylation obtained from CYP2C19 (table 4) approximated that for the low-affinity component (K m2) obtained from the S-mephenytoin EM liver microsomes (table 2).
Discussion
The results of our study with human liver microsomes and recombinant human CYP isoforms, taken together, revealed that CYP2C19 and 1A2 are primarily responsible for IMI N-demethylation at the therapeutically relevant concentration in vivo (2 μM) in microsomes obtained from the S-mephenytoin EM livers, whereas the extent of the contribution of CYP3A4 to this metabolic pathway appears to be minor, if any, in microsomes obtained from the EM and PM livers. However, because certain inhibition occurred for IMIN-demethylation by TAO in microsomes of the EM and PM livers at the high IMI concentration (400 μM) (fig. 3H), CYP3A4 appears to be responsible for the N-demethylation at the highly toxic concentration in vivo. In addition, IMI 2-hydroxylation is mediated mainly via CYP2D6 and partially viaCYP2C19 in microsomes of the EM livers. Thus at least two CYP isoforms are involved in the two pathways of IMI in microsomes of the EM livers (i.e., CYP2C19 and 1A2 in the N-demethylation and CYP2D6 and 2C19 in the 2-hydroxylation). This contention appears to be compatible with an apparently biphasic kinetic profile (except for one case in the 2-hydroxylation) in the two metabolic reactions of IMI observed for the EM livers (figs. 1 and 2). On the other hand, in microsomes of the S-mephenytoin PM livers, IMI has to be metabolized by the non-CYP2C19 component isoform(s). In this respect, our human microsomal study suggests that CYP1A2 and 2D6 are most likely to be the isoforms involved in the N-demethylation and 2-hydroxylation, respectively, in microsomes of the PM livers. This contention is not inconsistent with a monophasic kinetic profile in the two metabolic reactions of IMI observed in the three PM livers (figs. 1and 2). On the basis of the overall results obtained from our in vitro study, we wish to propose a scheme for the CYP isoforms involved in the two major pathways of IMI by microsomes from the two genetically determined CYP2C19-related livers (fig. 7). This scheme is proposed mainly on the basis of the human liver microsomal study data observed at a near-therapeutic IMI concentration (i.e., 2 μM).

Proposed scheme for the involvement of CYP isoforms in the two metabolic pathways of IMI in human liver microsomes of EMs and PMs of S-mephenytoin 4′-hydroxylation. The major CYP isoforms are designated with boldface letters, whereas the minor ones are in parentheses. The isoenzyme activities detected only in the recombinant human CYP isoform study (e.g., CYP2B6 and 2C18) are not taken into account in this scheme. Thus the CYP isoforms proposed to be involved in each of the metabolic pathways are derived mainly from the human liver microsomal study with use of the low or near-therapeutic concentration of IMI (2 μM) and partly from the recombinant human CYP isoform study, in which the corresponding isoform activities are detectable.
As shown in figure 3C, the inhibition of IMI N-demethylation by S-mephenytoin in microsomes obtained from the EM livers was <50% at the low concentration, whereas no inhibition was observed in those from the PM livers. This finding indicates that IMI isN-demethylated partially by CYP2C19 in microsomes of the EM livers. In addition, the consistency of the meanK m values between the high-affinity component enzyme obtained from the S-mephenytoin EM liver microsomes (table 2) and recombinant human CYP2C19 (table 4) provides evidence for the involvement of this CYP isoform in IMI N-demethylation. Accordingly, these results suggest that CYP2C19 is involved partially in the N-demethylation in the EM liver microsomes and that the non-CYP2C19 component isoform(s) might have played a dominant role in this pathway in the PM liver microsomes. Thus our in vitro results strongly support previous in vitro (Chibaet al., 1994) and in vivo studies (Skjelboet al., 1991; Koyama et al., 1994, 1996) showing that IMI is N-demethylated partially by CYP2C19 in humans.
Furafylline, a CYP1A2 inhibitor (Kunze and Trager, 1993; Tassaneeyakulet al., 1993), exhibited a potent inhibitory effect on IMIN-demethylation by about 60% in microsomes obtained from both the EM and PM livers at the low concentration (fig. 3A), whereas quinidine showed a weak (about 20%) inhibitory effect on theN-demethylation at the low concentration in microsomes of the EM livers (fig. 3E). TAO also showed a weak (<17%) inhibitory effect on this pathway only in microsomes of the PM livers at the low IMI concentration (fig. 3G). These findings indicate that CYP1A2 is another isoform involved in IMI N-demethylation in microsomes of the EM livers and plays a major role in this pathway in those of the PM livers at a near-therapeutic concentration of IMI (fig.7). However, the possibility cannot be excluded that CYP2D6 and 3A4 are partially involved in IMI N-demethylation by microsomes of the EM and PM livers, respectively (fig. 7). In addition, the data shown in fig. 3B suggest that CYP1A2 is responsible for theN-demethylation at the high IMI concentration (400 μM), a result that agrees with an in vitro human liver microsomal study by Lemoine et al. (1993), who used a high IMI concentration (500 μM) in their inhibition experiments.
The discrepancy with respect to the possible involvement of CYP2C19 in IMI N-demethylation in human liver microsomes between the present and previous studies (Lemoine et al., 1993; Skjelbo and Brøsen, 1992) appears to arise from the differences in the IMI concentrations used in the respective in vitro experiments. Their findings were obtained by using the high substrate concentrations (e.g., 500 and 128–500 μM IMI, respectively), whereas our study was performed at the low drug concentration (2 μM), which was about twice as close to the therapeutic plasma concentration range of IMI (i.e., 200–300 ng/ml or about 0.7–1.1 μM) (Eilers, 1995; Preskorn et al., 1993). We selected the high concentration (400 μM) as a counterpart in order to confirm the previous in vitro observations cited above. We observed thatS-mephenytoin inhibited the N-demethylation by 50% at the low IMI concentration in microsomes of the EM livers (fig.3C), whereas it elicited no inhibition at the high concentration (fig.3D). The latter finding is in agreement with that reported by Skjelbo and Brøsen (1992). In contrast, the extent of the maximum inhibition on the N-demethylation by TAO, a CYP3A4 inhibitor (Watkinset al., 1985), was significantly (P < .01) greater at the high (33 ± 11%, fig. 3H) than at the low concentration (11 ± 11%, fig. 3G), which suggests that the contribution of CYP3A4 to the N-demethylation would increase with the increasing substrate concentrations. Thus this finding accounts for that of the previous studies (Lemoine et al., 1993; Ohmori,et al., 1993) indicating that CYP3A4 is partially involved in the N-demethylation at the higher IMI concentration (500 and 142 μM, respectively). In this respect, we wish to assert that using a substrate concentration near the therapeutic range in anin vitro study is important for extrapolating the findings to an in vivo situation regarding the search for the possible candidate CYP isoform(s) involved in the metabolic pathway(s) of a drug. Yasumori et al. (1993) and Pearce et al. (1996) have also observed seemingly paradoxical or discrepant results on drugs known to be metabolized by CYP2C19 (i.e., diazepam and lansoprazole, respectively) depending on the different substrate concentrations used for their in vitro human microsomal experiments.
Quinidine inhibited the 2-hydroxylation of IMI almost completely (fig.4), but not the N-demethylation, at the low concentration (fig. 3), and therefore CYP2D6 is involved dominantly in IMI 2-hydroxylation at the near-therapeutic concentration (fig. 7). This supports the findings from previous in vitro human liver microsomal (Brøsen et al., 1991) and in vivopanel studies (Brøsen and Gram, 1988; Brøsen et al., 1986aand b; Skjelbo et al., 1991; Koyama et al., 1994) that IMI is 2-hydroxylated by CYP2D6. On the other hand, the meanK m andV max/K m values for IMIN-demethylation obtained from recombinant human CYP2D6 were lower and higher, respectively, compared with other human CYPs except for CYP2C19 (table 3). However, the respective CYP2D6 and 2C19 contents are about 1.5% (Shimada et al., 1994) and 0.5% (Goldsteinet al., 1994; personal communication with Dr. Goldstein, J.A., National Institutes of Environmental Health Sciences, Research Triangle Park, NC) relative to the total CYPs in human livers. When theV max/K m value derived from recombinant human CYP2D6 is adjusted by the CYP2D6 content in human liver microsomes (Shimada et al., 1994), the value is found to be 0.8 times equivalent to that derived from recombinant CYP2C19. Nevertheless, the mean K m andV max/K m values for IMI 2-hydroxylation obtained from CYP2D6 (table 3) were 22 times smaller and 40 times greater, respectively, than those of theN-demethylation (table 4), which suggests that CYP2D6 may have a marked regio-selectivity for the metabolism of IMI. Thus the contribution of CYP2D6 to the N-demethylation is considered to be much less important than its contribution to the 2-hydroxylation.
No inhibitor/substrate probes except quinidine substantially influenced IMI 2-hydroxylation in microsomes obtained from the EM and PM livers (fig. 4). The consistency of the mean K m values for the 2-hydroxylation between the high-affinity component enzyme in human liver microsomes (K m1 from the EM andK m from the PM livers, table 2) and recombinant human CYP2D6 (table 4) further confirms that CYP2D6 plays a major role in IMI 2-hydroxylation. On the other hand, the meanK m value for the 2-hydroxylation for the low-affinity component (K m2 in the EM andK m in the PM livers, table 2) approximated that of recombinant human CYP2C19 (table 4). In addition, the meanV max/K m value obtained from recombinant human CYP2C19 was 60 times or 95 times greater, respectively, than that from the CYP1A2 or 3A4 (table 4), which suggests that the non-CYP2D6 component isoform involved in IMI 2-hydroxylation in microsomes of the EM livers appears to be CYP2C19 (fig. 7). However, the contribution of CYP2D6 to the 2-hydroxylation would be much greater than that of CYP2C19 and should account for at least 90% of this metabolic pathway, because the meanV max/K m value obtained from CYP2D6 was 20 times greater than that from CYP2C19 (table 4). Moreover, the one-enzyme kinetic profile of IMI 2-hydroxylation (fig.2F) obtained from HL-36 (an S-mephenytoin EM liver), which showed the greatest V max andV max/K m values for DMI 2-hydroxylation [mediated via CYP2D6 (Spina et al., 1984)] among the six livers (table 1), may suggest the more dominant contribution of CYP2D6 to the 2-OH-IMI formation compared with other S-mephenytoin EM livers (HL-33 and HL-34) that showed a two enzyme-kinetic profile of IMI 2-hydroxylation (fig. 2D and E). This suggestion appears to be supported, because theV max/K m ratio of DMI 2-hydroxylation (CYP2D6) to S-mephenytoin 4′-hydroxylation (CYP2C19) obtained from HL-36 (the ratio = 10.4) was much greater than those from the other two livers (the ratios = 2.4 and 3.7 in HL-33 and HL-34, respectively, as calculated from the data in table 1). Therefore, it would be difficult to discern a biphasic behavior in the Eadie-Hoffstee plots in the HL-36 microsomes, even if it might have occurred via a minor contribution of CYP2C19 to IMI 2-hydroxylation.
We observed an atypical kinetic profile for theN-demethylation by CYP3A4 and 2C18 and for the 2-hydroxylation by CYP2C18 (figs. 5 and 6), which suggests that these metabolic reactions may be related to a positive cooperativity in the substrate activation as discussed below. By reconciling the Akaike’s information criterion (Akaike, 1974), we found that these data were better fitted to the Hill than to the Michaelis-Menten equation. The former equation reflects a setting where binding sites can cooperate with each other, and the coefficient N represents the degree of cooperativity (thus N should predict the number of binding sites per enzyme molecule). There is evidence for the binding of two substrate molecules in the CYP3A4 active sites (Shou et al., 1994). Furthermore, CYP3A4 exhibits a positive cooperativity for diazepam 4-hydroxylation and N-demethylation (Anderssonet al., 1994) as well as for amitriptylineN-demethylation (Schmider et al., 1995). Accordingly, our finding (fig. 5F) suggests that the CYP3A4-catalyzed IMI N-demethylation is activated by IMI.
Incubations with cDNA-expressed CYP2C18 revealed its relatively high catalytic activity toward IMI (table 3). As indicated by the atypical Eadie-Hoffstee plots for IMI N-demethylation (fig. 5C) and 2-hydroxylation (fig. 6B), the data were also fitted to the Hill equation. The mean N value for CYP2C18 was equivalent to that for CYP3A4 (table 5), which indicates that CYP2C18 may function as an allosteric enzyme in the metabolism of IMI. TheS-mephenytoin 4′-hydroxylation mediated by CYP2C19 in human liver microsomes is known to be slightly dependent on CYP2C18 (Goldstein and de Morais, 1994). Thus the inhibitory effect on theN-demethylation by S-mephenytoin in microsomes of the EM livers (fig. 3) might be attributable to a competitive inhibition at CYP2C19 and 2C18, although the present study revealed nothing about the extent of the contribution of CYP2C18 to theN-demethylation relative to CYP2C19. However, CYP2C18 cannot be detected in the majority of human liver microsomes using its antibody, and its content, even if it exists, is much lower than that of CYP2C19 (personal communication with Dr. J.A. Goldstein). Thus CYP2C18 would play a minor role, if any, compared with CYP2C19 in the metabolism of IMI.
In conclusion, our study with human liver microsomes and recombinant human CYP isoforms indicates that IMI N-demethylation is mediated mainly by CYP2C19 and CYP1A2 and that 2-hydroxylation exclusively by CYP2D6 and partially by CYP2C19 at the near-therapeutic IMI concentration in microsomes of the S-mephenytoin EM livers (fig. 7). These two major metabolic reactions of IMI appear to be catalyzed mainly by CYP1A2 (partially by CYP3A4) and CYP2D6, respectively, in microsomes of the S-mephenytoin PM livers (fig. 7). These results suggest the importance of an appropriate selection of the substrate or drug concentration, which may be attained as a near-therapeutic level after the usual clinical dose(s) of a drug, in order to assess what CYP isoform(s) are involved in the metabolism of that drug in humans.
Acknowledgments
The authors are grateful to Ciba-Geigy Ltd. (Basel, Switzerland) for the generous donation of 2-OH-IMI HCl and 2-OH-DMI oxalate and to Organon (Oss, the Netherlands) for that of mianserin as the respectivein vitro assay standards used in the present study. We also thank Dr. Küpfer (University of Bern, Bern, Switzerland) for his donation of rac-mephenytoin, Sumitomo Kagaku (Osaka, Japan) for the donation of eleven recombinant human CYP isoforms, Mr. Atsushi Nishiwaki and Dr. Hiroyuki Yokoyama for their statistical support and Ms. Michika Tanizaki for her excellent technical assistance.
Footnotes
-
Send reprint requests to: Takashi Ishizaki, M.D., Ph.D., Department of Clinical Pharmacology, Research Institute, International Medical Center of Japan, Toyama 1-21-2, Shinjuku-ku, Tokyo 162, Japan.
-
↵1 This study was supported by a grant-in-aid from Drug Innovation Science Project (1-2-10) and from the Ministry of Human Health and Welfare, Tokyo, Japan.
-
↵2 Present address: Department of Clinical Pharmacology, Research Institute, International Medical Center of Japan, Tokyo, Japan.
-
↵3 Present address: Laboratory of Biochemical Pharmacology and Toxicology, Faculty of Pharmaceutical Sciences, Chiba University, Chiba, Japan.
-
↵4 Present address: Division of General Surgery, International Medical Center of Japan, Tokyo, Japan.
- Abbreviations:
- CYP
- cytochrome P450
- ECD
- electrochemical detection
- DMI
- desipramine
- EM
- extensive metabolizer
- IMI
- imipramine
- PM
- poor metabolizer
- rac
- racemate
- R/S
- enantiomeric ratio
- TAO
- troleandomycin
- 2-OH-IMI
- 2-hydroxyimipramine
- 2-OH-DMI
- 2-hydroxydesipramine
- Received September 30, 1996.
- Accepted February 4, 1997.
- The American Society for Pharmacology and Experimental Therapeutics


