


Abstract
(–)-(1R,2R)-3-(3-Dimethylamino-1-ethyl-2-methyl-propyl)-phenol hydrochloride (tapentadol HCl) is a novel μ-opioid receptor (MOR) agonist (Ki = 0.1 μM; relative efficacy compared with morphine 88% in a [35S]guanosine 5′-3-O-(thio)triphosphate binding assay) and NE reuptake inhibitor (Ki = 0.5 μM for synaptosomal reuptake inhibition). In vivo intracerebral microdialysis showed that tapentadol, in contrast to morphine, produces large increases in extracellular levels of NE (+450% at 10 mg/kg i.p.). Tapentadol exhibited analgesic effects in a wide range of animal models of acute and chronic pain [hot plate, tail-flick, writhing, Randall-Selitto, mustard oil colitis, chronic constriction injury (CCI), and spinal nerve ligation (SNL)], with ED50 values ranging from 8.2 to 13 mg/kg after i.p. administration in rats. Despite a 50-fold lower binding affinity to MOR, the analgesic potency of tapentadol was only two to three times lower than that of morphine, suggesting that the dual mode of action of tapentadol may result in an opiate-sparing effect. A role of NE in the analgesic efficacy of tapentadol was directly demonstrated in the SNL model, where the analgesic effect of tapentadol was strongly reduced by the α2-adrenoceptor antagonist yohimbine but only moderately attenuated by the MOR antagonist naloxone, whereas the opposite was seen for morphine. Tolerance development to the analgesic effect of tapentadol in the CCI model was twice as slow as that of morphine. It is suggested that the broad analgesic profile of tapentadol and its relative resistance to tolerance development may be due to a dual mode of action consisting of both MOR activation and NE reuptake inhibition.
Activation of opioid receptors, particularly the μ-opioid receptor (MOR), is one of the main options for the treatment of moderate-to-severe pain. MOR agonists are very effective against acute pain; however, they may be less effective against chronic pain of neuropathic or inflammatory origin, or they may have an unsatisfactory therapeutic window (Portenoy, 1996; Kalso et al., 2004). Since the isolation of morphine 200 years ago, a large number of morphine derivatives and other MOR agonists have been synthesized (Maul et al., 2002; Friderichs and Buschmann, 2002). One goal of this research was to separate the analgesic effect of MOR activation from side effects, such as nausea and emesis, constipation, respiratory depression, addiction, and dependence. However, cloning of the opioid receptors and the investigation of MOR knockout mice (Matthes et al., 1996) strongly suggest that both the analgesic activity and side effects of morphine-like analgesics are mediated by the same receptor (sub)type. Thus, a full dissociation of analgesia from side effects seems to be impossible within the class of selective MOR agonists.
Combining MOR agonism with monoamine reuptake inhibition is an approach to improve the therapeutic range of opioids. The different, complementary mechanisms of action may additively or even synergistically enhance the analgesic efficacy and/or attenuate the side effects of MOR agonists by reducing the requirement for MOR activation. The facilitation of monoaminergic transmission in descending pain inhibitory pathways in the spinal cord seems to be an important mechanism because compounds that block the reuptake of norepinephrine (NE) and/or serotonin (5-hydroxytryptamine [5-HT]) are efficacious in the treatment of chronic pain conditions (Carter and Sullivan, 2002; Tzschentke, 2002) and can enhance the analgesic effect of morphine (Ossipov et al., 1982). This is of particular relevance because neuropathic pain is generally considered to be relatively unresponsive to opiates (Mao et al., 2000) and/or difficult to treat effectively because of MOR-related side effects (Martin and Eisenach, 2001).
Attempts to circumvent this problem initially led to the development of tramadol. Tramadol is an atypical, racemic opioid that combines weak MOR activation with inhibition of 5-HT and NE reuptake (Raffa et al., 1992). This combination of complementary mechanisms of action results in potent analgesic activity. However, the underlying molecular basis of this effect is complex. Tramadol is metabolized to an active O-desmethyl-metabolite (Lintz et al., 1981). Both enantiomers and the O-desmethyl-metabolite are involved in the analgesic activity (Raffa et al., 1993), because NE reuptake inhibition resides mainly in the (–)-enantiomer and 5-HT reuptake inhibition resides in the (+)-enantiomer of the parent compound, whereas MOR agonistic activity resides in the (+)-enantiomer of O-desmethyl-tramadol and, to a lesser degree, in (+)-tramadol itself (Frink et al., 1996). Thus, the relative contribution of the different mechanisms of action to the overall analgesic effect changes over time. As the parent molecule is metabolized, the contribution of 5-HT and NE reuptake inhibition is reduced, whereas the contribution of MOR agonism increases, resulting in a complex time- and metabolism-dependent pattern of pharmacological activities. Because tramadol is mainly metabolized via cytochrome P450 2D6 (CYP2D6), which is polymorphic in humans, approximately 5 to 15% of the white population are “poor metabolizers” of tramadol and do not experience satisfactory analgesia with standard doses (Poulsen et al., 1996). Furthermore, preclinical and clinical evidence, with selective 5-HT reuptake inhibitors, selective NE reuptake inhibitors, and mixed 5-HT/NE reuptake inhibitors, indicates that analgesia is more readily obtained by NE reuptake inhibition than by 5-HT reuptake inhibition (Max et al., 1992; Briley, 2004). Finally, a compound without serotonergic activity would not bear the risk of producing or contributing to a serotonin syndrome (Boyer and Shannon, 2005).
Given this background, a molecule combining MOR affinity with NE reuptake inhibition in one chemical entity would be a major improvement of the combined mechanism of action approach because the full availability of MOR activity would no longer be dependent on metabolic activation, overall drug exposure would be reduced, and pharmacological activity would be limited to the two most relevant mechanisms of action. Moreover, because these two mechanisms would reside in a nonracemic molecule that does not form active metabolites, the relative contribution of the different mechanisms would not change over the course of metabolic transformation.
The chemistry program that was engaged yielded compounds with this desired novel dual activity. The present article presents the preclinical profile of one of these nonracemic compounds, (–)-(1R,2R)-3-(3-dimethylamino-1-ethyl-2-methyl-propyl)-phenol hydrochloride (tapentadol HCl) (Fig. 1), with respect to its in vitro characteristics and its analgesic, antihyperalgesic, and antiallodynic properties in rat and mouse models of acute and chronic pain.
Materials and Methods
Animals
Material for the in vitro studies was obtained from male Sprague-Dawley specific pathogen-free and Wistar specific pathogen-free rats (200 g) and male Pirbright-white guinea pigs (200–250 g) (Charles River, Sulzfeld, Germany). In vivo studies were conducted with male NMRI mice (20–35 g) and Sprague-Dawley rats (130–180 g) (Charles River; Iffa Credo, Brussels, Belgium; and Janvier, Le Genest St. Isle, France) (pain models) and with male Wistar rats (280–350 g) (Harlan, Horst, The Netherlands) (microdialysis). Animals were housed under standard conditions (room temperature 20–24°C, 12-h light/dark cycle, relative air humidity 45–70%, 15 air changes/h, air movement <0.2 m/s) with food and water available ad libitum, with the exception of the time of the experiment. All animals were used only once in all pain models, with the exception of the neuropathy models, in which they were tested repeatedly with a washout period of at least 1 week between tests. There were at least 5 days between delivery of the animals and the test day or surgery. Animal testing was performed in accordance with the recommendations and policies of the International Association for the Study of Pain (Zimmermann, 1983) and the German Animal Welfare Law. All study protocols were approved by the local government committee for animal research, which is also an ethics committee (in vitro and in vivo pain studies) and the animal care committee of the Faculty of Mathematics and Natural Science of the University of Groningen (microdialysis).
In Vitro Studies
Receptor Binding. Incubations with rat membrane suspensions from brain without cerebellum for MOR; brain without pons, medulla oblongata, and cerebellum for δ-opioid receptor (DOR); and brain without pons, medulla oblongata, cerebellum, and cortex for κ-opioid receptor (KOR) were carried out to equilibrium. Blanks to quantify nonspecific binding were obtained by saturating the binding sites with naloxone (10–5 M for MOR, 10–3 M for DOR, and 10–4 M for KOR). All incubations were run in triplicate and terminated by rapid filtration under mild vacuum (Brandel cell harvester type M-24 R; Brandel Inc., Gaithersburg, MD) and 2 washes of 5-ml buffer using FP-100 Whatman GF/B filter mats (Whatman Schleicher and Schuell, Keene, NH). The radioactivity of the samples was counted after a stabilization and extraction period of at least 15 h by use of the scintillation fluid Ready Protein (Beckman Coulter, Krefeld, Germany). For further details regarding DOR and KOR binding studies, see Frink et al. (1996).
The human MOR binding assay was run in microtiter plates (Costar 3632; Corning Life Sciences, Acton, MA) with wheat germ agglutinin-coated scintillation proximity assay beads (GE Healthcare, Chalfont St. Giles, Buckinghamshire, UK). A cell membrane preparation of Chinese hamster ovary-K1 cells transfected with the human MOR (RB-HOM) was purchased from PerkinElmer Life and Analytical Sciences (Beltsville, MD). [3H]Naloxone (PerkinElmer Life and Analytical Sciences, Brussels, Belgium) was used as a ligand for the MOR binding studies. As assay buffer for the binding studies, 50 mM Tris-HCl, pH 7.4, supplemented with 0.05% sodium azide was used. The final assay volume of 250 μl per well included 1 nM [3H]naloxone as a ligand and either test compound in dilution series or 25 μM unlabeled naloxone for determination of unspecific binding. The test compounds were diluted with 25% dimethyl sulfoxide in H2O to yield a final 0.5% dimethyl sulfoxide concentration, which served as a respective vehicle control. The assays were started by the addition of the beads (1-mg beads per well), which had been preloaded for 15 min at room temperature with human MOR membranes (23.4 μg/250 μl of final assay volume per well). After short mixing, the assays were run for 90 min at room temperature. The microtiter plates were then centrifuged for 20 min at 500 rpm, and the signal rate was measured by means of a 1450 MicroBeta Trilux liquid scintillation counter (PerkinElmer Life and Analytical Sciences–Wallac Oy, Turku, Finland). Half-maximal inhibitory concentration (IC50) values reflecting 50% displacement of [3H]naloxone-specific receptor binding were calculated by nonlinear regression analysis. Individual experiments were run in duplicate and were repeated three times in independent experiments.
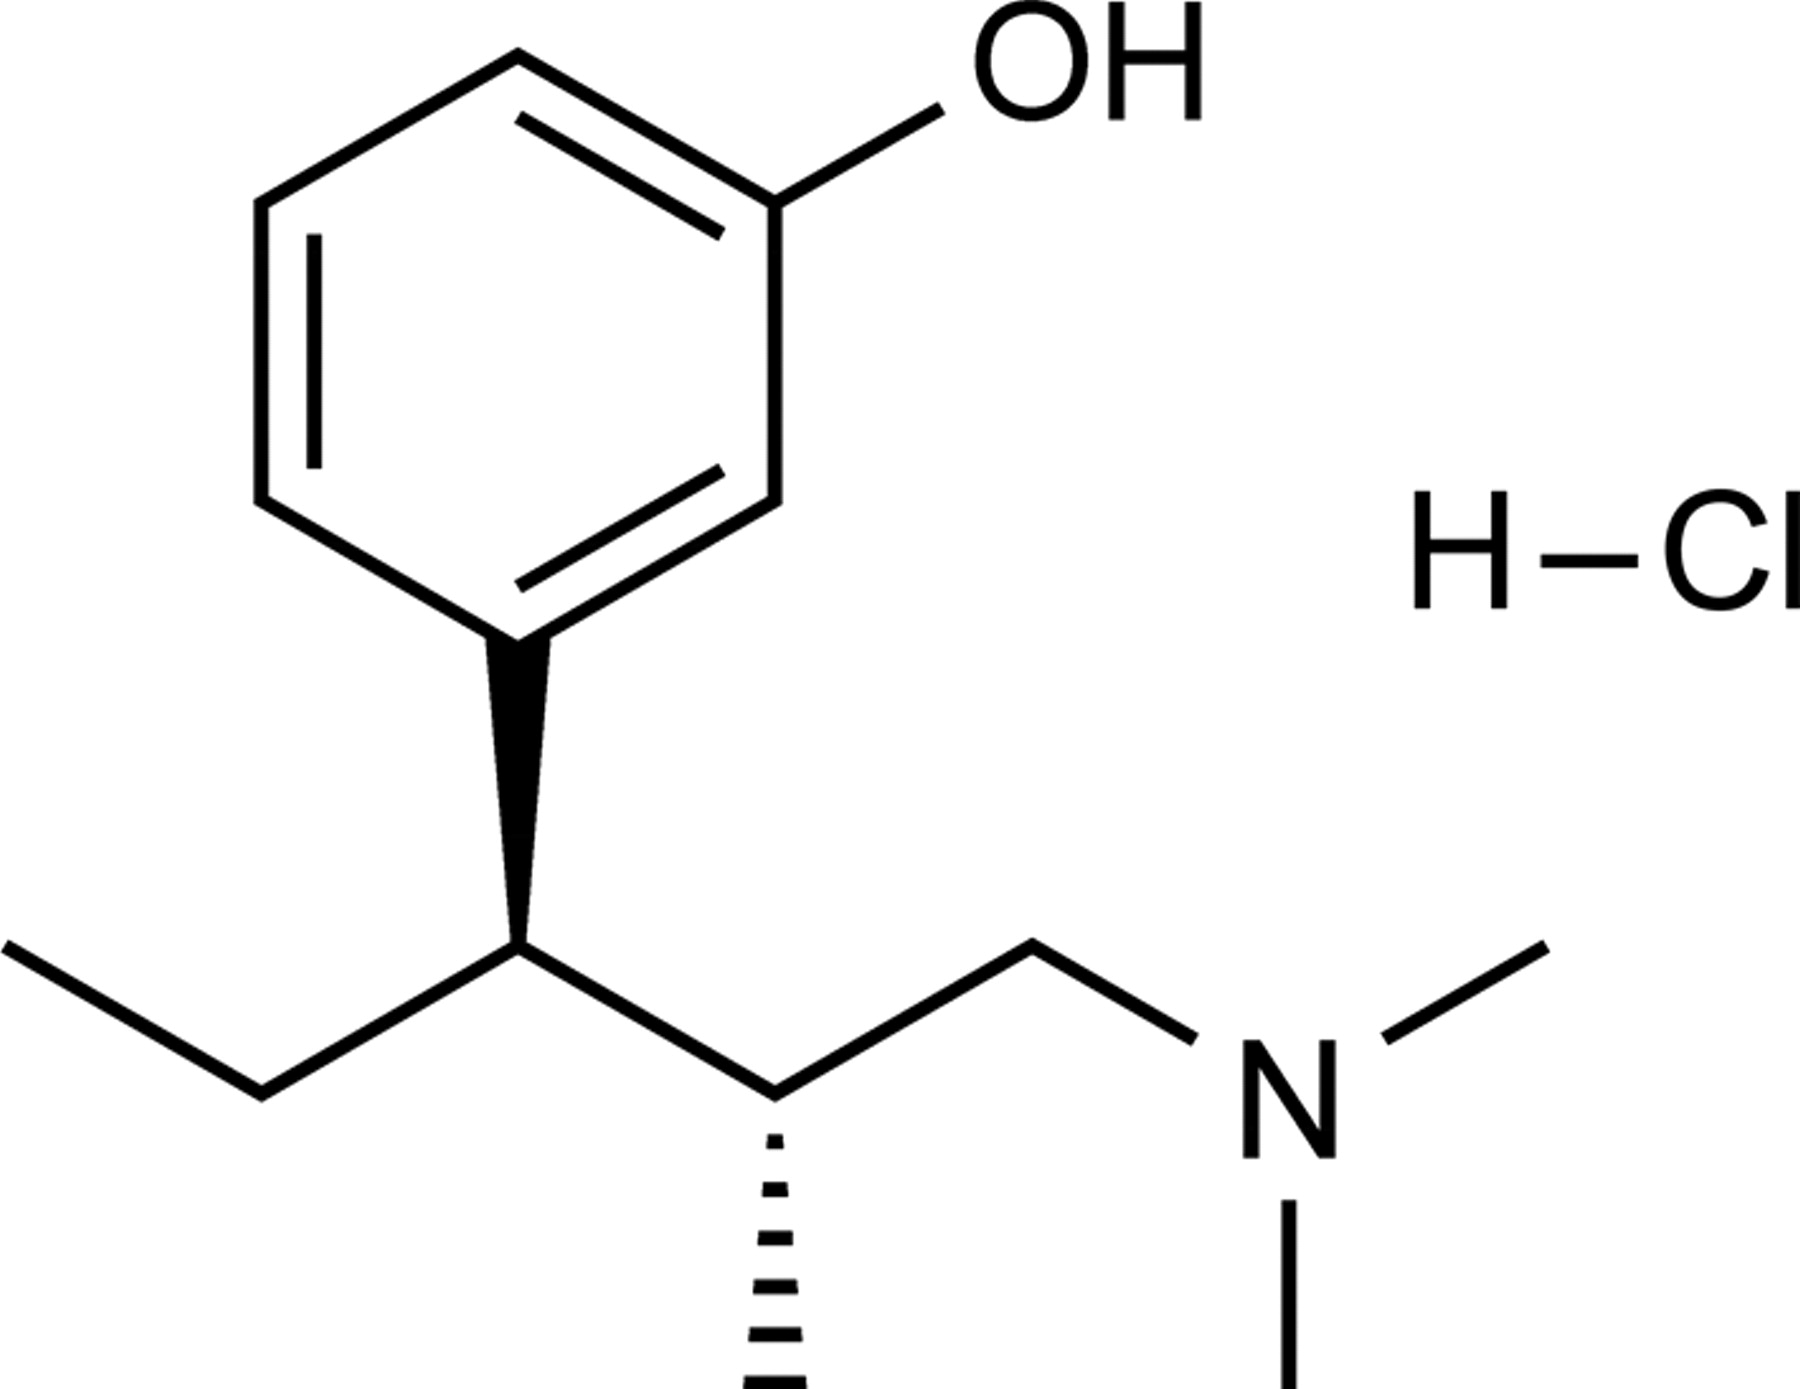
Chemical structure of tapentadol HCl.
Transporter Binding. Human recombinant NE and 5-HT transporter membranes were obtained from PerkinElmer Life and Analytical Sciences. The assays were performed in 96-well microtiter plates (PP; Costar 3632; Corning Life Sciences), essentially according to the product information given by the manufacturer (total assay volume: 250 μl). After incubation, the microtiter plate was filtered through a Unifilter GF/B microtiter plate (PerkinElmer Life and Analytical Sciences) and washed with ice-cold 50 mM Tris, 0.9% NaCl, pH 7.4, by use of a Brandel Cell Harvester MPXRI-96T. The Unifilter GF/B plate was dried at 55°C for 1 h. Afterward, a back seal (PerkinElmer Life and Analytical Sciences) was fixed on the plate, and 35 μl of scintillation fluid per well (Ultima Gold; PerkinElmer Life and Analytical Sciences) was added. After fixation of a top seal (PerkinElmer Life and Analytical Sciences), the radioactivity was determined (after an equilibration period of approximately 5 h) in a 1450 MicroBeta Trilux liquid scintillation counter.
Synaptosomal NE and 5-HT Uptake Inhibition. Methods were according to Frink et al. (1996). Rats were killed by decapitation. The tissue (hypothalamus for NE uptake, medulla oblongata and pons for 5-HT uptake) was homogenized in ice-cold 0.32 M sucrose (100 mg of tissue/1 ml) and centrifuged at 4°C for 10 min at 1000g. Subsequent centrifugation of the supernatant at 17,000g for 55 min yielded a pellet (P2), which was resuspended in 0.32 M glucose (∼0.5 ml/100 mg original weight). Incubations were run in triplicate. The synaptosomal suspension (50 μl) containing approximately 200 μg of protein for NE and 5-HT uptake transporters was added to 850 μl of incubation medium containing the drug to be tested and preincubated for 5 min at 37°C under an atmosphere of 5% CO2 in O2. Accumulation was started by the addition of the radioactive substrate to yield a concentration of 0.1 μM in a final volume of 1 ml. Uptake was stopped after 30 s in the case of [3H]5-HT and 60 s in the case of [3H]NE accumulation by the addition of 8 ml of ice-cold incubation medium, immediately followed by filtration through FP-100 Whatman GF/B filter mats using a Brandel cell harvester. Filters were washed with 5 ml of incubation medium and then extracted with Ready Protein (Beckman Coulter) for at least 15 h and counted for radioactivity. The incubation medium contained 119 mM NaCl, 3.9 mM KCl, 0.51 mM CaCl2, 0.65 mM MgSO4, 15.6 mM Na2HPO4, 3.4 mM NaH2PO4, 10 mM glucose, 0.57 mM ascorbic acid, and 0.0156 mM iproniazid. The pH was adjusted to 7.4 by the addition of NaOH (23°C). Values were corrected for accumulation of tritium at 0°C.
The uptake was also measured in 96-well microtiter plates (PP; Costar 3632; Corning Life Sciences). In this case, the volume was scaled down to 250 μl, and incubation was at room temperature. These conditions (without 5% CO2 in O2) are suitable for high-throughput screening campaigns. The incubation period for [3H]NE and [3H]5-HT uptake lasted 7.5 and 5 min, respectively. Blanks to quantify the nonspecific uptake were run in the presence of nisoxetine (10 μM) for [3H]NE and fluoxetine (100 μM) for [3H]5-HT uptake. Thereafter, the 96 samples were filtered through a Unifilter GF/B microtiter plate and washed with 200 ml of incubation buffer by use of a Brandel Cell Harvester MPXRI-96T. The Unifilter GF/B plate was dried at 55°C for 1 h. Afterward, a back seal (PerkinElmer Life and Analytical Sciences) was fixed on the plate, and 35 μlof scintillation fluid per well (Ultima Gold; PerkinElmer Life and Analytical Sciences) was added. After fixation of a top seal (PerkinElmer Life and Analytical Sciences), the radioactivity was determined (after an equilibration period of approximately 5 h) in a 1450 MicroBeta Trilux liquid scintillation counter.
Agonist-Stimulated [35S]GTPγS Binding. The [35S]guanosine 5′-3-O-(thio)triphosphate (GTPγS) assay was carried out as a homogeneous scintillation proximity assay as described by Gillen et al. (2000), with the following modifications. It was run in microtiter plates (Costar 3632; Corning Life Sciences), in which each well contained 1.5 mg of wheat germ agglutinin-coated scintillation proximity assay beads (GE Healthcare) in a final volume of 200 μl. To test the agonistic activity of test compounds on human recombinant MOR-expressing cell membranes from Chinese hamster ovary-K1 cells (PerkinElmer Life and Analytical Sciences), 10 μg of membrane proteins per assay were incubated with 0.1 nM [35S]GTPγS (GE Healthcare) and different concentration of agonists in buffer containing 20 mM HEPES, pH 7.4, 100 mM NaCl, 10 mM MgCl2, 1 mM EDTA, 1 mM dithiothreitol, 1.28 mM NaN3, and 1 μM GDP for 120 min at 25°C. The microtiter plates were thereafter centrifuged for 10 min at 2100 rpm in a GS6 microtiter plate centrifuge (Beckman Coulter) to sediment the beads. The bound radioactivity was determined after a delay of 15 min by means of a 1450 MicroBeta Trilux liquid scintillation counter. The enhancement of [35S]GTPγS binding above the basal activity was used to determine the potency (EC50) and the relative efficacy (percentage of maximal efficacy) of test compounds versus the reference compound morphine, which was set at 100%.
In Vivo Studies
In Vivo Intracerebral Microdialysis. These experiments were performed at Brains-on-Line (Groningen, The Netherlands). Surgery and microdialysis. Rats were anesthetized using 2.5% isoflurane (400 ml/min N2O; 600 ml/min O2). Lidocaine (10% m/v) was used for local anesthesia. The animals were fixed in a stereotaxic frame (David Kopf Instruments, Tujunga, CA), and home-made I-shaped probes were inserted into the ventral hippocampus (dialyzable length, 4 mm). Microdialysis probes were inserted according to Paxinos and Watson (1982) and secured with dental cement and screws. Coordinates of implantation were: posterior –5.3 mm, lateral +4.8 mm, and ventral –8.0 mm.
Experiments were performed 24 to 48 h after surgery. On the day of the experiment, animals were connected with flexible polyetheretherketone tubing to a microperfusion pump (Harvard Apparatus Inc., Holliston, MA) and perfused with artificial cerebrospinal fluid containing 147 mM NaCl, 3.0 mM KCl, 1.2 mM CaCl2, and 1.2 mM MgCl2 at a flow rate of 1.5 μl/min. Microdialysis samples (15-min fractions) were collected in mini-vials containing 7.5 μl of 0.02 M acetic acid, mixed, and placed in a chilled automatic injection apparatus (Gilson 231 autoinjector; Gilson, Villiers Le Bel, France).
Upon termination of the animals, brains were removed and fixed in 4% m/v solution of paraformaldehyde. The position of the probe was verified according to Paxinos and Watson (1982) by making coronal sections of the brain.
Analytics. NE was analyzed using high-pressure liquid chromatography (HPLC) with electrochemical detection. The HPLC pump (Shimadzu LC-10 AD; Shimadzu, Kyoto, Japan) was connected to a reversed-phase column (Thermo BDS Hypersil 150 × 2.1 mm, C18, 3 μm; Thermo Fisher Scientific, Waltham, MA) followed by an electrochemical detector (Antec Intro potentiostate; Antec, Leyden, The Netherlands) working at a potential setting of 500 mV versus Ag/AgCl reference. The mobile phase consisted of 4.1 g/l sodium acetate, 150 mg/l sodium octanesulfonic acid, 150 mg/l tetramethylamine, 150 mg/l EDTA, and 1.8% methanol, pH 4.1. The flow rate of the mobile phase was 0.35 ml/min and was delivered by a Shimadzu LC-10AD pump. The detection limit for NE was 1 fmol per 20-μl sample (signal-to-noise ratio, 3).
5-HT was analyzed by HPLC with electrochemical detection. Twenty-microliter samples were injected onto a reversed-phase column (Phenomenex Hypersil 3: 3 μm, 100 × 2.0 mm, C18; Bester BV, Amstelveen, The Netherlands) by an autoinjector (CMA/200 refrigerated microsampler; Carnegie Medicine, Stockholm, Sweden). The mobile phase consisted of 4.1 g/l sodium acetate, 500 mg/l EDTA, 50 mg/l heptane sulfonic acid, 4% methanol v/v, and 30 μl/l triethylamine at a pH of 4.65 and was delivered at a flow rate of 0.4 ml/min (Shimadzu LC-10 AD liquid chromatograph). 5-HT was detected electrochemically at a working potential of 500 mV versus Ag/AgCl (Antec Leyden, The Netherlands). The detection limit was 0.5 fmol of 5-HT per 20-μl sample (signal-to-noise ratio of 3).
Behavioral Studies
Experimental Procedures. Animals were assigned randomly to treatment groups. Different doses and vehicle were tested in a randomized fashion. Although the operators performing the behavioral tests were not formally “blinded” with respect to the treatment, they were not aware of the study hypothesis or the nature of differences between drugs. Models were selected to cover a range of different types and etiologies of pain.
Hot Plate. The hot plate test was adapted from Eddy and Leimbach (1953). The device consisted of an electrically heated surface and an open Plexiglas tube (17 cm high × 22 cm diameter) to confine the animals to the heated surface. The temperature was kept at 48.0 ± 0.5°C. Mice were placed on the hot plate, and the time until either licking of the hind paw or jumping occurred was recorded with a stopwatch. Animals were tested before and 30 min after drug administration. The predrug latencies were between 17 and 45 s. The maximal possible effect (MPE) was defined as the lack of a nociceptive response during the exposure to the heat stimulus. The percentage of MPE was calculated according to the formula: [(T1 – T0)/(T2 – T0)] × 100, where T0 and T1 were the latencies obtained before and after drug injection and T2 was the cut-off time (120 s).
Tail-Flick. The tail-flick test was carried out in rats using a modification of the method described by D'Amour and Smith (1941). The tail-flick latency, defined by the time (in seconds) to withdraw the tail from a radiant heat source (bulb, 8 V/50 W), was measured using a semiautomated device (BMG Labtech GmbH, Offenburg, Germany). The heat source was adjusted to produce a baseline tail-flick latency of 3 to 5 s. A cut-off time of 12 s was set to avoid tissue damage. The increase in tail-flick latency was defined as antinociception and calculated as % MPE according to the formula: [(T1 – T0)/(T2 – T0)] × 100, where T0 and T1 were the latencies obtained before and after drug application and T2 was the cut-off time. Animals were tested before and 20, 40, and 60 min after administration of the test compounds.
Randall-Selitto. The yeast model of inflammatory pain was performed according to Randall and Selitto (1957). For induction of inflammation, 0.1 ml of 20% yeast was injected s.c. into the plantar surface of the right hind paw of the rat. The mechanical nociceptive threshold was measured using an algesiometer (Ugo Basile, Comerio, Italy). The device generated a mechanical force with a linear increase over time. The force was applied to the dorsal surface of the inflamed rat hind paw via a cone-shaped stylus with a rounded tip (2 mm2). The nociceptive threshold was defined as the force (g) at which the rat vocalized (cut-off force 450g). Test compounds were given 4 h after yeast injection. The mechanical nociceptive threshold was measured before and at 15, 30, 45, and 60 min after drug or vehicle administration. The drug effects were expressed as % MPE calculated as follows: [(nociceptive threshold drug – nociceptive threshold control)/(cut-off – nociceptive threshold control) × 100].
Mustard Oil-Induced Visceral Pain. Acute colitis was induced by mustard oil (Laird et al., 2001), and animals were monitored in Plexiglas boxes (14.5 × 14.5 cm; height, 10 cm) on a grid. Rectal administration of mustard oil (50 μl, 3.5%) in mice induced spontaneous visceral pain behavior (scored as follows: 1 = licking of abdominal wall; 2 = stretching, squashing, mounting, backward-movement, or contraction of the flank muscles; number of reactions recorded 2–12 min after mustard oil) and referred hypersensitivity. Before rectal administration (baseline) and 20 min thereafter, the frequency of withdrawal reactions to the application of von Frey filaments to the abdomen was examined. Five filaments with stimulus intensities of 1, 4, 8, 16, and 32 mN were applied 10 times each in ascending order, and the number and intensity of the responses were recorded. The filament was applied for 1 to 2 s, with an inter-stimulus interval of 5 to 10 s. Consecutive stimulations were performed at different locations of the abdomen. Pretest values were subtracted from values taken 20 min after mustard oil for each individual animal. Besides the response frequency for the different von Frey stimuli (calculated for each animal, with 100% being animals responding to each of the 10 stimulations with the respective filament), referred allodynia (counting of withdrawal reactions against 10 stimulations on the abdomen with a 1 mN von Frey filament; 20 min after mustard oil) and referred hyperalgesia (counting and scoring of withdrawal reactions against 10 stimulations on the abdomen with a 16 mN von Frey filament; 20 min after mustard oil) were measured. Scoring of withdrawal reactions for hyperalgesia was as follows: 1 = lifting of abdomen, licking, movement; 2 = extrusion or flinching of hind paws, slight jumping, strong licking; 3 = strong jumping, vocalization. As control animals without colitis were unresponsive to the von Frey filament of 1 mN, this stimulus intensity was considered to be adequate for the testing of allodynia. One group of control animals received rectal administration of mustard oil vehicle; another group received drug vehicle before mustard oil. Drug or drug vehicle was given 5 min before rectal administration. ED50 values were calculated based on the number of spontaneous pain reactions, withdrawal reactions toward von Frey stimulation (1–32 mN), and scored withdrawal reactions (16 mN).
Spinal Nerve Ligation. The spinal nerve ligation (SNL) model of neuropathic pain was adapted from Kim and Chung (1992). Under pentobarbital anesthesia (Narcoren, 60 mg/kg i.p.), the left L5 and L6 spinal nerves were exposed by removing a small piece of the paravertebral muscle and a part of the left spinous process of the L5 lumbar vertebra. The L5 and L6 spinal nerves were then carefully isolated and tightly ligated with silk (NC-silk black, USP 5/0, metric 1; B. Braun Melsungen AG, Melsungen, Germany). After checking hemostasis, the muscle and the adjacent fascia were closed with sutures, and the skin was closed with metal clips. After surgery, animals were allowed to recover for 1 week. For the assessment of mechanical allodynia, which was stable for at least 5 weeks, the rats were placed on a metal mesh covered with a plastic dome and were allowed to habituate until exploratory behavior ceased. The threshold for mechanical allodynia was measured with an electronic von Frey anesthesiometer (Somedic AB, Hörby, Sweden). Animals were tested before and 0.5, 1, 3, and 30 h after administration of the test compounds. Withdrawal thresholds of the injured paws were assessed and expressed as % MPE comparing predrug threshold of ligated animals (i.e., 0% MPE) and control threshold of sham animals (i.e., 100% MPE). Drugs or vehicle were tested in weeks 1 to 5 after surgery (one test per week) in a counterbalanced within-group design.
Streptozotozin Model (Diabetic Polyneuropathy). The streptozotocin model of neuropathic pain was adapted from Courteix et al. (1993). Rats were injected with streptozotocin (75 mg/kg i.p.) dissolved in citrate solution, pH 4.6. Control animals received citrate solution. Diabetes was confirmed 1 week after injection by measurement of tail vein blood glucose levels with Hemoglukotest 20-800R glucose and a reflectance colorimeter (Roche Diagnostics, Mannheim, Germany). Animals with a blood glucose level of >17 mM were considered to be diabetic. Tests took place during weeks 3 and 4 after the induction of diabetes. At that time, the abnormal pain behavior was at a stable maximum (Courteix et al., 1993). Mechanical hyperalgesia was assessed using an algesiometer (Ugo Basile) by measuring withdrawal thresholds to an increasing pressure on the dorsal surface of the right paw via a cone-shaped pusher with a rounded tip (2 mm2). The cut-off was set at 250 g, and the behavioral readout was paw withdrawal, vocalization, or overt struggling. The reaction latencies were measured before and 15, 30, 45, and 60 min after administration of the test compounds. The value before administration of substance was used as 0% MPE, and 100% MPE represented full antihyperalgesic efficacy (i.e., cut-off).
Antagonism in the Writhing Model. Writhing was induced by i.p. injection of 0.35 ml of a 0.02% solution of phenylquinone according to the method described by Hendershot and Forsaith (1959). The characteristic writhing responses, such as stretching, twisting a hind leg inward, or contraction of the abdomen, were observed and counted from 5 to 20 min after phenylquinone administration. During this time, the animals were placed individually in observation boxes. Recording of the writhing reactions (with the help of a press-button counter) started 10 min after administration of the test compounds. Naloxone (0.001, 0.01, 0.1, and 1.0 mg/kg) was given 10 min before the respective agonist.
Antagonism in the Spinal Nerve Ligation Model. The experimental details were identical to those described above. In the antagonism experiments, yohimbine (2.15 mg/kg), naloxone (0.3 mg/kg), or vehicle was administered 5 min before tapentadol (10 mg/kg), morphine (6.81 mg/kg), or vehicle. Animals were tested before and 0.5, 1, and 3 h after drug administration. Drugs or vehicle were tested in weeks 1 to 4 after surgery.
Tolerance Development in the Chronic Constriction Injury Model. The chronic constriction injury model of neuropathic pain was adapted from Bennett and Xie (1988). Under pentobarbital anesthesia (Narcoren, 60 mg/kg i.p.), the right common sciatic nerve was exposed by blunt dissection at the level of mid-thigh, and four loose ligatures (softcatchrom USP 4/0, metric2; B. Braun Melsungen AG) were placed around the nerve, taking care not to interrupt the epineural circulation. Cold allodynia was tested on a metal plate cooled by a water bath to a constant temperature of 4°C. One week after surgery, individual baselines were determined. Animals were randomly assigned to three groups treated daily with vehicle or equipotent doses of tapentadol (6.81 mg/kg) or morphine (6.81 mg/kg). Cold allodynia was measured (by counting brisk paw withdrawal reactions) for 30 min after administration of test compounds on days 1, 2, 3, 5, 8, 10, 12, 15, 17, 19, 22, and 23 of the treatment. Treatment of all groups continued until full tolerance (i.e., lack of significant antiallodynic effect) against tapentadol was reached, i.e., day 23. ED50 values were determined in a separate group of chronic constriction injury (CCI) rats that was tested before and 15, 30, 45 and 60 min after drug administration. % MPE of each time point was calculated according to the formula: [(T0 – T1)/T0] × 100, where T0 and T1 were numbers of paw withdrawal reactions before and after drug administration, respectively.
Data Analysis
In Vitro Studies. IC50 values were calculated using the computer software “Figure P” (version 6.0c; Biosoft, Cambridge, UK), and Ki values were obtained using the Cheng-Prusoff equation. Equilibrium dissociation constant (KD) values were calculated using the computer software “Ligand” (version 4; Biosoft).
In Vivo Studies.Microdialysis. Four consecutive microdialysis samples with less than 40% variation were taken as baseline levels and set at 100%. Drug effects were expressed as percentage of the basal level (mean ± S.E.M.). Statistical analysis was performed using SigmaStat for Windows (SPSS Inc., Chicago, IL). Effects were compared versus vehicle using two-way ANOVA with repeated measures across all doses for each compound and transmitter and subsequently, where applicable, for each individual dose, followed by the Dunnet's post hoc test. The level of statistical significance was set at p < 0.05.
Pain models. Unless indicated otherwise in the preceding sections, data were analyzed by means of 1- or 2-factor ANOVA with or without repeated measures, depending on the experimental design. Significance of treatment, time, or treatment × time interaction effects was analyzed by means of Wilks' Lambda statistics. In the case of a significant treatment effect, pairwise comparison was performed at the time of maximal effect by Fisher least significant difference test. Results were considered statistically significant if p < 0.05. ED50 values and 95% confidence intervals were determined at the time of the peak effect for each drug by semi-logarithmic regression analysis or according to Litchfield and Wilcoxon (1949). ED50 values with nonoverlapping 95% confidence intervals were considered to be significantly different. Note that our definition of ED50 value differs from the original strict mathematical definition in that our ED50 values refer to the calculated dose that would yield 50% MPE in the test population, rather than the dose that would yield a given effect in 50% of the test population. Although this modified definition deviates from the formal mathematical definition, it is commonly used for the analysis of behavioral data.
Group sizes were n = 10 for hot plate, tail-flick, writhing, Randall-Selitto, SNL, and CCI models; n = 7 for mustard oil-induced colitis; n = 5 to 10 for streptozotocin-induced diabetic polyneuropathy; and n = 3 to 6 for microdialysis.
Drugs and Chemicals. The following drugs were used: tapentadol HCl (Grünenthal GmbH); morphine HCl and codeine phosphate (Merck AG, Darmstadt, Germany); naloxone HCl and yohimbine HCl (Sigma-Aldrich Laborchemikalien, Seelze, Germany); Narcoren (Merial GmbH, Hallbergmoos, Germany); nisoxetine HCl, fluoxetine HCl, duloxetine HCl and oxalate, and venlafaxine HCl (all synthesized by Dr. O. Zimmer, Grünenthal GmbH). Mustard oil and streptozotocin were obtained from Sigma-Aldrich Laborchemikalien.
Standard application route for test compounds was i.p., with the exception of the SNL antagonism experiments where tapentadol and morphine were administered i.v. In the visceral pain models (writhing, mustard oil) where i.p. injections are not feasible, drugs were administered i.v. For the in vivo studies, all drugs were dissolved in saline and injected at 1 ml/kg (microdialysis), 5 ml/kg (rat pain models), or 10 ml/kg body weight (mouse pain models).
For all drugs, the salt form has been omitted from the text. All doses indicated refer to the respective salt form as indicated in this paragraph.
Results
In Vitro Data
In opioid receptor binding studies, tapentadol bound to native rat MOR, DOR, and KOR, with Ki values of 0.096, 0.97, and 0.91 μM, respectively (Table 1). At the human recombinant MOR, tapentadol had a similar Ki of 0.16 μM (Fig. 2A) as at the native rat MOR. Tapentadol did not bind to the human recombinant ORL1 receptor (Ki > 100 μM). In the human MOR [35S]GTPγS binding assay, tapentadol showed agonistic activity, with an efficacy of 88% relative to morphine and with an EC50 of 0.67 ± 0.15 μM (morphine: EC50 = 0.022 ± 0.003 μM) (Fig. 3 A). Binding properties of the reference opioids, morphine and codeine, in rat assays are shown in Table 1.
Inhibition of opioid binding, monoamine transporter binding, and synaptosomal monoamine uptake by tapentadol and reference compounds
Results are the means of sets of experiments performed in triplicate (n = 3) or quadruplicate (n = 4).
In rat synaptosomal reuptake assays, tapentadol inhibited the NE reuptake transporter with a Ki of 0.48 ± 0.11 μM and the 5-HT reuptake transporter with a Ki of 2.37 ± 0.54 μM (Table 1; Fig. 3, B, C, and D, in comparison to reference compounds). Other uptake systems, like choline, GABA, adenosine, and dopamine, were not affected (data not shown). In human recombinant transporter binding assays, tapentadol had a Ki for the NE transporter of 8.80 ± 1.17 μM and a Ki for the 5-HT transporter of 5.28 ± 0.58 μM (Table 1; Fig. 2, B and C, in comparison to reference compounds).

A, comparison of the binding of tapentadol to the rat and human MOR. B, binding of tapentadol and reference compounds at the human NE transporter. C, binding of tapentadol and reference compounds at the human 5-HT transporter.
Tapentadol was further tested in a range of assays for possible interactions with receptors, ion channels, and enzyme systems. The only (submicromolar) interactions that were found were with the rat sigma2 binding site (Ki = 0.43 μM), muscarinic receptors (rat M1 and human M1–M5, with Ki values in the range of 0.47–1.19 μM), and the rat 5-HT3 receptor (Ki = 1.04 μM). In the case of the muscarinic receptors, further characterization revealed that tapentadol behaved like a weak muscarinic antagonist in a human embryonic kidney (HEK-293) cell assay. With respect to the 5-HT3 receptor, tapentadol showed a dose-dependent antagonistic activity in a guinea pig colon bioassay (see Tzschentke et al., 2006).
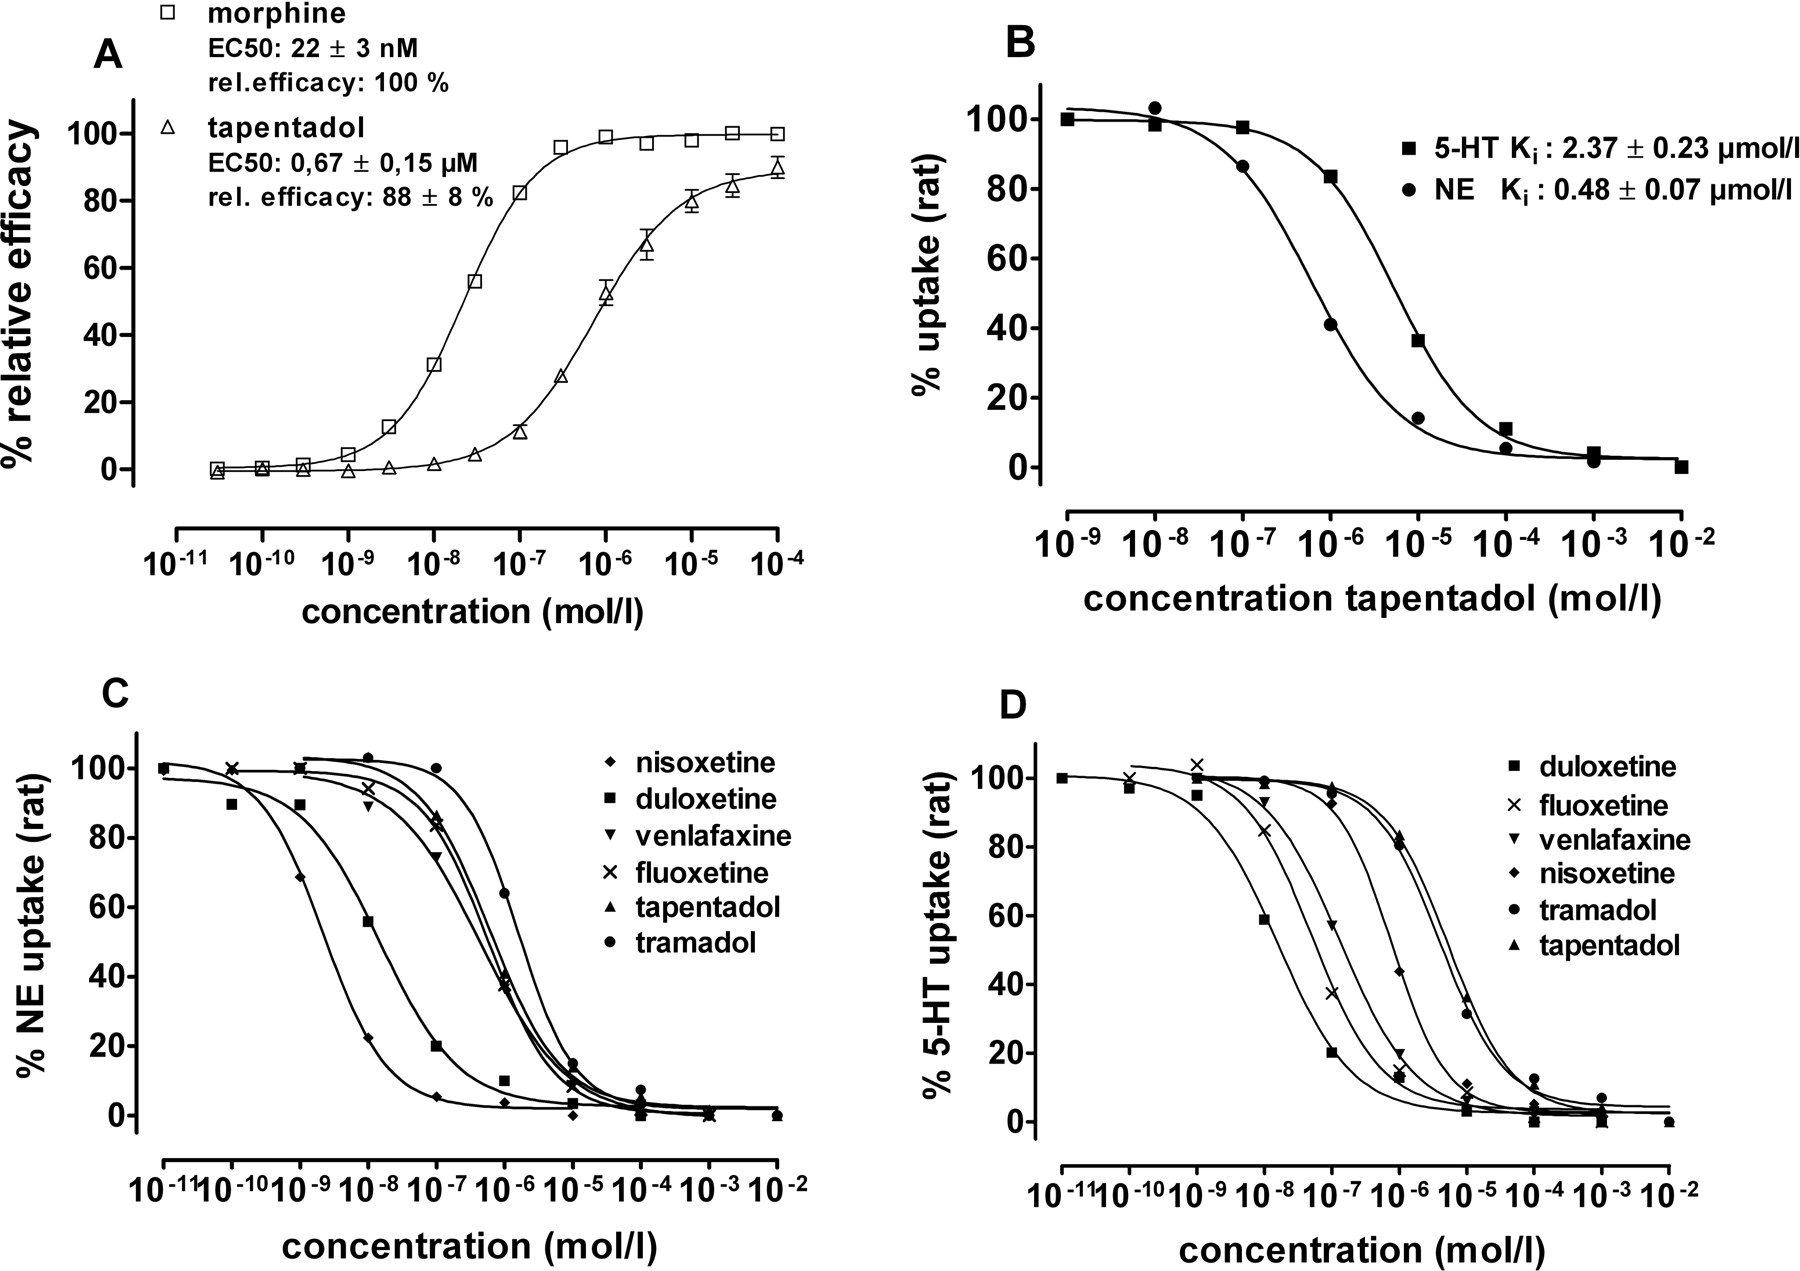
A, comparison of tapentadol and morphine in a functional assay (stimulation of [35S]GTPγS-binding at human recombinant MOR membranes). B, comparison of inhibition of synaptosomal NE and 5-HT reuptake (rat) by tapentadol. C, inhibition of synaptosomal NE reuptake (rat) by tapentadol and reference compounds. D, inhibition of synaptosomal 5-HT reuptake (rat) by tapentadol and reference compounds.
Binding and functional studies with the major metabolite of tapentadol, tapentadol-O-glucuronide, did not reveal any pharmacological activity at opioid receptors, synaptosomal reuptake systems, and other binding sites (Table 1; data not shown).
In Vivo Intracerebral Microdialysis
Tapentadol (4.64–10 mg/kg i.p.) produced a clear, dose-dependent increase in extracellular levels of NE, with a maximal increase of 450% above baseline obtained at 10 mg/kg. Overall, ANOVA indicated a significant effect of tapentadol on extracellular NE levels [F(2,15) = 5.44, p < 0.05]. Whereas increases elicited by the lower dose (4.64 mg/kg) were not significant [F(1,10) = 3.10, p > 0.05], 10 mg/kg significantly increased NE levels [F(1,10) = 6.03, p < 0.05]. Extracellular levels of 5-HT were also increased significantly by tapentadol, albeit to a lesser extent than NE (up to 130% above baseline, at 10 mg/kg). Overall, ANOVA indicated a significant effect of tapentadol on extracellular 5-HT levels [F(2,15) = 5.42, p < 0.05]. As for NE, the effects of the lower dose (4.64 mg/kg) were not significant [F(1,10) = 2.79, p > 0.05], whereas the higher dose (10 mg/kg) elicited significant increases in 5-HT levels [F(1,10) = 8.11, p < 0.05] (Fig. 4).
Morphine (1–10 mg/kg i.p.) did not significantly affect extracellular levels of NE and 5-HT across the dose range tested [ANOVA, F(3,17) = 1.37, p > 0.05 for NE; F(3,23) = 1.45, p > 0.05 for 5-HT]. There was only a tendency toward decreased NE levels and increased 5-HT levels at the two lower doses tested (Fig. 4).
Behavioral Tests
ED50 values (with 95% confidence limits) from all pain models are summarized in Table 2. Because of an extensive first-pass metabolism, tapentadol has a low oral absolute bioavailability of approximately 9% in rats. This is much lower than the oral absolute bioavailability of tapentadol in man (approximately 32%, which is comparable to that of morphine) (Tzschentke et al., 2006; unpublished data). Therefore, it was decided to use the i.p. route of administration to circumvent the problem of low oral availability of tapentadol in rats and potential underestimation of its potency and efficacy (relative to morphine) in humans.
ED50 values and 95% confidence limits of tapentadol and morphine in animal models of acute and chronic pain
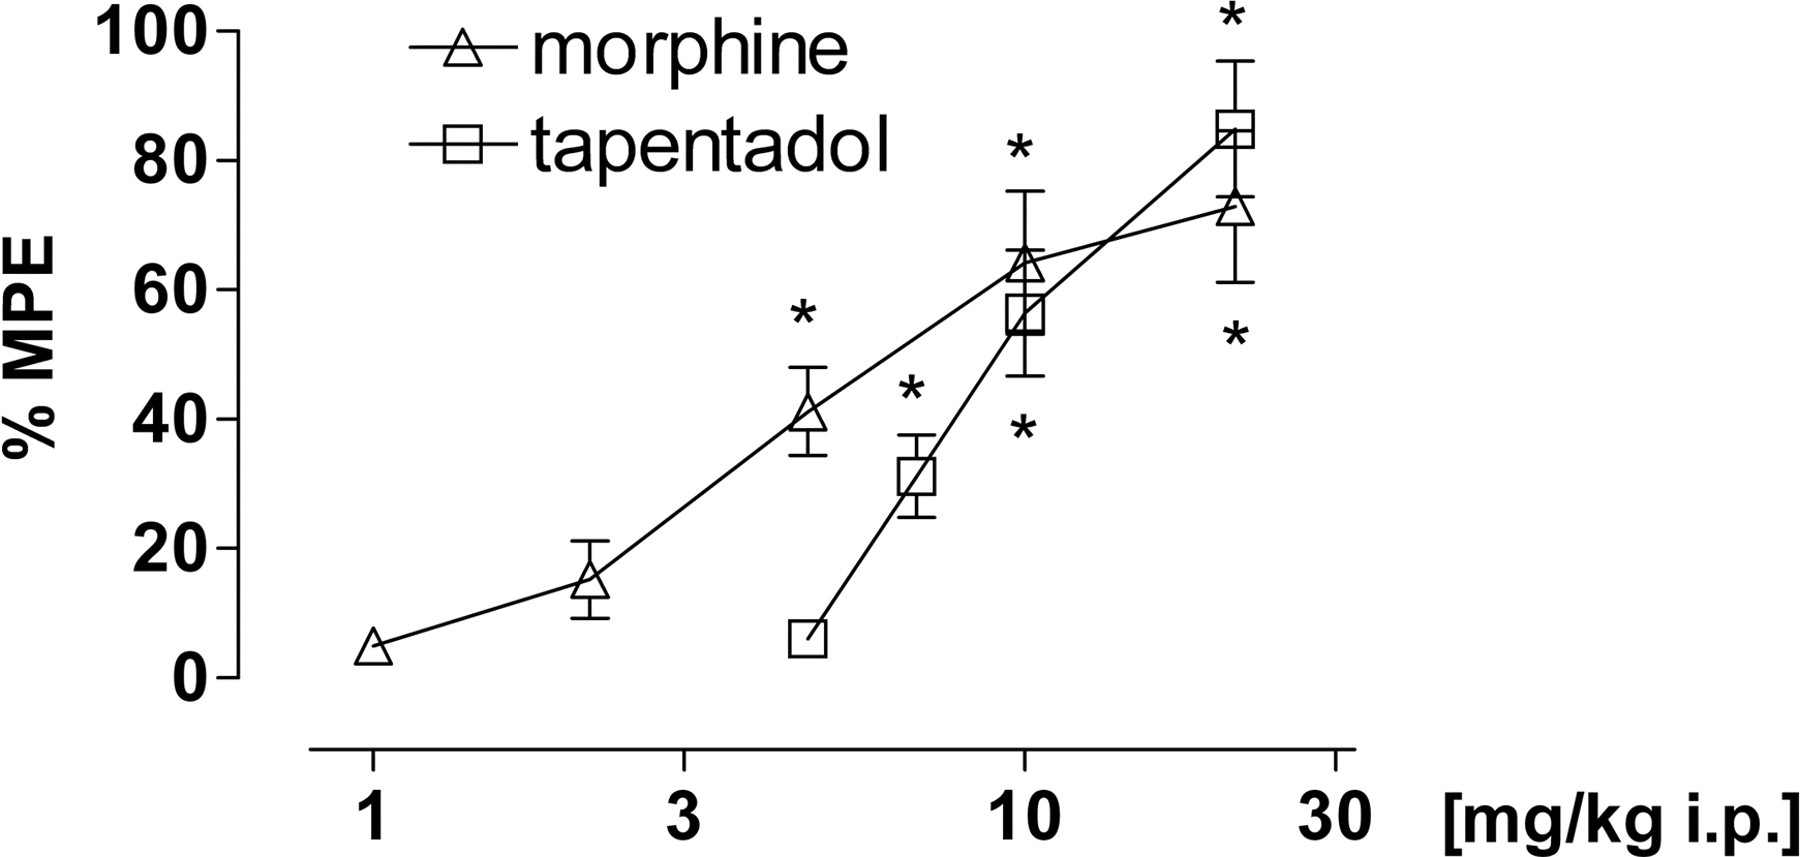
Hot Plate. Tapentadol [F(4,45) = 8.92, p < 0.0001] and morphine [F(4,45) = 12.35, p < 0.0001] induced dose-dependent antinociception and reached full efficacy. Morphine was approximately two to three times more potent than tapentadol (ED50 4.7 versus 11.8 mg/kg i.p., respectively) (Fig. 5A).
Tail-Flick. Tapentadol [F(4,45) = 18.21, p < 0.0001] and morphine [F(5,54) = 22.48, p < 0.0001] induced dose-dependent antinociception and reached full efficacy. Morphine was approximately twice as potent as tapentadol (ED50 5.8 versus 10.0 mg/kg i.p., respectively) (Fig. 5B).
Randall-Selitto. Tapentadol [F(4,45) = 28.35, p < 0.0001] and morphine [F(5,54) = 25.18, p < 0.0001] produced dose-dependent antinociception and reached similar efficacy. Morphine was approximately twice as potent as tapentadol (ED50 5.6 versus 10.1 mg/kg i.p., respectively) (Fig. 6).
Mustard Oil-Induced Visceral Pain. Tapentadol showed a dose-dependent inhibition of different visceral pain parameters. Spontaneous visceral pain was inhibited with an ED50 of 1.5 mg/kg i.v., referred allodynia as measured by means of 1 mN von Frey stimulation with an ED50 of 3.8 mg/kg i.v., and referred hyperalgesia as measured by scoring the reaction toward 16 mN von Frey stimulation with an ED50 of 3.9 mg/kg i.v. Morphine showed a similar efficacy as tapentadol, with a 1.5 to 4-fold higher potency (ED50 1.0 mg/kg i.v. for spontaneous visceral pain, 0.77 mg/kg i.v. for referred allodynia, and 0.86 mg/kg i.v. for referred hyperalgesia) (Fig. 7). The results of the ANOVAs for effects on spontaneous pain were as follows: tapentadol F(3,36) = 9.96, p < 0.0001; morphine F(5,54) = 8.72, p < 0.0001.

Microdialysis in the ventral hippocampus of freely moving rats after i.p. administration of tapentadol (A, B) or morphine (C, D). Tapentadol produced a dose-dependent increase in extracellular levels of NE (A) and 5-HT (B). Morphine did not produce a significant increase in extracellular levels of NE (C) and a delayed nondose-dependent, nonsignificant increase in extracellular 5-HT levels (D).
Spinal Nerve Ligation. Tapentadol [tapentadol F(4,45) = 12.17, p < 0.0001] and morphine [F(4,45) = 29.87, p < 0.0001] showed dose-dependent inhibition of mechanical allodynia. Morphine was approximately twice as potent as tapentadol (ED50 4.6 versus 8.2 mg/kg i.p., respectively) (Fig. 8A). Baseline withdrawal thresholds were 22.7 g for ligated animals and 57.1 g for sham animals.
Streptozotozin Model. Mechanical hyperalgesia was dose-dependently inhibited by tapentadol [F(3,36) = 68.85, p < 0.0001] and morphine [F(3,36) = 30.46, p < 0.0001], and both drugs reached full efficacy. Morphine was approximately three times as potent as tapentadol (ED50 3.0 versus 8.9 mg/kg i.p.) (Fig. 8B). The baseline withdrawal threshold was 94.0 g for diabetic animals.
Antagonism in the Writhing Model. In a pilot experiment (to determine equianalgesic doses for subsequent antagonism experiments), tapentadol and morphine induced a dose-dependent inhibition of writhing reactions with ED50 values of 0.7 and 0.4 mg/kg i.v., respectively. When equianalgesic doses of tapentadol (3.16 mg/kg i.v.) and morphine (0.681 mg/kg i.v.) were combined with increasing doses of naloxone, the antinociceptive effect of morphine was more potently reduced than that of tapentadol at any given naloxone dose (Fig. 9). Naloxone antagonized the morphine effect with an ED50 of 0.007 mg/kg i.v. (0.001–0.023) and the tapentadol effect with an ED50 of 0.099 mg/kg i.v. (0.046–0.269). Two-factor ANOVA indicated a highly significant difference between treatment conditions (tapentadol versus morphine groups): F(1,90) = 15.60; p < 0.001.
In an attempt to parallel the antagonism studies conducted in the SNL model (see below), we also used the α2 adrenoceptor antagonist yohimbine in the writhing model. However, these experiments yielded no meaningful results. Yohimbine produced strong side effects in phenylquinone-treated mice, thus preventing measurement of writhing reactions.

Effect of tapentadol and morphine in the hot plate model of acute thermal pain in mice (A) and in the tail-flick model of acute thermal pain in rats (B). Data are expressed as mean (± S.E.M.) % MPE. *, p < 0.05 versus vehicle control.
Effect of tapentadol and morphine in the Randall-Selitto yeast model of acute inflammatory pain in rats. Data are expressed as mean (± S.E.M.) % MPE. *, p < 0.05 versus vehicle control.
Antagonism in the Spinal Nerve Ligation Model. When equieffective doses of tapentadol (10 mg/kg i.v.) and morphine (6.81 mg/kg i.v.) were combined with naloxone (0.3 mg/kg i.p.), the antiallodynic effect of tapentadol was reduced from 72 to 42% MPE at the peak effect time of 30 min [interaction: F(1,36) = 0.77, p > 0.05, nonsignificant], whereas the antiallodynic effect of morphine was reduced from 83 to 25% MPE [interaction: F(1,36) = 16.79, p < 0.001]. On the other hand, yohimbine (2.15 mg/kg i.p.) showed a clear reduction of the antiallodynic effect of tapentadol from 81 to 19% MPE [interaction: F(1,36) = 6.74, p < 0.05], whereas only a small reduction was seen in the combination with morphine from 80 to 54% MPE [interaction: F(1,36) = 3.02, p > 0.05, nonsignificant] (Fig. 10).
Tolerance Development in the Chronic ConstrictionInjury Model. In a pilot experiment (to determine equianalgesic doses for subsequent antagonism experiments), tapentadol and morphine dose-dependently inhibited cold allodynia with ED50 values of ∼13 and 7.1 mg/kg i.p., respectively. Subsequently, tolerance was induced by daily administration of 6.81 mg/kg i.p. tapentadol or 6.81 mg/kg i.p. morphine. Complete tolerance to morphine was obtained at day 10, whereas complete tolerance to tapentadol was not reached until day 23 (Fig. 11) [treatment: F(2,39) = 34.05, p < 0.0001; time: F(12,28) = 50.73, p < 0.0001; treatment × time: F(24,56) = 10.54, p < 0.0001]. Baseline numbers of withdrawal reactions on day 1 before the first administration were 37.9, 37.6, and 37.5 for vehicle, tapentadol, and morphine groups, respectively.
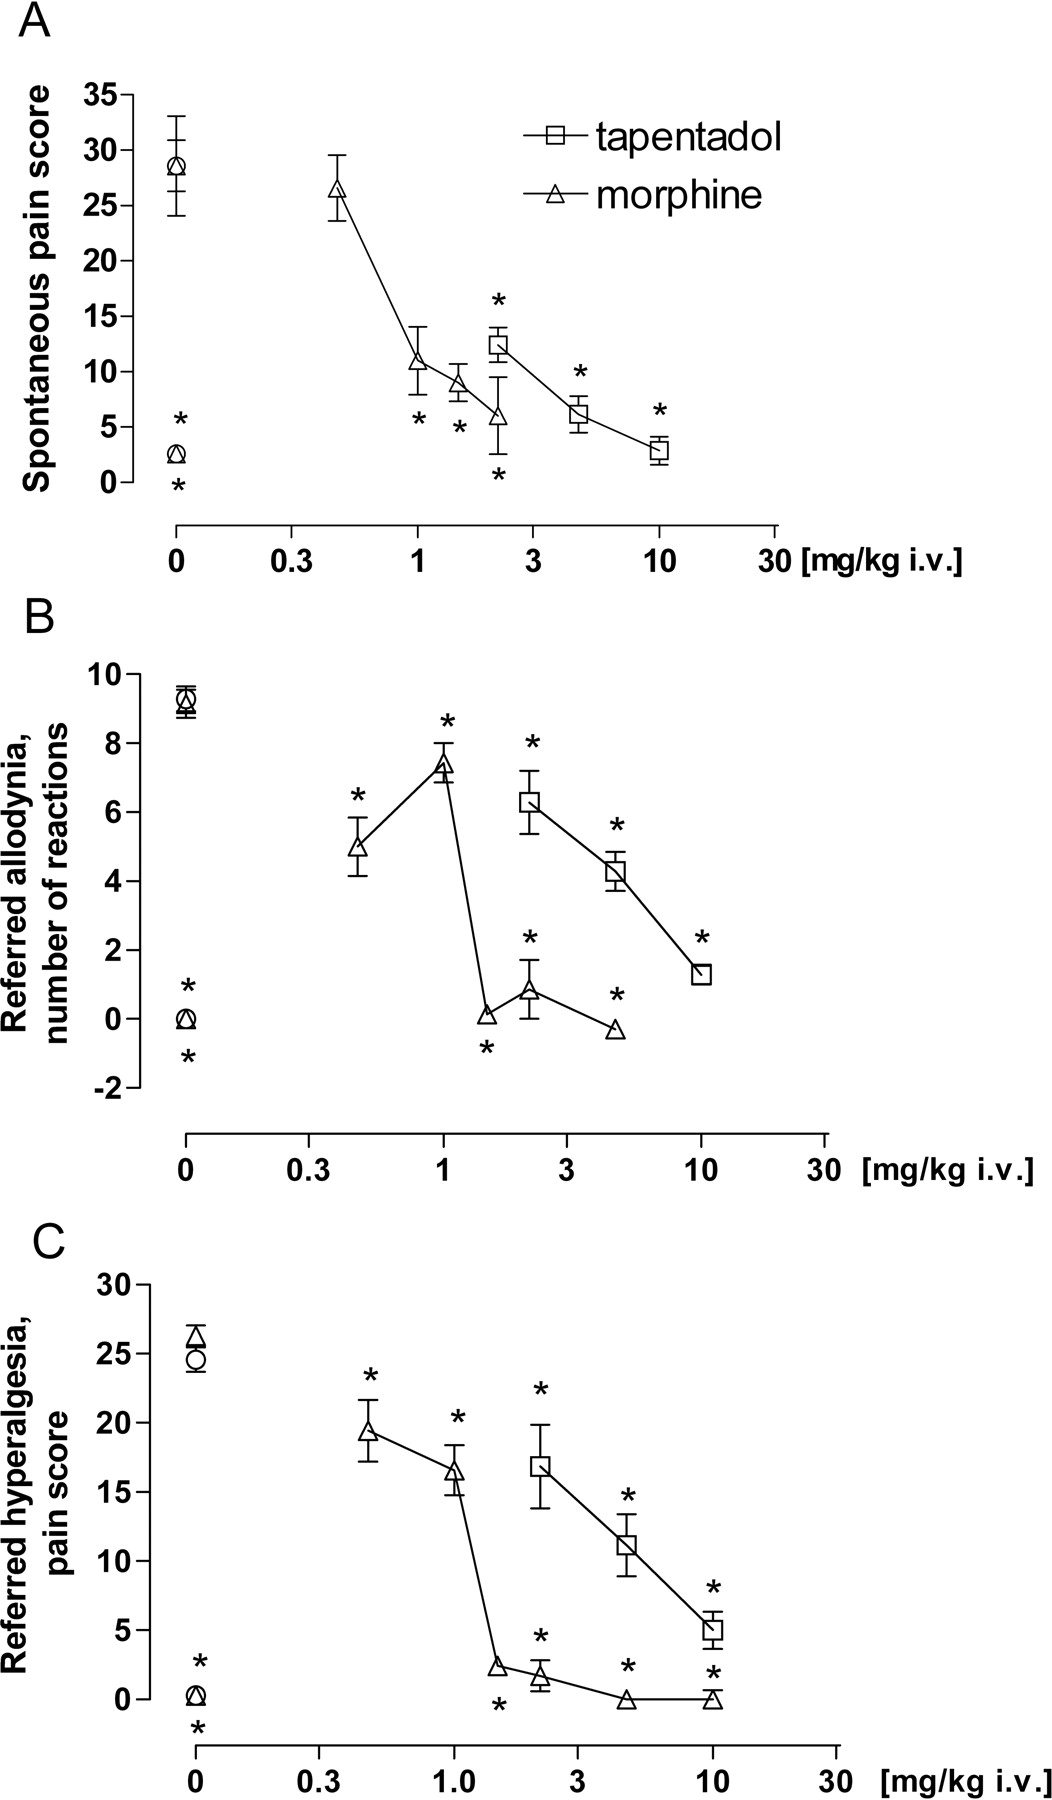
Effect of tapentadol and morphine in the rat mustard oil visceral pain model: reduction of spontaneous pain behavior (number of pain behaviors) (A), reduction of referred allodynia (1 mN) (response frequency) (B), and reduction of referred hyperalgesia (16 mN) (referred pain score) (C). Data are expressed as mean (± S.E.M.) in terms of score value (A, C) or counts (B). *, p < 0.05 versus vehicle control.
Discussion
Tapentadol was characterized as a MOR agonist and NE transporter inhibitor in receptor binding assays and in functional MOR and NE synaptosomal reuptake assays. The intrinsic efficacy of tapentadol at the MOR was similar to morphine, and the compound was relatively selective for the MOR because binding to the KOR and DOR subtypes was approximately 10-fold less potent and binding to the ORL1 receptor was more than 1000-fold less potent. There was a very good match between native rat and human recombinant MOR binding. Under our experimental conditions, tapentadol was nearly as potent as venlafaxine with respect to NE transporter binding and functional NE reuptake inhibition. A broad receptor binding and enzyme activity screen revealed no evidence for interactions of comparable (i.e., submicromolar) potency with targets other than the MOR and the NE transporter, with the exception of the muscarinic receptor, for which a weak antagonistic activity was subsequently shown in a functional assay. Submicromolar binding was also found for the sigma2 binding site. However, because the relevance and function of this receptor is not well characterized and is controversially debated, this finding was given no further consideration. Thus, with respect to targets generally thought to be relevant for analgesic activity (Buschmann et al., 2002), tapentadol can be considered to be selective for the MOR and the NE transporter.

A, effect of tapentadol and morphine on mechanical allodynia in the rat SNL model of neuropathic pain. B, effect of tapentadol and morphine on mechanical hyperalgesia in the rat streptozotocin model of polyneuropathic pain. Data are expressed as mean (± S.E.M.) % MPE. *, p < 0.05 versus vehicle control.

Antagonism of the antinociceptive effect of tapentadol (3.16 mg/kg i.v.) and morphine (0.681 mg/kg i.v.) by naloxone in the phenylquinone writhing model. Morphine was more sensitive to the antagonistic effect of naloxone than tapentadol over the whole range of naloxone doses tested. Data are expressed as mean (± S.E.M.) in terms of number of writhing reactions. Two-factor ANOVA indicated a significant difference between treatment levels (tapentadol, morphine).
There was an apparent mismatch between functional rat synaptosomal uptake inhibition and human recombinant transporter binding. Tapentadol had a higher affinity for the 5-HT transporter than for the NE transporter in the binding assays but displayed a more potent inhibition of the NE transporter than that of the 5-HT transporter in functional assays. A similar discrepancy between binding affinity and reuptake inhibition potency at the NE and 5-HT transporter has also been reported, e.g., for venlafaxine (Béique et al., 1998; and discussion therein). The outcome of binding assays can be strongly influenced by the experimental conditions. Furthermore, the mere binding of a ligand to a transporter, by itself, does not provide any information about the functional significance of the ligand-transporter interaction and the intrinsic efficacy of the ligand. This information is much more accurately provided by functional assays, the results of which, in turn, were in very good agreement with the in vivo microdialysis data.
In vivo intracerebral microdialysis with probes located in the ventral hippocampus was performed in awake rats. Pilot studies with the selective NE reuptake inhibitor reboxetine and the selective 5-HT reuptake inhibitor citalopram confirmed that this brain region is sensitive to both NE and 5-HT reuptake inhibitors (see Cremers et al., 2007; unpublished data). Tapentadol induced a clear increase in extracellular NE levels in the analgesic dose range but only a moderate increase in extracellular 5-HT levels. Morphine, on the other hand, had a comparable (if somewhat delayed and nonsignificant) effect on 5-HT, but it did not produce an increase in extracellular NE levels. Thus, consistent with the in vitro data, the microdialysis data demonstrate that the norepinephrinergic activity of tapentadol is much more pronounced than its serotonergic activity.
Tapentadol is metabolized predominantly by O-glucuronidation (Terlinden et al., 2006). The O-glucuronide did not show any affinity for the MOR, the NE transporter, or any of the other targets studied and was devoid of any activity in the mouse tail-flick test after i.v. or i.c.v. administration (data not shown). This clearly differentiates tapentadol from other opioids, such as codeine or tilidine, and also from tramadol, which all require metabolic activation or morphine, which is converted to the highly potent morphine-6-glucuronide. Because the analgesic activity of tapentadol resides in the parent molecule, polymorphic CYP2D6 enzymes are not required for conversion to an active metabolite, thereby reducing the likelihood of large individual variations in the analgesic response to tapentadol.
It is well known that MOR agonists and NE reuptake inhibitors have analgesic effects, although the pain conditions in which these two drug classes are most efficacious may be different. It appears that, overall, MOR agonists are predominantly effective against acute, moderate-to-severe pain, whereas NE reuptake inhibitors are particularly effective against chronic pain (Casy and Parfitt, 1986; Carter and Sullivan, 2002). This implies that a compound that combines both mechanisms of action holds the promise of being effective against a large spectrum of pain conditions, ranging from acute to chronic pain. In the present studies, tapentadol showed antinociceptive, antihyperalgesic, and/or antiallodynic effects in various models of acute and chronic (neuropathic) pain, including the L5 spinal nerve ligation model (Kim and Chung, 1992) and streptozotocin-induced polyneuropathy (Courteix et al., 1993); in models of inflammatory pain, such as the yeast model (Randall and Selitto, 1957); and in models of acute nociception, such as hot plate (Eddy and Leimbach, 1953) and tail-flick (D'Amour and Smith, 1941), thus confirming a broad spectrum of analgesic activity that was expected for a compound with MOR agonistic and NE reuptake-inhibiting properties. Although morphine was also found to be active across the various pain models, it should be noted that there was a striking mismatch between the potency difference of morphine and tapentadol with regard to MOR binding on the one hand and analgesic effects on the other hand. The potency difference for MOR binding was approximately 50-fold, whereas the overall potency difference for analgesia was only approximately 2 to 3-fold in most pain models after systemic administration. Based on the MOR agonistic activity alone, tapentadol would have been expected to have a much lower analgesic potency, suggesting that another mechanism of action and/or the kinetics of the compound are likely to contribute to this effect. The in vitro and microdialysis data indicate that the additional mechanism contributing to the analgesic effect of tapentadol is inhibition of NE reuptake. This suggestion was corroborated in in vivo pharmacological antagonism studies. In the SNL model of neuropathic pain, it was shown that the analgesic effect of tapentadol was much more sensitive to the antagonistic effect of a given dose of yohimbine than that of an equianalgesic dose of morphine. Furthermore, under identical experimental conditions, the analgesic effect of morphine was much more sensitive to the antagonistic effect of naloxone than that of tapentadol. Because tapentadol combines MOR agonism and NE reuptake inhibition in a single molecule, isobolographic analysis of the interaction of the two mechanisms of action is not possible. However, preclinical as well as clinical evidence indicates that opioid analgesia can be augmented by monoamine reuptake inhibitors (Ossipov et al., 1982; Levine et al., 1986; Ventafridda et al., 1990).

Antagonism of the antinociceptive effect of equianalgesic doses of tapentadol (10 mg/kg i.v.) (A, B) and morphine (6.81 mg/kg i.v.) (C, D) by naloxone (0.3 mg/kg i.p.) (A, C) and yohimbine (2.15 mg/kg i.p.) (B, D) in the SNL model. Data are expressed as mean (± S.E.M.) % MPE. *, p < 0.05 versus saline + saline group; #, p < 0.05 versus tapentadol + saline or morphine + saline group.

Development of tolerance to the analgesic effect of equianalgesic doses of tapentadol and morphine in the CCI model of neuropathic pain (6.81 and 6.81 mg/kg i.p., respectively). Data are expressed as mean (± S.E.M.) in terms of number of pain reactions. *, p < 0.05 versus vehicle baseline (between-group comparison); #, p < 0.05 versus day 1 (within group comparison).
Tolerance to the analgesic effect of opioids can be readily observed in animal pain models (for review, see Trujillo, 2000) and can also occur in the clinical setting, necessitating dose increases during prolonged treatment (Ballantyne and Mao, 2003). Tolerance development to the analgesic effect of tapentadol in the CCI model in rats during repeated administration was much delayed compared with morphine. We also investigated tolerance development in the rat tail-flick model. Preliminary data indicate that, using equianalgesic doses of tapentadol and morphine, the shape of the curve showing the loss of antinociceptive effect of tapentadol was clearly different from that obtained for morphine. Morphine showed an immediate onset of tolerance development and complete tolerance within 21 days of treatment. Tapentadol showed a delayed onset of tolerance development. After onset, there was a progressive decline of effect until day 18, followed by a plateau phase of moderate antinociception (30% MPE) and complete tolerance on day 51. It is noteworthy that the delayed tolerance development was seen only for the analgesic effect of tapentadol; tolerance development for the respiratory depressant effect was not delayed compared with morphine (see Tzschentke et al., 2006). We also have preliminary data showing that the NE reuptake inhibitor desipramine has an analgesic effect in the CCI model that does not show tolerance after more than 3 weeks of daily applications. This suggests that the prolonged analgesic activity of tapentadol may be related to its norepinephrinergic activity.
Notably, tapentadol has also been shown to have a clearly reduced emetic potential compared with morphine and produce less physical dependence than morphine at equianalgesic doses (Tzschentke et al., 2006). Both observations may be related to the reduced MOR binding affinity of tapentadol relative to morphine and, at least in the case of physical dependence, to the NE reuptake inhibitory properties of the compound.
In conclusion, tapentadol was characterized as a new analgesic drug with a dual mode of action. It combines moderate MOR agonistic activity with NE reuptake inhibition in a single, nonracemic molecule. No metabolic activation of tapentadol is necessary for analgesia, and it has no active metabolites. Because of its dual mechanism of action, tapentadol has efficacy in a broad spectrum of acute and chronic pain models and possibly an improved tolerability profile. Tapentadol is currently in phase III of clinical development.
Acknowledgments
The technical assistance of A. Boltersdorf, W. Debarry, J. Emonds, G. Haase, K. Hoffmann, U. Jansen, N. Linnhoff, S. Pfennings, S. Schmitz, S. Reinartz, E. Schumacher, P. Strobl, S. Tenholte, P. Thevis, S. Voβ, and H.-J. Weber is gratefully acknowledged.
Footnotes
-
This work was supported by Grünenthal GmbH (Aachen, Germany).
-
Article, publication date, and citation information can be found at http://jpet.aspetjournals.org.
-
doi:10.1124/jpet.107.126052.
-
ABBREVIATIONS: MOR, μ-opioid receptor; 5-HT, 5-hydroxytryptamine (serotonin); ANOVA, analysis of variance; CCI, chronic constriction injury; CYP2D6, cytochrome P450 2D6; DOR, δ-opioid receptor; GTPγS, guanosine 5′-3-O-(thio)triphosphate; HPLC, high-pressure liquid chromatography; KOR, κ-opioid receptor; MPE, maximal possible effect; NE, norepinephrine; SNL, spinal nerve ligation; tapentadol HCl, (–)-(1R,2R)-3-(3-dimethylamino-1-ethyl-2-methyl-propyl)-phenol hydrochloride.
- Received May 21, 2007.
- Accepted July 25, 2007.
- The American Society for Pharmacology and Experimental Therapeutics


