


Abstract
Recent reports have documented a functional deficit of organic cation transport in diabetic rats by an unknown mechanism. This study was designed to test the hypothesis that experimental diabetes decreases expression of organic cation transporters at the basolateral membrane. Streptozotocin-induced diabetic rats were maintained for varying durations after induction of diabetes. A second group of age-matched control rats was maintained in a parallel manner. Kinetic analysis of tetraethylammonium accumulation in freshly isolated proximal tubular cells indicated a significantly lower Vmax value for the diabetics versus controls with no statistical difference in Km values between the two groups. Cortex sections were processed by standard procedures for Northern and immunoblot analysis. Protein expression of the organic cation transporters rOCT1 and rOCT2 progressively decreased with increasing duration of diabetes. After 21 days of diabetes, rOCT1 and rOCT2 were maximally reduced by 50 and 70%, respectively. Quantification of mRNA expression revealed that the roct1 transcript remained unchanged, whereas the roct2 transcript was decreased by 50% after 14 days of diabetes. Treatment with insulin prevented the reductions in transporter levels. These results support the hypothesis by demonstrating that experimental diabetes decreased expression of both rOCT1 and rOCT2 protein and also of roct2 mRNA accumulation. On the other hand, roct1 mRNA levels were unaffected by the diabetic state. This suggests that differences in rOCT2 protein may result from transcriptional and/or translational changes, whereas rOCT1 deficits may be due to posttranscriptional alterations.
Although nephropathy is a common outcome of clinical diabetes mellitus, only recently has attention focused on the effect of the disease on organic substrate transport systems of the proximal tubule. Our laboratory has demonstrated a progressive impairment of the ability of the model organic cation tetraethylammonium to accumulate in freshly isolated proximal tubular cells (Rathi and Cacini, 1996) and renal slices prepared from streptozotocin (STZ)-induced diabetic rats (Grover et al., 2002). The renal organic cation transport system of the proximal tubule plays an important role in mediating the removal of a variety of toxicants and drugs from the body (for reviews, see Pritchard and Miller, 1996; Inui et al., 2000). This system moves positively charged molecules from the peritubular blood to the tubular lumen for elimination in urine. The overall process is energy-dependent, highly efficient, and dependent upon discrete transport proteins located in the basolateral and brush-border membranes of the proximal tubule.
Grundemann et al. (1994) were the first to identify a polyspecific organic cation transporter, rOCT1, in rat kidney via expressional cloning. Subsequently, numerous homologous cation transporters were identified (for reviews, see Koepsell and Gorboulev, 1999; Burckhardt and Wolf, 2000). Currently, rOCT2, rOCT3, and two subtypes of rOCT1 have been cloned using hybridization techniques (Okuda et al., 1996; Kekuda et al., 1998). Comparisons of the primary sequence of the proteins reveal that rOCT2 contains 67% identity to rOCT1, whereas rOCT3 has less than 50% identity to rOCT1. Whereas rOCT1 is found in the kidney, liver, and intestine, rOCT2 is only found in the kidney. High levels of rOCT3 are abundantly found in the placenta, intestine, heart, and brain, but only very little in the kidney. It is now generally accepted that rOCT1 and rOCT2 mediate organic cation transport at the BLM of renal proximal tubule cells (Urakami et al., 1998; Sugawara-Yokoo et al., 2000; Sweet et al., 2000). These transporters are not uniformly distributed along the length of the proximal tubule such that rOCT1 is primarily located in the S1 and S2 segments and rOCT2 is mainly expressed in S2 and S3 segments (Karbach et al., 2000).
The current study was undertaken to test the hypothesis that the diabetes-associated functional deficits in organic cation transport are due to a decrease in the expression of rOCT1 and/or rOCT2. The results support the hypothesis. Protein expression for both transporters was significantly lower in renal cortex from diabetic rats compared with levels observed in nondiabetic control rats. Although the mRNA level for roct2 was decreased in the diabetics, roct1 mRNA expression was not different from the control levels. Insulin treatment prevented the decline in the transporters.
Materials and Methods
Induction of Diabetes. On day 1, diabetes was induced in male Sprague-Dawley rats (225–250 g of initial body weight) by injection of STZ (Sigma-Aldrich, St. Louis, MO) as described previously (Sarangarajan and Cacini, 1996). Briefly, freshly dissolved STZ in a 0.05 M citrate buffer (pH 4.5) was injected into a single lateral tail vein at a dose of 65 mg/kg b.wt. Nondiabetic control rats were injected with buffer alone. On day 3, diabetes was confirmed if the blood glucose level exceeded 300 mg/dl (One Touch glucometer; LifeScan Inc., Milipitas, CA) and glucosuria was evident (TesTape; Eli Lilly & Co., Indianapolis, IN). All rats were maintained for varying intervals for up to 42 days with free access to food and tap water in temperature- and humidity-controlled quarters. Some rats were treated with NPH insulin (Novolin N, 100 U/ml; Novo Nordisk, Bagsvaerd, Denmark) after confirmation of diabetes. Insulin was administered subcutaneously beginning on day 3 of diabetes with an initial dose of 40 U/kg. Blood glucose concentrations were monitored twice daily and subsequent doses were provided as necessary. The individual doses of supplemental insulin were calculated by the method of Moglia and Phelps (1996). Animals with a plasma glucose level below 150 mg/dl were considered to be controlled diabetics.
Isolation of Proximal Tubule Cells. The isolation method was originally described by Boogaard et al. (1989). Briefly, rats were anesthetized with pentobarbital (60 mg/kg body weight i.p.). The abdomen was opened and the kidneys were initially flushed in situ via the aorta with a modified Hanks-HEPES buffer of the following composition: 137 mM NaCl, 5 mM KCl, 0.8 mM MgSO4, 0.33 mM Na2HPO4, 0.44 mM KH2PO4, 26 mM NaHCO3, 25 mM HEPES, 11.1 mM glucose. The kidneys were then excised as a pair, mounted in an organ bath, and subjected to collagenase (type 2; Worthington Biochemicals, Freehold, NJ) perfusion followed by Accudenz gradient centrifugation. Proximal tubule cells occurred as a well defined band at the interface between two layers of the gradient. The band was transferred to a test tube on ice using a Pasteur pipet and suspended in ice-cold Hanks-HEPES buffer to an initial estimated concentration of 8 to 12 million cells/ml.
Cell Incubations. Isolated cells were incubated essentially as described by Boogaard et al. (1989). Typically, a 0.9-ml aliquot of the cell suspension, diluted in Hanks-HEPES bovine serum albumin (BSA) buffer to approximately 2.3 million cells/ml, was pipetted into a 25-ml Erlenmeyer flask and preincubated for 15 min. After this, 0.1 ml of the appropriate stock solution of 14C-labeled TEA (PerkinElmer Life Sciences, Boston, MA) was added, and the cells were incubated for 2 min (final volume 1 ml) at 37°C. The incubation was stopped by addition of 10 ml of ice-cold buffer. After rapid centrifugation, the cells were washed with an additional 10 ml of buffer, centrifuged, and the supernatant was discarded. The cells were lysed with 0.5 ml of distilled water, deproteinated by addition of 0.5 ml of 10% (w/v) trichloroacetic acid, and centrifuged. Radioactivity in the supernatant was quantified and the results were expressed as nanomoles per milligram of protein.
Determination of Cell Number. Cell yield was determined by visual counting of an aliquot of cell suspension under light microscopy using a standard Neubauer hemacytometer (Hausser Scientific Company, Horsham, PA). The hemacytometer was charged by addition of a 100-μl aliquot, and cell counts were completed by counting a square millimeter of two different samples. The yield was expressed as the total number of cells (i.e., number of cells/ml × milliliters of stock).
Cell Viability. An aliquot of isolated cells was suspended in Hanks-HEPES BSA buffer that was added to an equal volume of 0.04% trypan blue solution. The cells were examined microscopically and considered to be viable if the dye was excluded. The viability was expressed in terms of percentage of total cells (i.e., viable cells/total cells × 100 = viability). Cell preparations with viability of 85% or more were used in experiments.
γ-Glutamyltranspeptidase (γGT). Located in the brush border, γGT has been identified as a marker enzyme for the proximal tubule cell (Neiss and Klehn, 1981). γGT activity of the freshly isolated cells was determined using a commercially available diagnostic kit (Sigma-Aldrich). Activity was expressed in nanomoles of product per minute.
Northern Blotting. At the conclusion of the experiment, the rats were sacrificed using carbon dioxide in a gas chamber. The kidneys were rapidly excised and decapsulated. A thin longitudinal slice of cortex was cut (Stadie-Riggs microtome; 0.5 mm in thickness) from the surface of both sides of each kidney (i.e., four total slices), which were flash-frozen in liquid nitrogen. Total RNA was isolated from cortical tissue using RNAzol-B (Tel-Test Inc., Friendswood, TX). Samples (10 μg), quantified spectrophotometrically, were denatured in formaldehyde, fractionated on 1% agarose gels, and then transferred to a nitrocellulose membrane (GeneScreen Plus; DuPont, Wilmington, DE). Equality of RNA loading per lane was verified by densitometric analysis of ethidium bromide-stained 18S and 28S ribosomal RNA. Plasmids containing rOCT1 and rOCT2 cDNAs were generously provided by Dr. Hermann Koepsell (Universität Würzburg, Germany) and Dr. John Pritchard (National Institute of Environmental Health Sciences, Research Triangle Park NC), respectively. Isolated rOCT1 and rOCT2 cDNAs were randomly labeled with [32P]deoxy-CTP (PerkinElmer Life Sciences) using the random primer method of Feinberg and Vogelstein (1983). After transfer, stringent hybridization and wash procedures were completed according to previously published methods (Church and Gilbert, 1984). Finally, X-ray film was exposed to the membrane and developed for visualization of roct1 or roct2 mRNA.
Immunoblotting. Renal slices (described above) were homogenized in an ice-cold buffer containing 25 mM Tris-HCl (pH 7.4), 3 mM MgCl2, 0.32 M sucrose, 2 mM EGTA, 0.1 mM spermine, and 50 μg/ml each of leupeptin and aprotinin. After microcentrifugation (5 min) at 4°C to remove insoluble cellular material, total protein was determined spectrophotometrically by a commercially available kit using bovine serum albumin as standard (Bio-Rad, Melville, NY). Individual protein samples (20 μg) were fractionated by 10% SDS-PAGE and electrophoretically transferred onto a polyvinylidene diflouride blotting membrane (Immobilon-P; Millipore Corporation, Bedford, MA). The blotting membrane was blocked overnight at 4°C with 5% nonfat dry milk or 5% BSA in a phosphate-buffered saline. The blots were washed and then incubated for 2 h at 25°C with a polyclonal primary antibody (1:1000) of anti-rOCT1 or anti-rOCT2 (Alpha Diagnostic Int., San Antonio, TX). The bound antibody was visualized on X-ray film by chemiluminescence detection using a secondary antibody coupled to horseradish peroxidase (Pierce Chemical, Rockford, IL).
Data Analysis. Densitometric quantification was completed using a NucleoVision imaging workstation camera (NucleoTech Corp., San Carlos, CA) attached to an IBM-compatible computer running the image analysis software GelExpert (NucleoTech Corp.). Values were corrected for background and are expressed as either percentage compared with nondiabetic values for protein expression studies or relative fraction of mRNA transcript to the 18S rRNA for Northern studies. Statistical differences (p < 0.05) were determined by one-way analysis of variance coupled to the Student-Newman-Keuls post test multiple comparisons.
Results
Characteristics of Freshly Isolated PT Cells. A typical isolation of PT cells from a pair of kidneys yielded about 3.2 × 10⁶ cells of which 90% were viable as determined by trypan blue exclusion. The characteristics of PT cells isolated from 21-day diabetic and age-matched nondiabetic rats are shown in Table 1. No statistical differences in yield, viability, γGT activity, or protein content were found between the two groups. Therefore, the uptake data for the kinetic experiments are normalized to milligram of protein.
Comparison of freshly isolated proximal tubule cells from 21-day STZ-diabetic and age-matched nondiabetic rats
Values are the mean ± S.E. of 15 cell isolation experiments.
Kinetic Analysis. Concentration-dependent uptake of TEA in isolated cells from nondiabetic and 21-day diabetic animals was compared by incubating PT cells with TEA at various concentrations for 2 min (Fig. 1). As expected, TEA uptake (nanomoles per milligram of protein per minute) in nondiabetic cells was concentration-dependent and saturable. Uptake in diabetic derived cells was also saturable, but TEA accumulation was significantly lower for all concentrations compared with the nondiabetic derived cells. At the highest concentration (1 mM), the diabetic derived cells accumulated 57% less TEA compared with the nondiabetic cells. Saturable TEA uptake could be described with the Michaelis-Menten equation; the results are shown in Table 2. The Vmax generated by the diabetic PT cells was a significant 46% lower than that from nondiabetic cells. There was no significant difference in the apparent Km between the two cell populations.

Concentration-dependent TEA uptake in proximal tubule cells isolated from 21-day STZ-diabetic and age-matched nondiabetic rats. Concentration-dependent TEA uptake (0.025–1.0 mM) in PT cells was completed in the presence and absence of 5 mM quinine to determine nonspecific uptake. Cell uptake values represent the mean ± S.E. of five different isolations where cell incubation time was 2 min. TEA uptake is expressed as nanomoles per milligram of protein per minute. The solid lines represent the Michaelis-Menten fit in combination with linear diffusion, and the dashed lines represent uptake by diffusion.
Kinetic analysis of TEA uptake in freshly isolated proximal tubule cells from 21-day diabetic and nondiabetic rats
Each value represents the mean ± from five separate cell isolations. k is slope of the individual diffusion lines.
Effect of Duration of Diabetes on rOCT1 and rOCT2 Protein. Immunoblot analysis of OCT1 and OCT2 was conducted to determine the effect of diabetes on organic cation transporter protein levels. The results are summarized in Fig. 2A. An approximate 66- and 76-kDa protein was detected for rOCT1 and rOCT2, respectively, which is consistent with previous reports (Urakami et al., 1998, 1999, 2000). A decrease in both proteins was observed in samples obtained from rats after 14, 21, and 42 days of diabetes compared with the nondiabetics. Densitometric analysis indicated that rOCT1 protein was decreased by 45% after 14 days and rOCT2 protein was decreased by a 53% after 7 days of diabetes (Fig. 2B). The maximal decrease for both proteins was observed at 21 days where rOCT1 and rOCT2 were approximately 50 and 70%, respectively, lower than that observed in the nondiabetics.

Effect of duration of diabetes on the BLM organic cation transport proteins rOCT1 and rOCT2. A, representative individual immunoblots of rOCT1 and rOCT2 are shown. Each lane represents a single animal and was loaded with 20 μg of total protein from a single slice. B, Quantitative analysis of immunoblots was completed by densitometry of two separate experiments. Each value represents the mean ± S.E. of four animals where nondiabetic values were set to 100% for comparison of diabetic values. An asterisk indicates a significant difference (p < 0.05) from the nondiabetic value.
Effect of Duration of Diabetes onroct1androct2Expression. To determine whether changes in transport protein were due to diabetes-related alterations of gene expression, roct1 and roct2 expression was examined in rats with increasing duration of diabetes. Transcripts of 1.9- and 2.2-kilobase roct1 and roct2, respectively, were detected (Fig. 3A). Expression of roct1 was not statistical different in diabetics compared with rats in the nondiabetic group (Fig. 3, A and B). On the other hand, roct2 was significantly decreased within 14 days of diabetes and maximally decreased by about 50% after 21 days.

Effect of duration of diabetes on roct1 and roct2 mRNA. A, individual Northern blots of rOCT1 and rOCT2 are shown. Each lane represents a single animal and was loaded with 10 μg of total RNA from a single slice. The ribosomal 28S and 18S units are shown for comparison of actual total RNA loaded per well. B, densitometric analysis of oct1 and roct2. Each value represents the relative fraction of roct1 or roct2 to 18S and is reported as the mean ± S.E. Asterisk (*) indicates significant difference (p < 0.05) from the nondiabetic value.
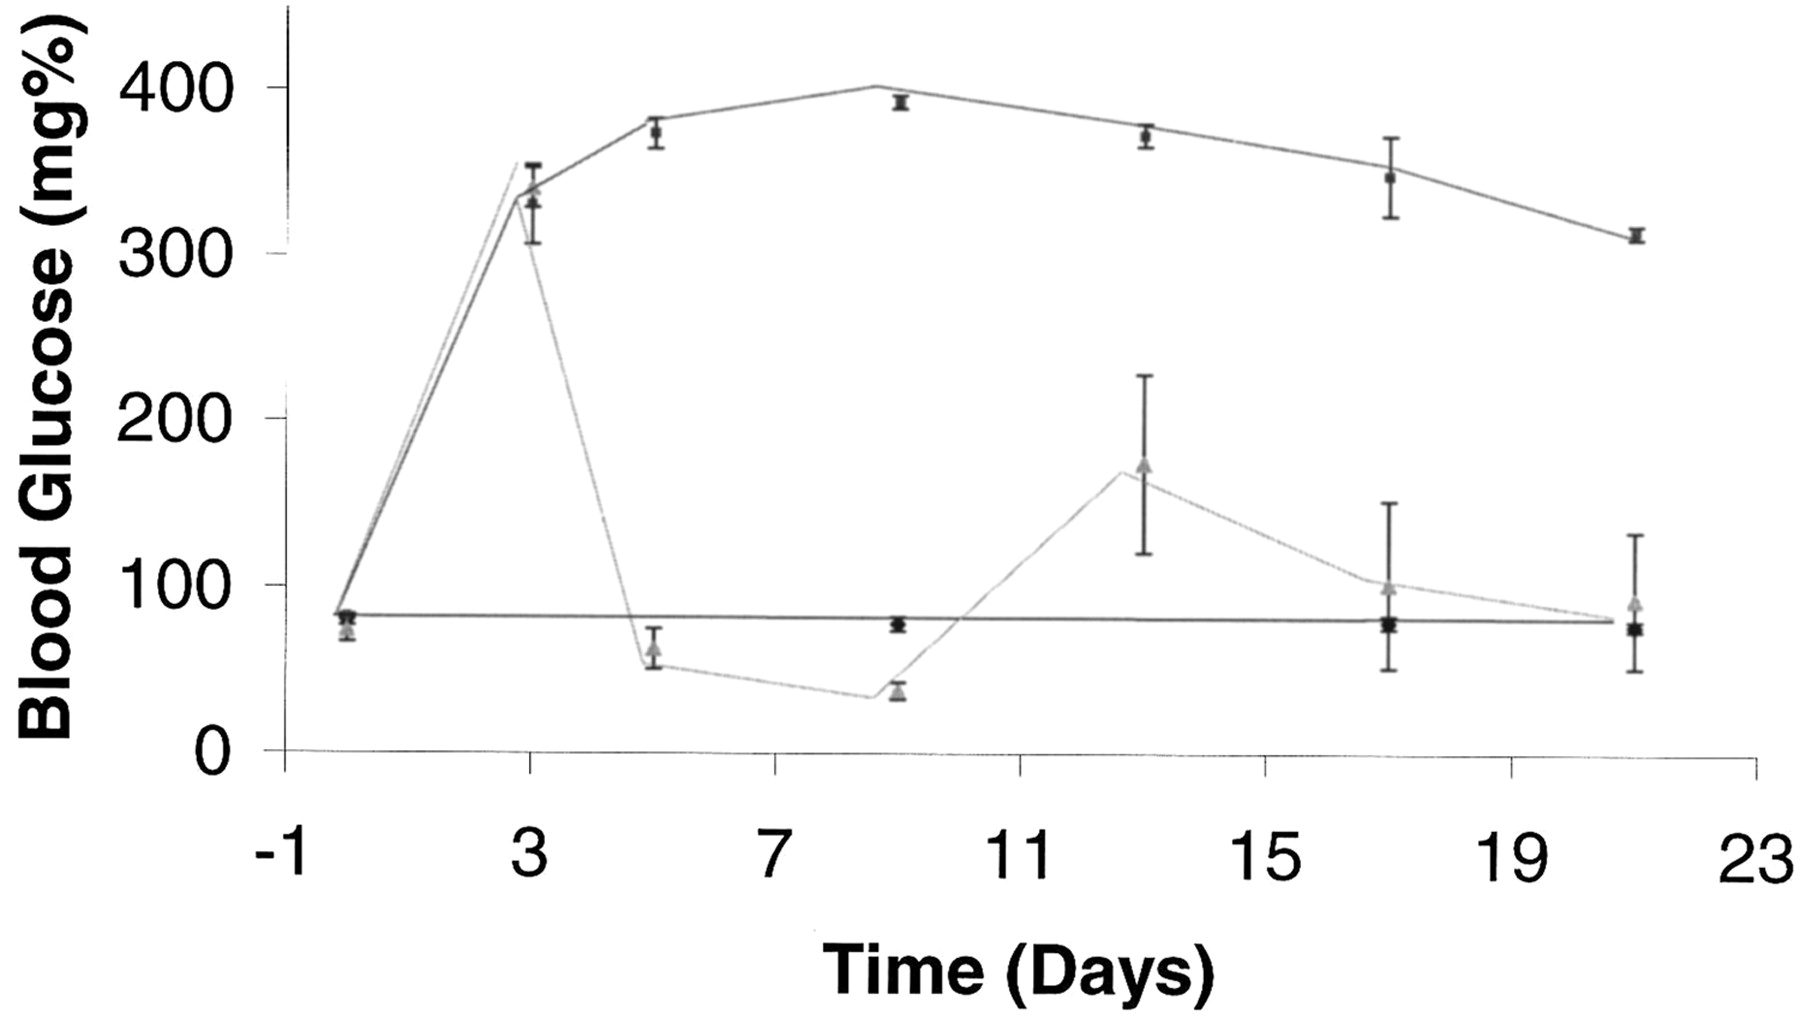
Effect of Insulin Treatment. Based on these results, an experiment was conducted to test whether early insulin treatment could prevent the observed changes in transporter expression. Rats were assigned to the following groups: 1) nondiabetic, 2) untreated diabetic, and 3) diabetic + insulin. Figure 4 shows blood glucose concentrations determined over the 21-day experimental period. Values for the untreated diabetic rats remained above 300 mg/dl, whereas those in the insulin-treated diabetics were significantly lower and, in fact, fluctuated around the nondiabetic group values. The effect of insulin treatment on the expression of the transport proteins on day 21 is shown in Fig. 5. As demonstrated in Fig. 2A, a decrease in both proteins occurred after 21 days of diabetes compared with the nondiabetics. Densitometric results shown in Fig. 5B, revealed that rOCT1 protein in the insulin-treated rats was significantly greater (69% of nondiabetic rat value) compared with that determined in the untreated diabetic rats (41% of nondiabetic rats). The rOCT2 protein level was not significantly different from nondiabetic rats. The effect of insulin treatment on roct1 and oct2 mRNA expression is shown in Fig. 6. There were no significant differences in expression of roct1 mRNA among the three groups. On the other hand, insulin treatment significantly attenuated the diabetes-related decrease in roct2 mRNA expression.

Blood glucose concentrations for the insulin study. Three groups were monitored for 21 days: 1) nondiabetic (squares), 2) diabetic (circles), and 3) diabetic + insulin (triangles). Each value represents the mean ± S.E. of four animals.
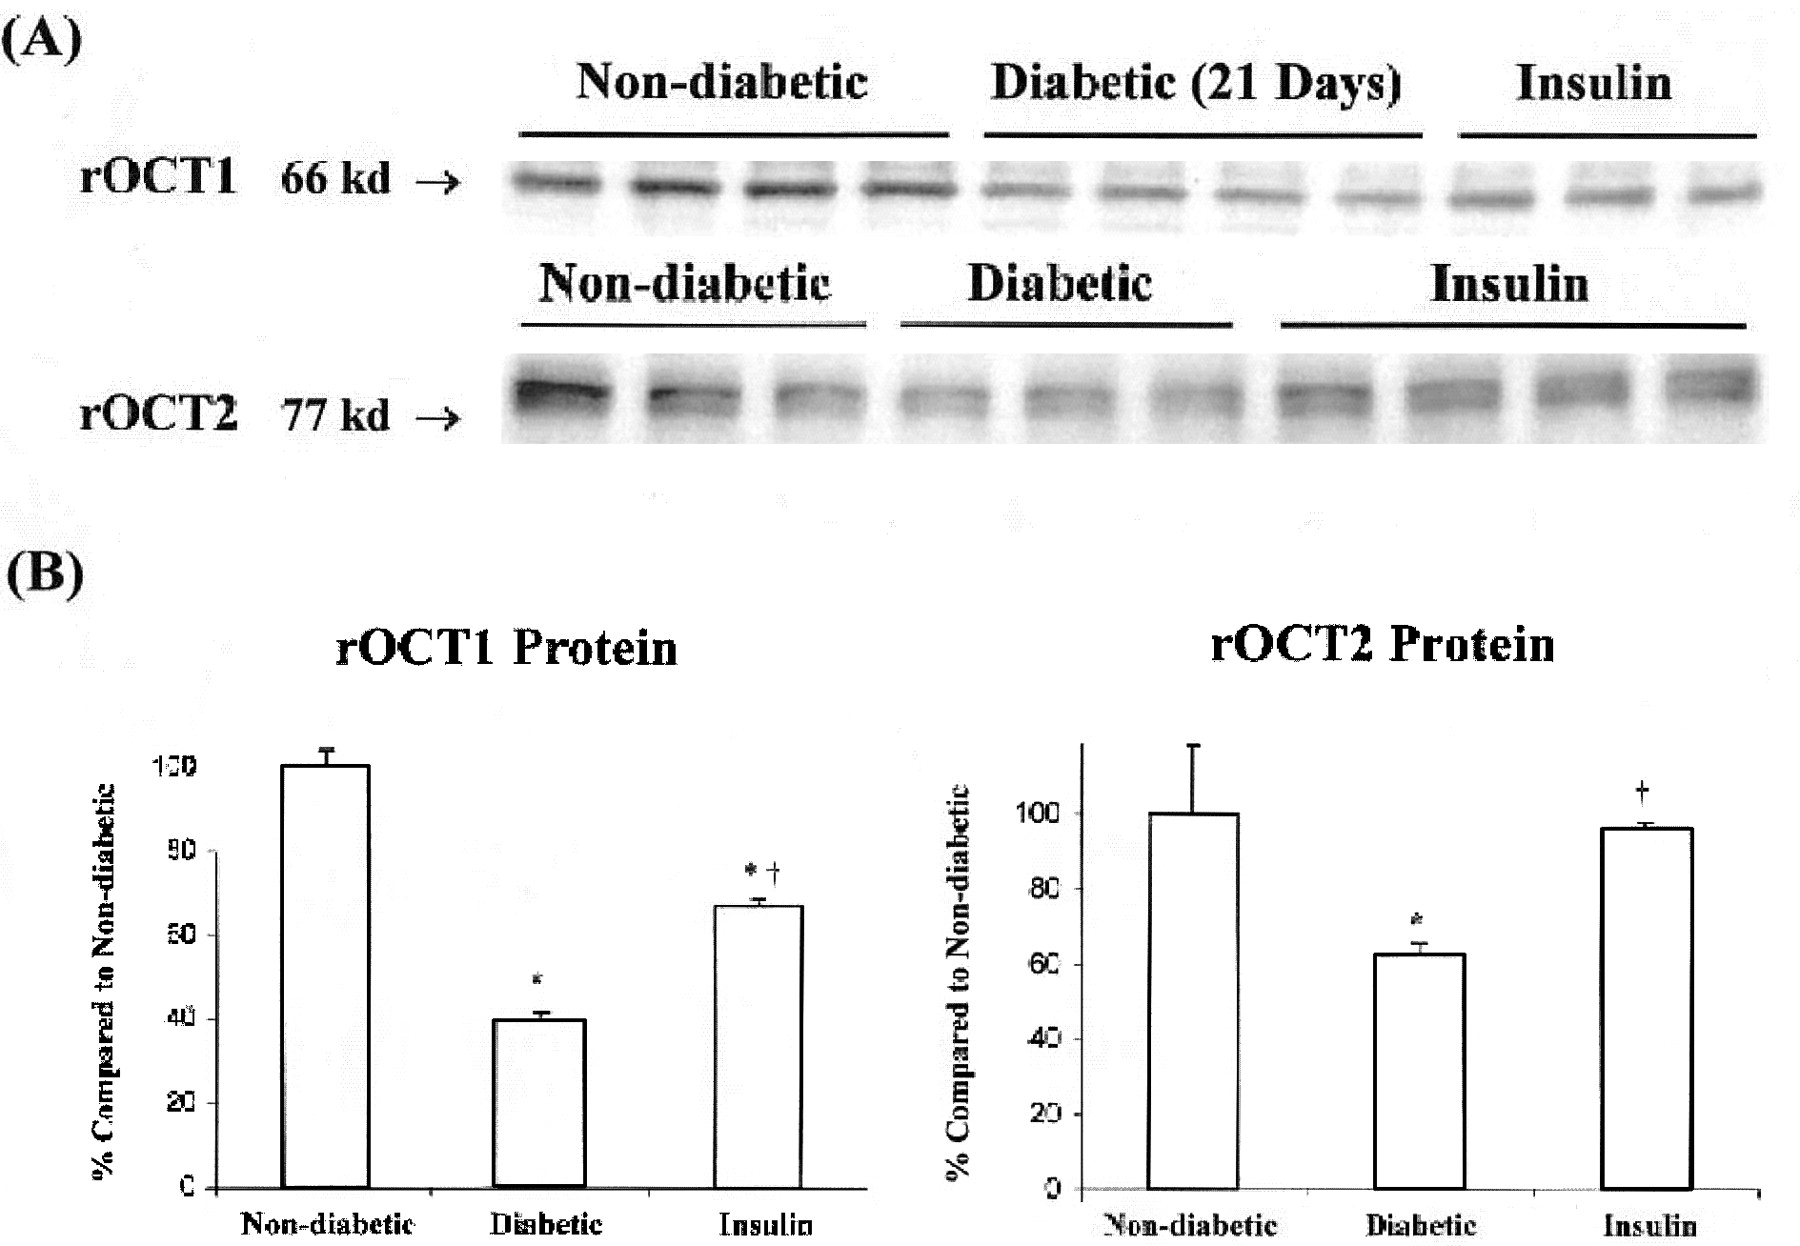
Effect of insulin-treated diabetic animals on the transport proteins rOCT1 and rOCT2. A, immunoblots of rOCT1 and rOCT2 are shown. Each lane represents a single animal and was loaded with 20 μg of total protein from a single slice. B, quantitative analysis of immunoblots. Each value represents the mean ± S.E. Nondiabetic values were set to 100% for comparison of diabetic values. An asterisk (*) indicates significant difference (p < 0.05) from the nondiabetic value. † indicates significant difference (p < 0.05) from the diabetic value.
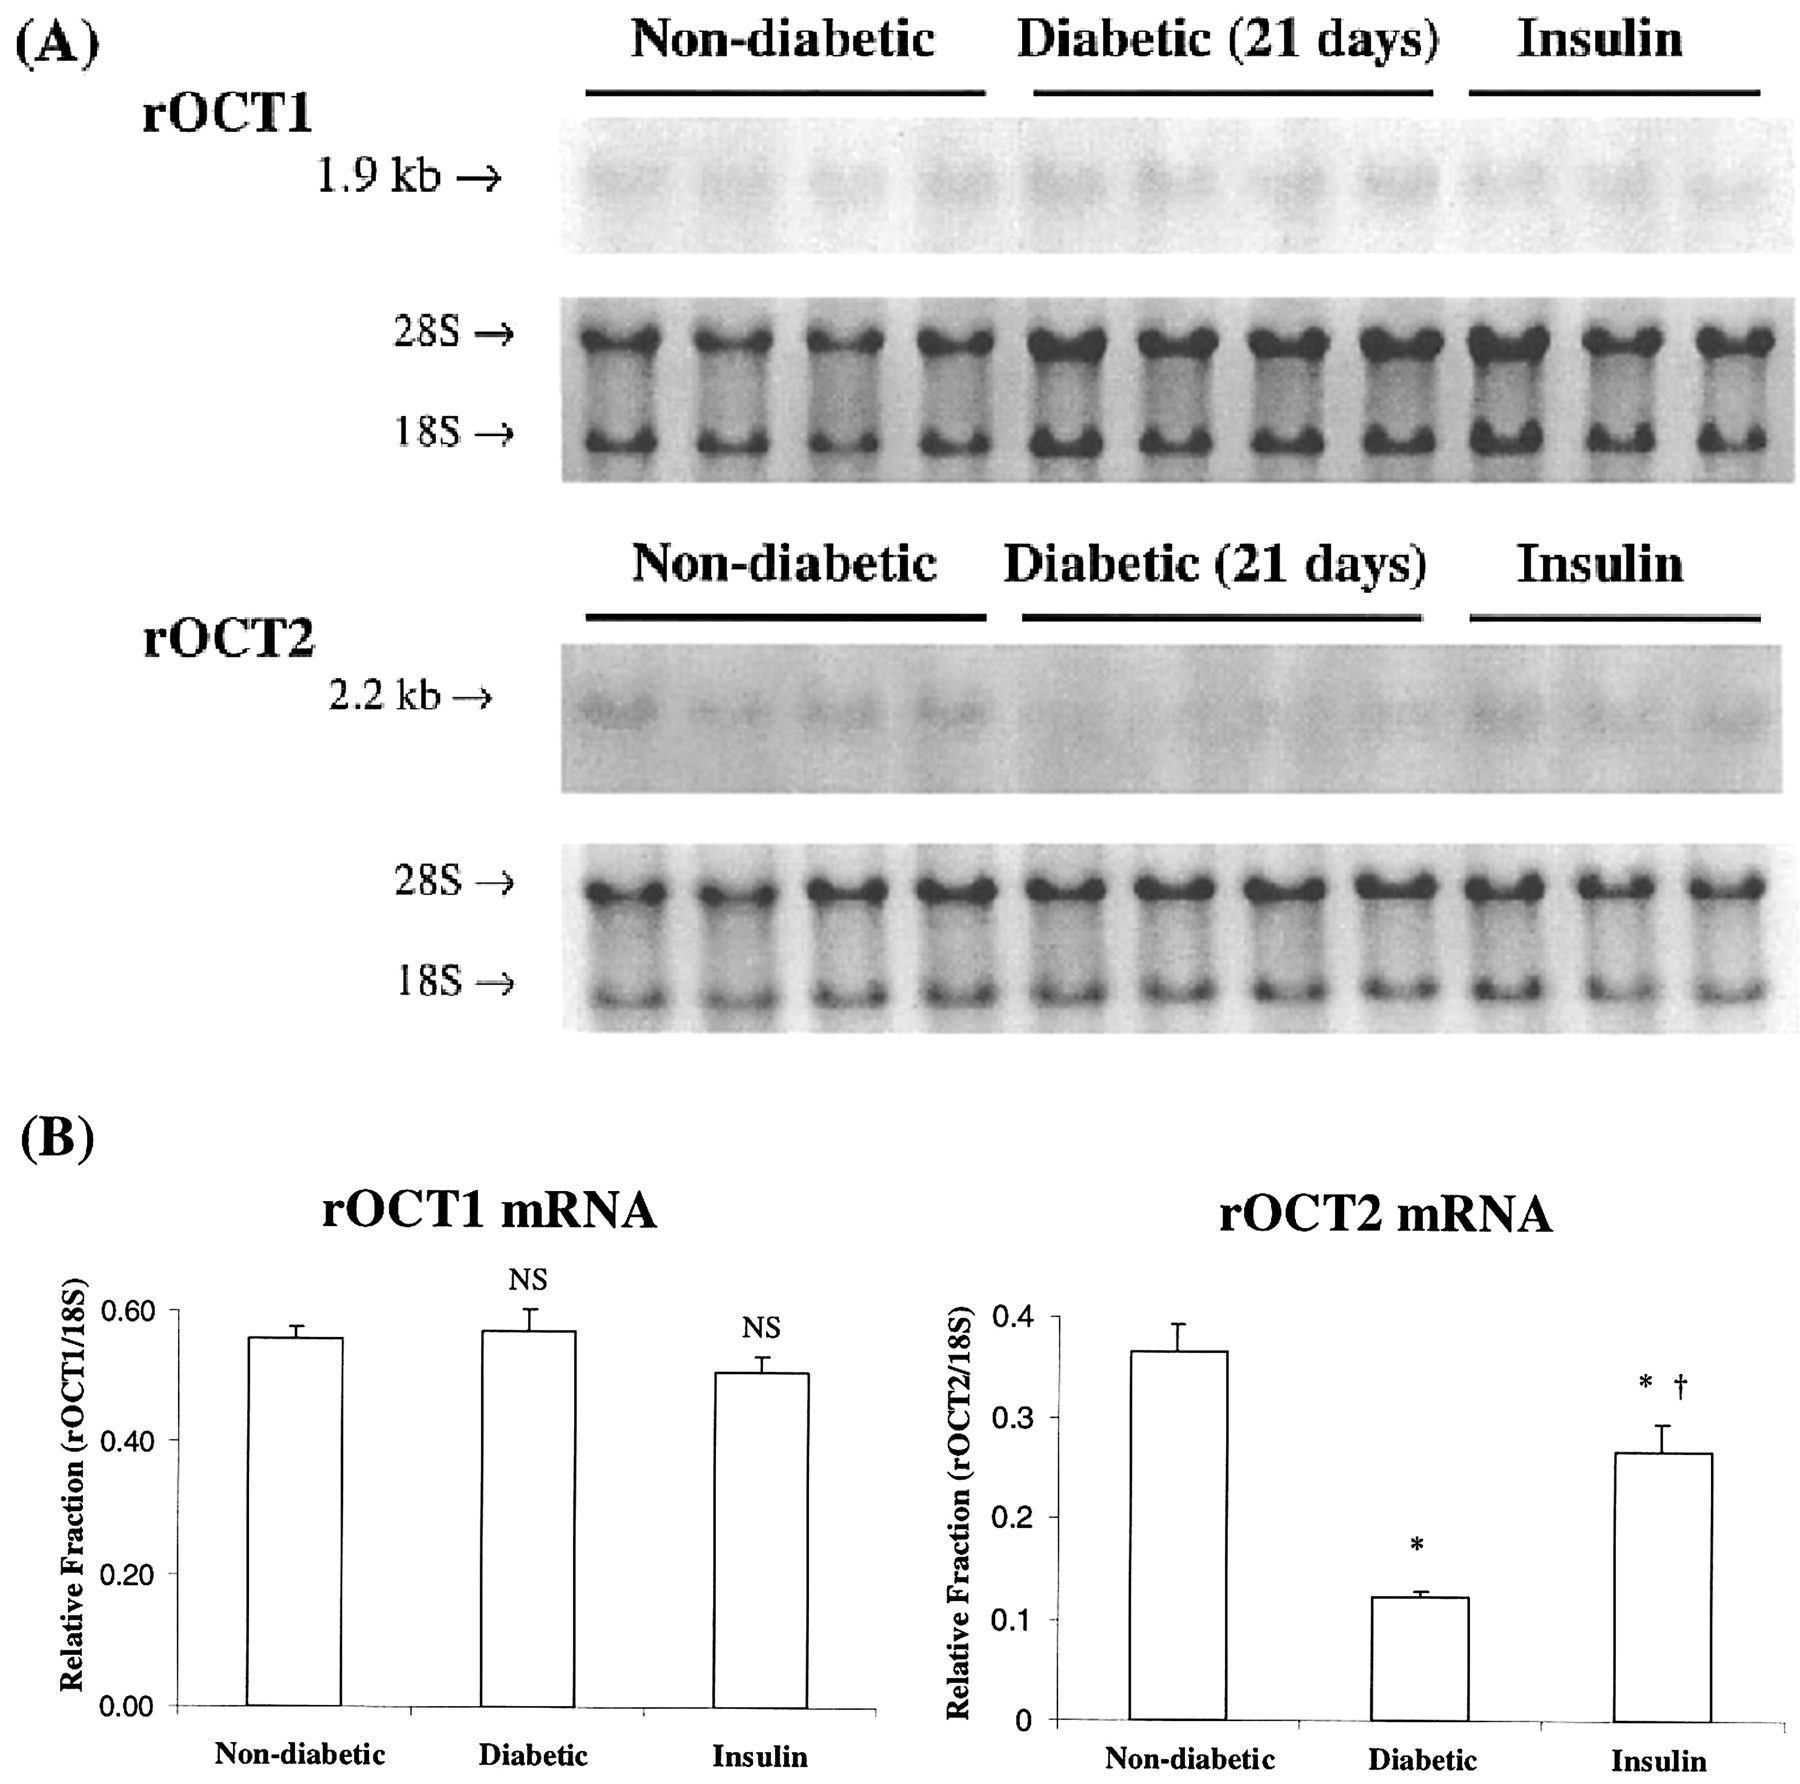
Effect of insulin-treated diabetic animals on rOCT1 and rOCT2 mRNA. A, individual Northern blots of rOCT1 and rOCT2 are shown. Each lane represents a single animal and was loaded with 10 μg of total RNA from a single slice. The 28S and 18S ribosomal units are shown for comparison of actual total RNA loaded per well. B, densitometric analysis of rOCT1 and rOCT2. Each value represents the relative fraction of rOCT1 or rOCT2 to 18S and is reported as the mean ± S.E. An asterisk indicates significant difference (p < 0.05) from the nondiabetic value.
Discussion
The importance of a functional cation transport system for efficient renal excretion of therapeutic and toxic substances is well documented. In this study, we demonstrated that STZ-induced diabetes decreased basolateral organic cation transporter expression (Fig. 2). The decline was rapid with rOCT2 expression decreased by more than 50% within 7 days after induction of diabetes and that for rOCT1 by 14 days. These results coincide with the functional decline pattern for TEA uptake in cortex slices derived from STZ diabetic rat kidneys that were recently reported by Grover et al. (2002). In this study, decreased TEA accumulation in rat renal cortex slices was evident after 7 days of STZ-induced diabetes and was attenuated by 14 days with the maximal decline detected by 21 days. These results clearly suggest a mechanistic link between function and rOCT expression. Our kinetic data also support this conclusion. However some comments on the limitations of the kinetic data are in order. In this initial report of the effect of diabetes on rOCT and roct levels, we felt that our kinetic experiments should be compared with reports from investigators who used a kinetic approach in normal rats that included the isolation and incubation techniques that we used. Under these conditions, Boom et al. (1992) reported that TEA uptake into PT cells from normal rats was linear during the first 4 to 5 min of incubation. An earlier report by Boogaard et al. (1989) had shown the same linearity limit for N1-methylnicotinamide. Accordingly, we applied their 2-min time for comparison reasons. The relatively long period may have allowed an unknown level of outflux of the TEA. Although this may have been a source of error, nevertheless, the Vmax and k values for TEA in our nondiabetic rats are similar to those reported by Boom et al. (1992).
Northern blot analysis showed that roct2 mRNA levels declined in a manner corresponding to the protein expression results (Fig. 3). This suggests that diabetes alters transcription of rOCT2. In contrast, roct1 mRNA levels were unchanged regardless of the duration of diabetes, an unexpected result that did not correspond with the apparent decline of rOCT1 protein. This suggests post-transcriptional alteration of rOCT1 may occur in diabetes. Although the mechanism of this is unclear, a logical progression would implicate nonenzymatic glycation of proteins, a leading mechanistic hypothesis for development of diabetic end-organ damage (Brownlee, 1995).
Hyperglycemia promotes excessive attachment of glucose to amino acids (primarily lysine) to extracellular and intracellular proteins, resulting in an initial reversible Schiff base adduct that can ultimately become an irreversible advanced glycation end product. The resulting residues presumably change the structure and/or functionality of the affected proteins. The monitoring of degree of glycation of hemoglobin (in this case, a model intracellular protein) is commonly measured in diabetic patients on the assumption that this provides a value that predicts diabetic complications. The glycation process can be reasonably fast. We have documented a near doubling of glycation of hemoglobin within 7 days after STZ injection in rats (Grover et al., 2002). Although rOCT1 protein may actually be decreased despite an unchanged mRNA level, at this point, we cannot eliminate the possibility that the lowered protein expression may have been due to an inability of the anti-OCT1 antibody to recognize the excessively glycated protein.
Although this is the first demonstration of down-regulation of organic cation transporters in a diabetes model, adaptations of the facilitative glucose transporters have been demonstrated in STZ-induced diabetes in both functional and molecular studies (Dominguez et al., 1994; Chin et al., 1997; Noonan et al., 2001). Goralski et al. (2001) reported enhanced transport of the antiviral drug amantadine after 4 days of STZ-induced diabetes via a bicarbonate-dependent transporter the nature of which is yet to be defined. These, together with the present study, suggest that experimental diabetes is associated with significant alterations of organic substrate transporter levels. At present, little is known about regulation of this transport system (for review, see Berkhin and Humphreys, 2001). The primary structure of the OCT transport proteins includes potential phosphorylation sites for protein kinase C and protein kinase A. Mehrens et al. (2000) demonstrated enhanced transport subsequent to activation of tyrosine kinases. They further provided evidence that protein kinase C phosphorylates rOCT1 and suggested that this may be responsible for altering the substrate affinity of the transport protein. Other mechanisms that regulate transcription and/or translation may be involved in experimental diabetes. Working within the diabetic model, insulin is an obvious potential candidate for altering transcription or translation. This hormone is well known to affect both processes in multiple cell types (Kimball et al., 1994; O'Brien and Granner, 1996). Indeed, when exogenous insulin was administered in this study, normal levels of rOCT protein and mRNA were maintained (Figs. 5 and 6). This result argues against the likelihood that the decrease of transporter expression was due an acute toxic action of STZ or an artifact of the experimental design. Therefore, it is reasonable to conclude that the observed changes documented in this study can be traced to the diabetic state itself.
More than 30 years ago, Bowman and Hook (1972) observed that testosterone affected the functional transport of TEA in renal cortical slices. The mechanism remains unresolved. However, recent molecular studies by Urakami et al. (1999, 2000) indicate that testosterone increased expression of rOCT2 protein and mRNA in normal rats. Slitt et al. (2002) have demonstrated that male rats express 4 times the amount of roct2 mRNA in kidney compared with that from females and showed that gonadectomy in males resulted in mRNA expression approximating the significantly lower level found in females. All rats in the current study were males. These observations suggest a regulatory role for androgens in the maintenance of rOCT transporters. Studies using an experimental diabetes model may prove useful in light of the fact that male diabetic rats are deficient not only insulin but also of testosterone (Ikeda et al., 2000; Tanaka et al., 2001). Furthermore, the activities of these two hormones may be intertwined. Morimoto et al. (2001) demonstrated that testosterone has a direct positive effect on insulin gene expression in pancreatic beta cells. Clearly, more research will be needed to define the roles of hormones in the regulation of organic cation transporters.
Although the primary structural characteristics of the typical rOCT substrate includes a hydrophobic backbone and a positive charge, cisplatin, an inorganic nephrotoxic anticancer drug, was recently identified as an atypical substrate that accumulates in the S3 segment of rat proximal tubule (Pan et al., 1999; Endo et al., 2000). This is of interest because the significant decrease in rOCT2 expression at the protein level demonstrated in the present study provides a novel mechanism for the remarkable “protection” afforded to STZ-diabetic rat kidneys against cisplatin-induced nephrotoxicity (Scott et al., 1989). It is clear that this protection is related to less accumulation of the toxicant versus levels seen in nondiabetics (Sarangarajan and Cacini, 1996, 1997). A deficit of rOCT2 expression in the basolateral membrane could, at least in part, explain these observations.
In conclusion, this study has provided evidence that previously reported impaired organic cation transport at the BLM in experimental diabetes is associated with decreased rOCT1 and rOCT2 protein. The mechanism mediating the protein insufficiency seems to reside post-transcriptionally for rOCT1, whereas differences in rOCT2 protein may result from transcriptional and/or translational changes.
Footnotes
-
DOI: 10.1124/jpet.103.058388.
-
ABBREVIATIONS: STZ, streptozotocin; OCT, organic cation transporter; BLM, basolateral membrane; TEA, tetraethylammonium; γGT, γ-glutamyltranspeptidase; BSA, bovine serum albumin.
- Received August 18, 2003.
- Accepted November 25, 2003.
- The American Society for Pharmacology and Experimental Therapeutics


