


Abstract
An array of adverse steroid effects was examined on a whole body, tissue, and molecular level. Groups of male adrenalectomized Wistar rats were subcutaneously implanted with Alzet mini-pumps giving zero-order release rates of 0, 0.1, and 0.3 mg/kg/h methylprednisolone for 7 days. The rats were sacrificed at various times during the 7-day infusion period. A two-compartment model with a zero order input could adequately describe the kinetics of methylprednisolone upon infusion. Blood lymphocyte counts dropped to a minimum by 6 h and were well characterized by the cell trafficking model. The time course of changes in body and organ (liver, spleen, thymus, gastrocnemius muscle, and lungs) weights was described using indirect response models. Markers of gene-mediated steroid effects included hepatic cytosolic free receptor density, receptor mRNA, tyrosine aminotransferase (TAT) mRNA, and TAT levels. Our fifth-generation model of acute corticosteroid pharmacodynamics was used to predict the time course of receptor/gene-mediated effects. An excellent agreement between the expected and observed receptor dynamics suggested that receptor events and mRNA autoregulation are not altered upon 7-day methylprednisolone dosing. However, the model indicated a decoupling between the receptor and TAT dynamics with this infusion. The strong tolerance seen in TAT mRNA induction could be partly accounted for by receptor down-regulation. An amplification of translation of TAT mRNA to TAT and/or a reduction in the enzyme degradation rate could account for the observed exaggerated TAT activity. Our results exemplify the importance of biological signal transduction variables in controlling receptor/gene-mediated steroid responses during chronic dosing.
The clinical use of steroids is extensive and frequently chronic. Corticosteroids currently are among the most important drugs used for the treatment of a variety of immunological conditions such as lupus erythematosus, rheumatoid arthritis (Canvin and el-Gabalawy, 1999), organ transplantation, bronchial asthma (Boushey, 1998), and inflammatory bowel disease (Selby, 1993), to name a few. Short-term treatment in acute or transient illness is generally not associated with major side effects. However, the multiple and potent metabolic effects of steroids become prominent upon chronic dosing, leading to an increased risk of toxicity thus limiting their usefulness. The undesirable metabolic effects of corticosteroids cannot be completely separated from their favorable anti-inflammatory effects because most actions are manifested using the same glucocorticoid receptor. The integrated effects result in hyperglycemia, negative nitrogen balance, and fat redistribution leading to complications, including diabetes, muscle wasting, hypertension, cataracts, and peptic ulcers (David et al., 1970; Baxter and Forsham, 1972; Swartz and Dluhy, 1978). Another important clinical consequence of long-term use of steroid is adrenal insufficiency after withdrawal of therapy (Swartz and Dluhy, 1978).
Because the principal undesirable effects of steroids are manifested only upon long-term dosing, it can be expected that there might be additional factors contributing to the dynamics of steroid responses under these dosing conditions. Results (Ramakrishnan, 2001) from steady-state studies conducted previously in our laboratory suggested that a decoupling between receptor and enzyme dynamics occurs upon long-term continuous dosing of steroid in male adrenalectomized rats. It is possible that nuclear molecular events (receptor translocation, chromatin binding) are altered upon chronic dosing. On the other hand, signal transduction processes involved in generation of the response can be amplified/diminished due to global systemic effects of the steroid. Corticosteroid responses may be countered by other hormones whose circulating levels are affected by prolonged steroid exposure (Baxter and Forsham, 1972). For instance, the release of insulin is stimulated in response to hyperglycemia, thus partly reversing steroid effects on gluconeogenesis. An understanding of the in vivo receptor regulation machinery and components of the transduction processes upon long-term steroid treatment is vital for successful steroid hormone therapy. Hence, it is of interest to investigate and model the response of the system upon administration of lengthy steroid dosage regimens. Our current model of gene-mediated corticosteroid effects provides an ideal tool to detect the components of the receptor/signal tranduction system responsible for any decoupling of acute versus chronic steroid effects.
Our 1-week methylprednisolone infusion studies reported previously were designed to characterize steady-state responses with respect to body weight loss, changes in organ weights, and receptor/tyrosine aminotransferase (TAT) levels. Although we noted that the steady-state receptor dynamics occurred as expected, the ultimate TAT response seemed to be exaggerated. This was a single 7-day time point study and we did not obtain any information on the time course of changes in the various dynamic measures. This made it difficult for us to make extrapolations regarding any differences between acute versus long-term steroid effects. In this report, we have therefore extended our studies to uncover the entire profile of temporal changes in the various steroid effects. Rats were administered two infusion regimens for 7 days, which allowed steady-state conditions to be achieved. By using s.c. infusion regimens instead of multiple i.v. doses, we could collect a rich data set with relatively few animals. Also, the use of two different infusion rates enabled us to assess the role of dose size, rate of drug input, and duration of exposure on the dynamics. Various measures of toxicity and immunosuppression were measured as well during different times over the infusion period.
The undesirable metabolic effects of steroids were quantitated at three levels as follows: 1) whole body (body weight loss); 2) tissue (changes in liver, spleen, thymus, lungs, muscle, heart, and kidney weights); and 3) molecular (down-regulation of receptor mRNA, free receptor density, and enhancement of TAT mRNA and TAT enzyme activity). Changes in blood lymphocyte counts were used as a marker of the rapid immunosuppressive effects of the steroid.
Simulations were performed using the fifth-generation model for corticosteroid receptor/gene-mediated effects to obtain the expected time course of receptor and TAT dynamics. Comparisons were made between the expected and observed data patterns. The TAT dynamics was fitted to the model to obtain parameters specific for the long-term infusion effects. The most prominent differences in the parameters were evaluated and used to make judgments as to which model components could have been possibly altered upon long-term dosing.
Materials and Methods
Animals
Adrenalectomized male Wistar rats with body weights of 339 ± 28 (S.D.) g were used in the study. All animals were housed in our University Laboratory Animal Facility maintained under constant temperature (22°C) and humidity with a controlled 12-h light/dark cycle. A time period of at least 2 weeks was allowed before they were prepared for surgery. Rats had free access to rat chow and 0.9% NaCl drinking water. This research adheres to Principles of Laboratory Animal Care (National Institutes of Health publication 85-23, revised 1985) and was approved by the Institutional Animal Care and Use Committee of the State University of New York at Buffalo.
Experimental
Rats were divided into four groups. Two treatment groups containing 36 rats each were administered 0.1 and 0.3 mg/kg/h infusions of methylprednisolone sodium succinate (Solu-Medrol; The Upjohn Company, Kalamazoo, MI) reconstituted in supplied diluent. The infusions were given using Alzet osmotic pumps (model 2001, flow rate 1 μl/h; Alza, Palo Alto, CA). The pump drug solutions were prepared for each rat based on its predose body weight. On the day of implantation, rats were anesthetized using 60 to 80 mg/kg ketamine and 8 to 10 mg/kg xylazine i.m. Pumps were subcutaneously implanted between the shoulder blades on the back. Rats were sacrificed at various times up to 7 days, the time points included being 6, 10, 13, 18, 24, 36, 48, 72, and 96 h. The third group (eight rats) was administered an i.v. bolus dose of 50 mg/kg. There were four rats sacrificed after 5 h and the remaining four at the end of 6 h. The control group of eight animals was implanted with a saline-filled pump and sacrificed at various times throughout the 7-day study period. Before pump implantation, the body weight of each rat was measured and a blood sample was withdrawn from the tail vein to obtain the predose blood lymphocyte counts. The body weight of each rat was recorded upon sacrifice and the sacrifice blood was used to determine the plasma methylprednisolone concentrations and the lymphocyte counts. Various organs, including the heart, kidney, gastrocnemius muscle, lungs, spleen, thymus, and liver were excised and weighed. One gram of liver tissue was immediately processed for TAT enzymatic activity measurements and the remaining liver tissue was flash frozen for cytosolic receptor mRNA, free receptor density, TAT mRNA, and cAMP measurements. Thus, from each rat, we obtained one pharmacokinetic measurement (sacrifice methylprednisolone plasma concentrations) and three sets of pharmacodynamic measurements, including the body weight/organ weight changes, blood lymphocytes, and gene-mediated effects (hepatic receptor regulation and TAT dynamics).
Assays
Normal phase high-performance liquid chromatography with a limit of quantitation of 10 ng/ml was used to measure plasma methylprednisolone concentrations (Ebling et al., 1985; Sun et al., 1998b). A previously established radiolabeled ligand binding assay (Boudinot et al., 1986; Sun et al., 1998a) was used to quantitate the free receptor density in rat liver cytosol. The cytosolic receptor density (B
max) was estimated by solving the following equations simultaneously:
Pharmacokinetic/Pharmacodynamic Model
Pharmacokinetics.
The pharmacokinetics of methylprednisolone for the rats administered the infusion regimens were described by a two-compartment model with a zero-order inputk
0 into the central plasma compartment as follows:
Pharmacokinetic and toxicity parameters upon long-term steroid infusion in male ADX rats
Pharmacodynamics.
Fittings for all doses were performed simultaneously and the data from all individual rats were used for the analysis.
Body Weight.
The catabolic effects of the steroid on the body were modeled using indirect response model IV (Dayneka et al., 1993) with the stimulation function applied to the degradation rate as follows:
Organ Weight.
Organ weight ratios based on the control organ weights and predose body weights of the treated rats were calculated. The organ weights of the control animals were normalized by the corresponding body weights. The mean of these was then calculated to obtain the ideal organ weight ratio. A predose organ weight was calculated for each treated animal based on its predose body weight and the ideal organ weight ratio. The organ weight ratio was simply a ratio of the measured organ weight at the time of sacrifice and the estimated predose organ weight. The changes in organ weight ratio were modeled using indirect response models (Dayneka et al., 1993). The hypertrophy of the liver was modeled using a stimulation functionS(t) on the production rate, whereas the stimulation function was applied to the degradation rate to capture the net catabolic effects on the lymphoid tissues, lungs, and muscle. The differential equations used included the following:
Gene-Mediated Effects.
An intracellular model as depicted in Fig. 1 was used to describe the receptor-gene-mediated corticosteroid effects of methylprednisolone in terms of changes in receptor dynamics and TAT induction in the rat liver cytosol. This is the most current model (Ramakrishnan, 2001), which was developed by our laboratory based on acute dosing of MPL in rats. The major components of the model included the following.

Fifth-generation model for long-term corticosteroid receptor/gene-mediated effects. The dotted lines leading to the open and closed rectangles indicate stimulation and inhibition of the first order synthesis rate of the response variable. The model is described in the text from eqs. 7 to 14.
Down-Regulation of Receptor mRNA as Controlled by Activated Steroid Receptor Complex.
An inhibition of receptor gene transcription k
syn_Rm by the activated drug-receptor complex in the nucleus DR(N) was assumed to be the major mechanism of receptor mRNA (R
m) down-regulation as follows:
Receptor Dynamics.
Free receptor density in liver cytosol was modeled by taking into account the kinetics of drug-receptor binding (k
on), receptor recycling (k
re/R
f), translation of receptor mRNA (k
syn_R), and turnover rate of the receptor (k
dgr_R) as follows:
The differential equations for the drug-receptor complex in the cytoplasm DR and that bound to the GRE in the nucleus DR(N) were given as follows:
Induction of TAT mRNA.
The enhancement in the zero order synthesis (k
syn_tm) of TAT mRNA was dependent on the amount of activated steroid-receptor complex bound to the GRE in the nucleus, as controlled by the linear efficiency constant of gene transcription (S) and the basal degradation rate (k
dgr_tm) as follows:
Induction of TAT.
The sequential processes in the model culminate with the enhanced expression of TAT as governed by the translation rate of mRNA (EF) and its first order degradation (k
dgr, TAT). The differential equation describing TAT dynamics is as follows:
Parameters for acute and long-term receptor/gene-mediated steroid effects
The above-mentioned equation along with the estimated parameters was used to predict the time course of organ weight ratios throughout the 7-day treatment period for the two infusion groups. The predicted message levels for receptor and TAT were divided by the corresponding predicted liver weight ratios to account for the dilution in the mRNA levels that were expressed on a per gram basis. The parameters for the receptor dynamics were fixed, whereas the TAT mRNA and TAT data from our infusion study were fitted to the model to obtain parameters specific for long-term dosing.
Lymphocyte Trafficking.
A cell trafficking model was used to describe the change in blood lymphocyte counts. According to this model, lymphocytes from the tissues enter into blood at a constant zero order rate k
in and return from the blood to these extra vascular sites is controlled by a first order ratek
out. It is assumed that steroids instantaneously cause a change in the affinity of these extracellular tissues, thus inhibiting the egress of lymphocytes from the blood to tissues. Hence, an inhibition function was applied on the zero order entry rate k
in as follows:
All data analyses were performed using the ADAPT II software (D'Argenio and Schumitzky, 1997) by using the maximum likelihood method. The extended least-squares variance model was specified asV(ς,θ,t i) = ς1 2 ·Y(θ,t i)ς2where V(ς,θ,t i) is the variance for the ith point, θ represents the structural parameters and ς1 and ς2 are the variance parameters that were fitted. Different variance parameters were estimated for each data set that was obtained by a different assay methodology.
Results
The results reported here are the latest from a series of “giant rat” studies conducted in our laboratory that involves sacrificing animals to obtain serial blood and tissue samples. The data generated is such that each point represents the measurement from one separate rat and in effect, the measurements from all these different rats are pooled to obtain a time course as though it was obtained from one giant rat. A naive pooled data analysis approach was therefore used for all model fittings.
Pharmacokinetics
The plasma methylprednisolone concentrations-time profiles after the two infusion regimens are shown in Fig.2. Methylprednisolone is known to undergo nonlinear interconversion and oxidative elimination processes in rats (Kong and Jusko, 1991). Plasma protein binding is constant (77%) with concentration (Haughey and Jusko, 1992). Steady-state concentrations in the infusion study were 100-fold lower than that in the previous bolus studies (Sun et al., 1998a,b). Hence, CL was estimated from the infusion data. The ascending part of the curve, which gives us information regarding the absorption of the drug from the subcutaneous site, was unavailable and hence the tissue distribution constants and the volume of distribution were fixed based on the previous bolus estimates. Furthermore, it was assumed that the bioavailability is complete and the absorption rate is much faster than the rate of drug release from the pump. The clearance increased from 4 to 5.6 l/h/kg, which suggests that higher concentrations are associated with saturation of drug-metabolizing enzymes. Table 1 lists the pharmacokinetic parameters describing the data for the two infusion regimens.

Pharmacodynamics
Body Weights.
The control animals showed constant body weights. The two infusion groups showed dose-dependent losses in body weights, which continued throughout the treatment period (Fig.3). The low- and high-dose groups fell to 89 and 82% of control by 96 h. The model could satisfactorily capture the loss in body weight for both groups. As listed in Table 1, the k deg,S max and SC50values are comparable to those estimated in our previous study (Ramakrishnan, 2001). These parameters were used to perform simulations for the expected loss in body weight upon acute dosing. The high-dose group given an infusion rate of 0.3 mg/kg/h received a total dose of 50.4 mg/kg in 7 days. Figure 4 shows a simulation for the changes in body weight for a 50.4-mg/kg i.v. bolus dose as predicted by our model. The simulations show that when such a high dose of steroid is administered as a single i.v. bolus, hardly any loss in body weight is expected, whereas the same total dose given in the form of 7-day infusion could be expected to cause substantial losses in body weight. The dose- and duration-dependent steroid effects on body weight can be explained by considering the pharmacokinetics of methylprednisolone. The steroid is almost completely cleared from the circulation in 6 h after an i.v. bolus dose, whereas methylprednisolone concentrations are maintained above the SC50 for 7 days after the infusion regimen, leading to a continued body weight loss in these rats.

Indirect response model for effects of methylprednisolone on body weight (top) and the time course of changes in body weights for the 0.1-mg/kg/h (●) and 0.3 mg/kg/h (○)-infusion groups (bottom). The solid and broken lines are the simultaneous fittings for the two dose levels by using eq. 4.

Simulations for the expected change in body weight for a 7-day 0.3-mg/kg/h infusion (broken line) and 50.4-mg/kg i.v. bolus (solid line) dose (top). Simulated pharmacokinetic profiles after administration of a 7-day infusion at a rate of 0.3 mg/kg/h (broken line) and a 50-mg/kg i.v. bolus dose (solid line) (bottom). Dotted line is the estimated SC50 (19.56 ng/ml) for methylprednisolone effect on body weight.
Organ Weights.
Fig. 5 shows the time course of change in organ weights for the spleen, thymus, lungs, muscle, liver, kidney, and heart as well as the fittings of our model for the various tissues. The 7-day organ weights from our previous study (Ramakrishnan, 2001) were included. The organ weight ratios changed in a dose-related manner. The anabolic effects of the steroid on the liver tissue were observed as hypertrophy of the liver, whereas the lymphoid organs, muscle, and lungs were subject to the catabolic actions of the steroid. The heart and kidney weight ratios remained fairly constant with time in both treated groups. Table 1 lists the parameters estimated for the different organs. The IC50 varied from tissue to tissue, suggesting that the sensitivity of the various organs to steroid treatment is different. The muscle weights dropped linearly over the period of 7 days, which makes it difficult to obtain a reliable estimate ofS max from the data, as reflected by the abnormally high value estimated. Figure6 shows the area between the baseline and effect curve from 0 to 168 h (ABEC0–168 h), which is an indicator of the net cumulative response of the tissue to steroid treatment. The ABEC values for the thymus and spleen were the highest, whereas the lungs and muscle followed. The hypertrophy of the liver was comparable to the involution effect on the lungs. In general, the cumulative effect on all the tissues was concentration-dependent.

Effect of a 0.1- (●) and 0.3 (○)-mg/kg/h 7-day infusion on weight ratios of liver, lymphoid organs (spleen and thymus), lungs, gastronemius muscle, heart, and kidney. The solid and broken lines for the liver data are the simultaneous fittings for the low- and high-dose levels by using eq. 5 derived from indirect response model III (top right). The solid and broken lines for the spleen, thymus, lungs, and muscle are the simultaneous fittings for the low- and high-dose levels by using eq. 6 derived from indirect response model IV (top right). The solid and broken lines for the kidney and heart data connect the mean at the different time points for the low and high doses.
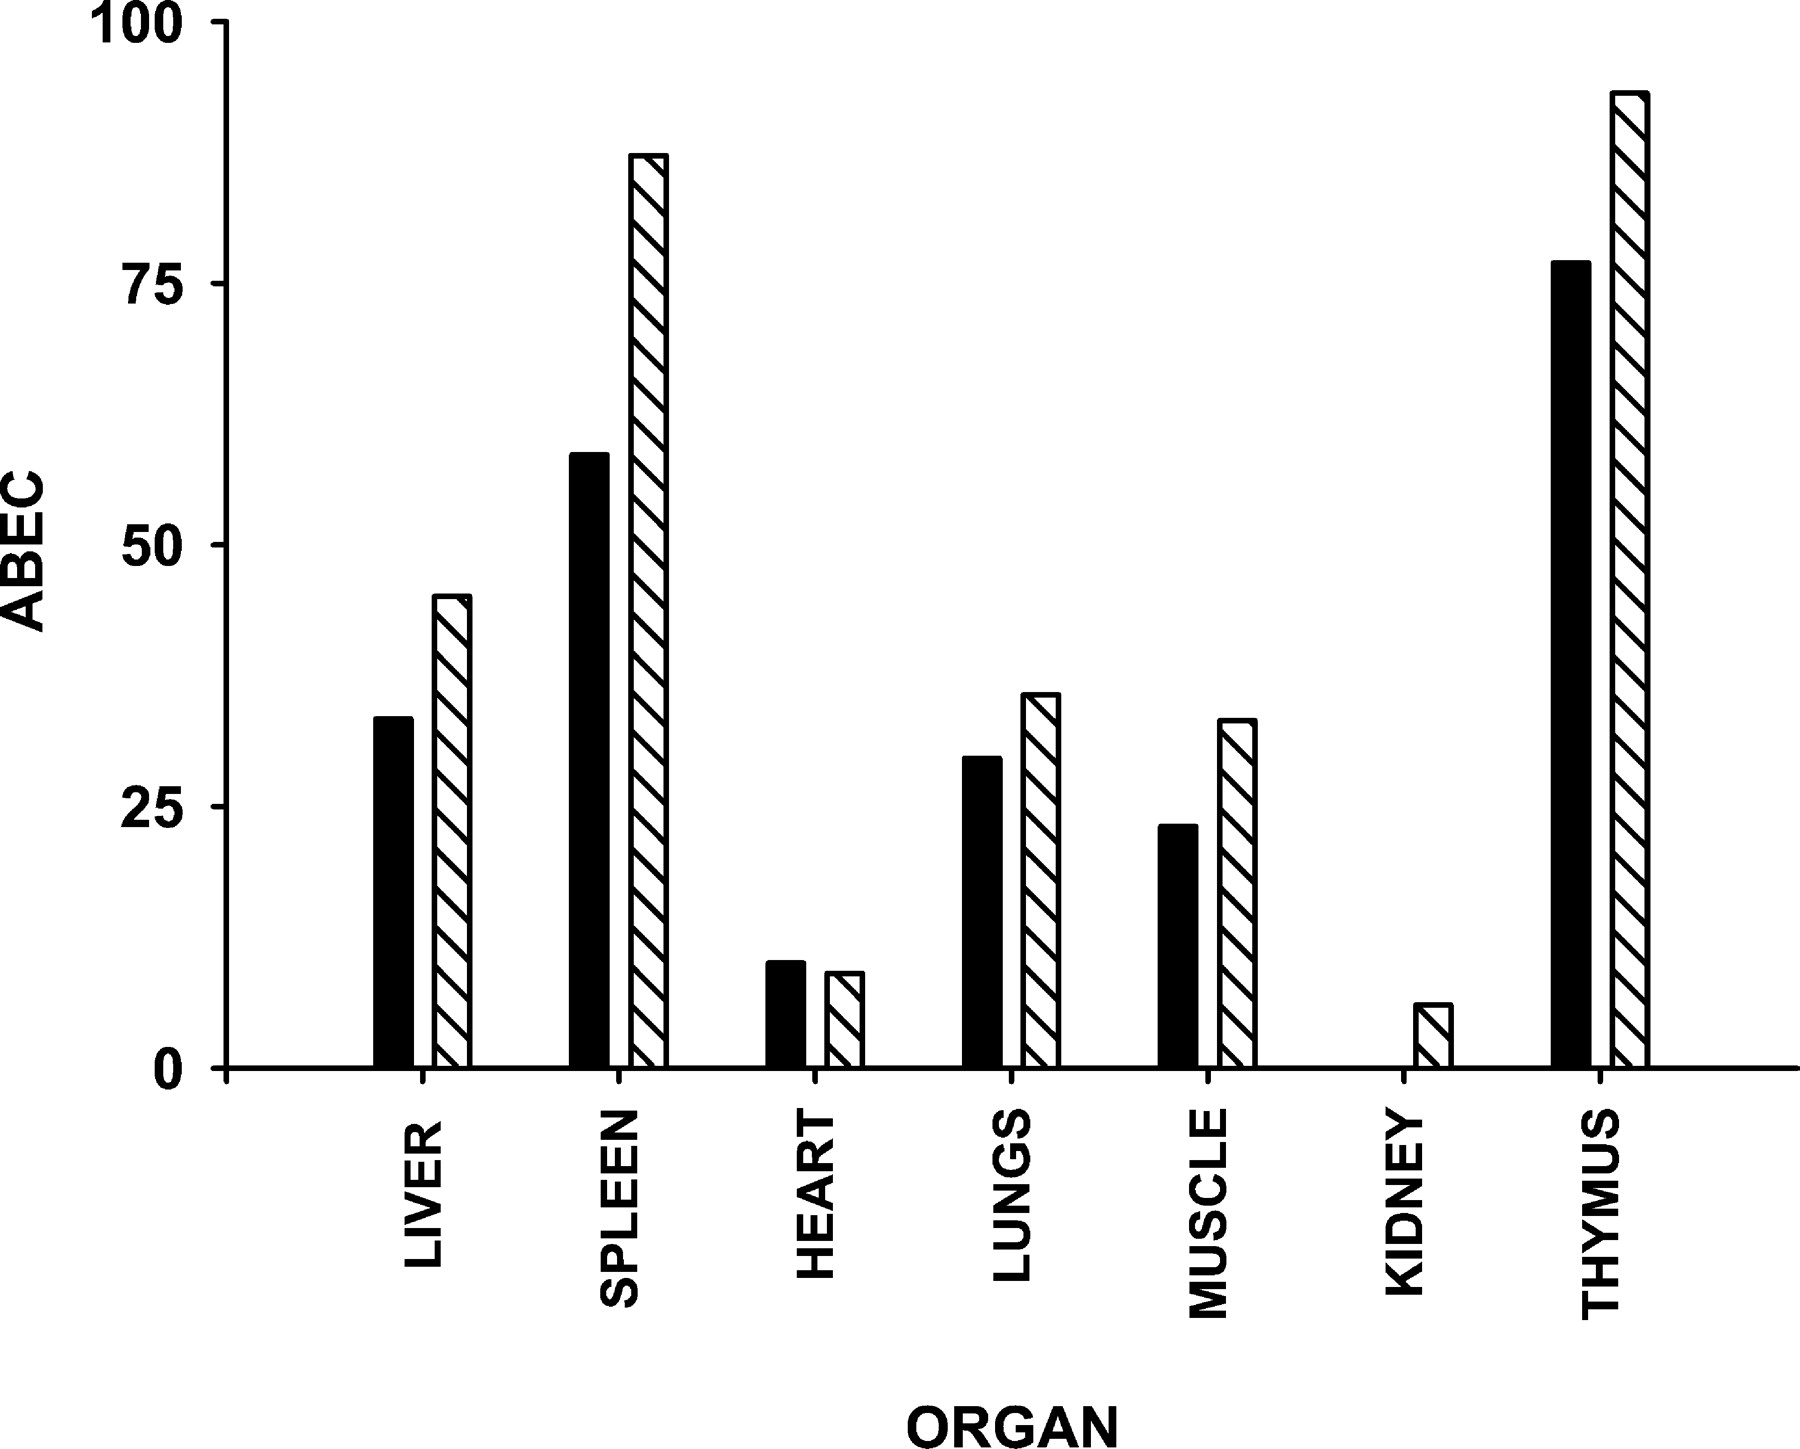
Plot of ABEC from 0 to 168 h for the different organs. Low dose (▪) and high dose (▧).
Gene-Mediated Enzyme Induction.
Typical phosphorimages of Northerns for the GCR mRNA and TAT mRNA are provided in Fig.7. The receptor mRNA, free receptor density, TAT mRNA, and TAT activity data at 5 and 6 h after a 50-mg/kg i.v. bolus dose are shown in Fig.8. Simulations using the fifth-generation model and its parameters could satisfactorily describe the data patterns for this group of rats. Hence, these parameters were used to perform simulations for receptor and TAT dynamics during the two infusion regimens of 0.1 and 0.3 mg/kg/h (Fig.9). The half-life of methylprednisolone is very short (∼30 min), which results in steady-state concentrations being achieved within few hours. However, the simulations show that it takes up to 24 h for the steady state in dynamic measures to be attained. The receptor mRNA profiles fall early and reach steady-state levels that are 50 to 55% of control values. Free receptor levels dose dependently fall to a new steady state within 1 day. An early rise followed by a dramatic decrease stabilizing at values close to that of controls reflect the remarkable tolerance in the TAT mRNA and TAT profiles. Differences among the two doses are prominent early on but they vanish at steady state due to occurrence of down-regulation/tolerance. The simulations indicate that responses governed by receptor/gene-mediated events may show tolerance upon long-term continuous dosing of steroid due to receptor down-regulation. Figure 10 shows the receptor and TAT results from our infusion study. The 7-day receptor and TAT levels from our previous steady-state study (Ramakrishnan, 2001) were included in the figures. There was a drop in the receptor mRNA levels indicating down-regulation in the message expression. The cytosolic free receptor density fell as a result of receptor binding and nuclear translocation as well as down-regulation to reach dose-related steady-state levels within 24 h. The TAT message levels rose to a maximum at 6 h after which the levels fell to values close to that of the control. The TAT mRNA for the lower dosing group was variable and stayed close to control values throughout the infusion duration. Maximum TAT activity was observed by 10 h followed by a steep drop close to control levels at 24 h for both the treatment groups. Thus, severe tolerance was observed at steady state that was maintained for the entire 7-day infusion duration. The rise and fall in TAT activity as well as its message levels were dose-dependent during the early time frame but the differences almost disappeared when steady state was attained at 24 h. The temporal data patterns observed seemed to be well predicted by our model. The higher dose was associated with a greater decrease in free receptor levels corresponding to a greater extent of TAT induction. Table 2 includes the parameters obtained from the simultaneous fitting of the indirect response model (eq. 15) to the liver weight ratios for the two infusion groups. The fitted curves were comparable to those obtained using the indirect response modeling approach (Fig. 5). Simulations for the receptor/gene-mediated effects accounting for this change in liver weights were superimposed on the observed data to quantitatively compare the model predicted and experimentally observed results. The excellent agreement between the time course of observed and predicted receptor dynamics indicates that the model parameters based on acute dosing could well account for the rate and extent of changes in receptor mRNA and free receptor levels during infusion. The predicted TAT mRNA curves consistently overpredicted the observed change in the levels up to 24 h. On the other hand, the early rise in TAT activity was severely underpredicted by the model. Although our model predicted tolerance in TAT activity, the extent of tolerance in the observed data was far greater than that expected based on extrapolations from single dosing. The results point to the possibility that there is a dissociation between receptor and TAT dynamics during long-term corticosteroid dosing.

Top, representative phosphorimage of quantitative Northern analysis for GCR mRNA. The seven lanes on the left represent GCR cRNA standards. The 18 lanes on the right represent six liver total RNA samples run in triplicate. Bottom, representative phosphorimage of quantitative Northern analysis for TAT mRNA. The top signals represent hybridization to the TAT probe, and the bottom signals represent hybridization to GRG external standard cRNA, which is added to the tissue for yield correction. The seven lanes on the left represent cRNA standards; the 18 lanes on the right represent six liver total RNA samples run in triplicate.

Time course of receptor mRNA (top left), free cytosolic receptor density (bottom left), TAT mRNA (top right), and TAT activity (bottom right) after a single 50-mg/kg i.v. bolus dose of methylprednisolone in male ADX Wistar rats. Solid circles are experimental data from individual rats at 5 and 6 h after injection and solid lines are simulations with the fifth-generation model (eqs. 7-13). The parameters used include those for acute steroid effects as listed in Table 2.

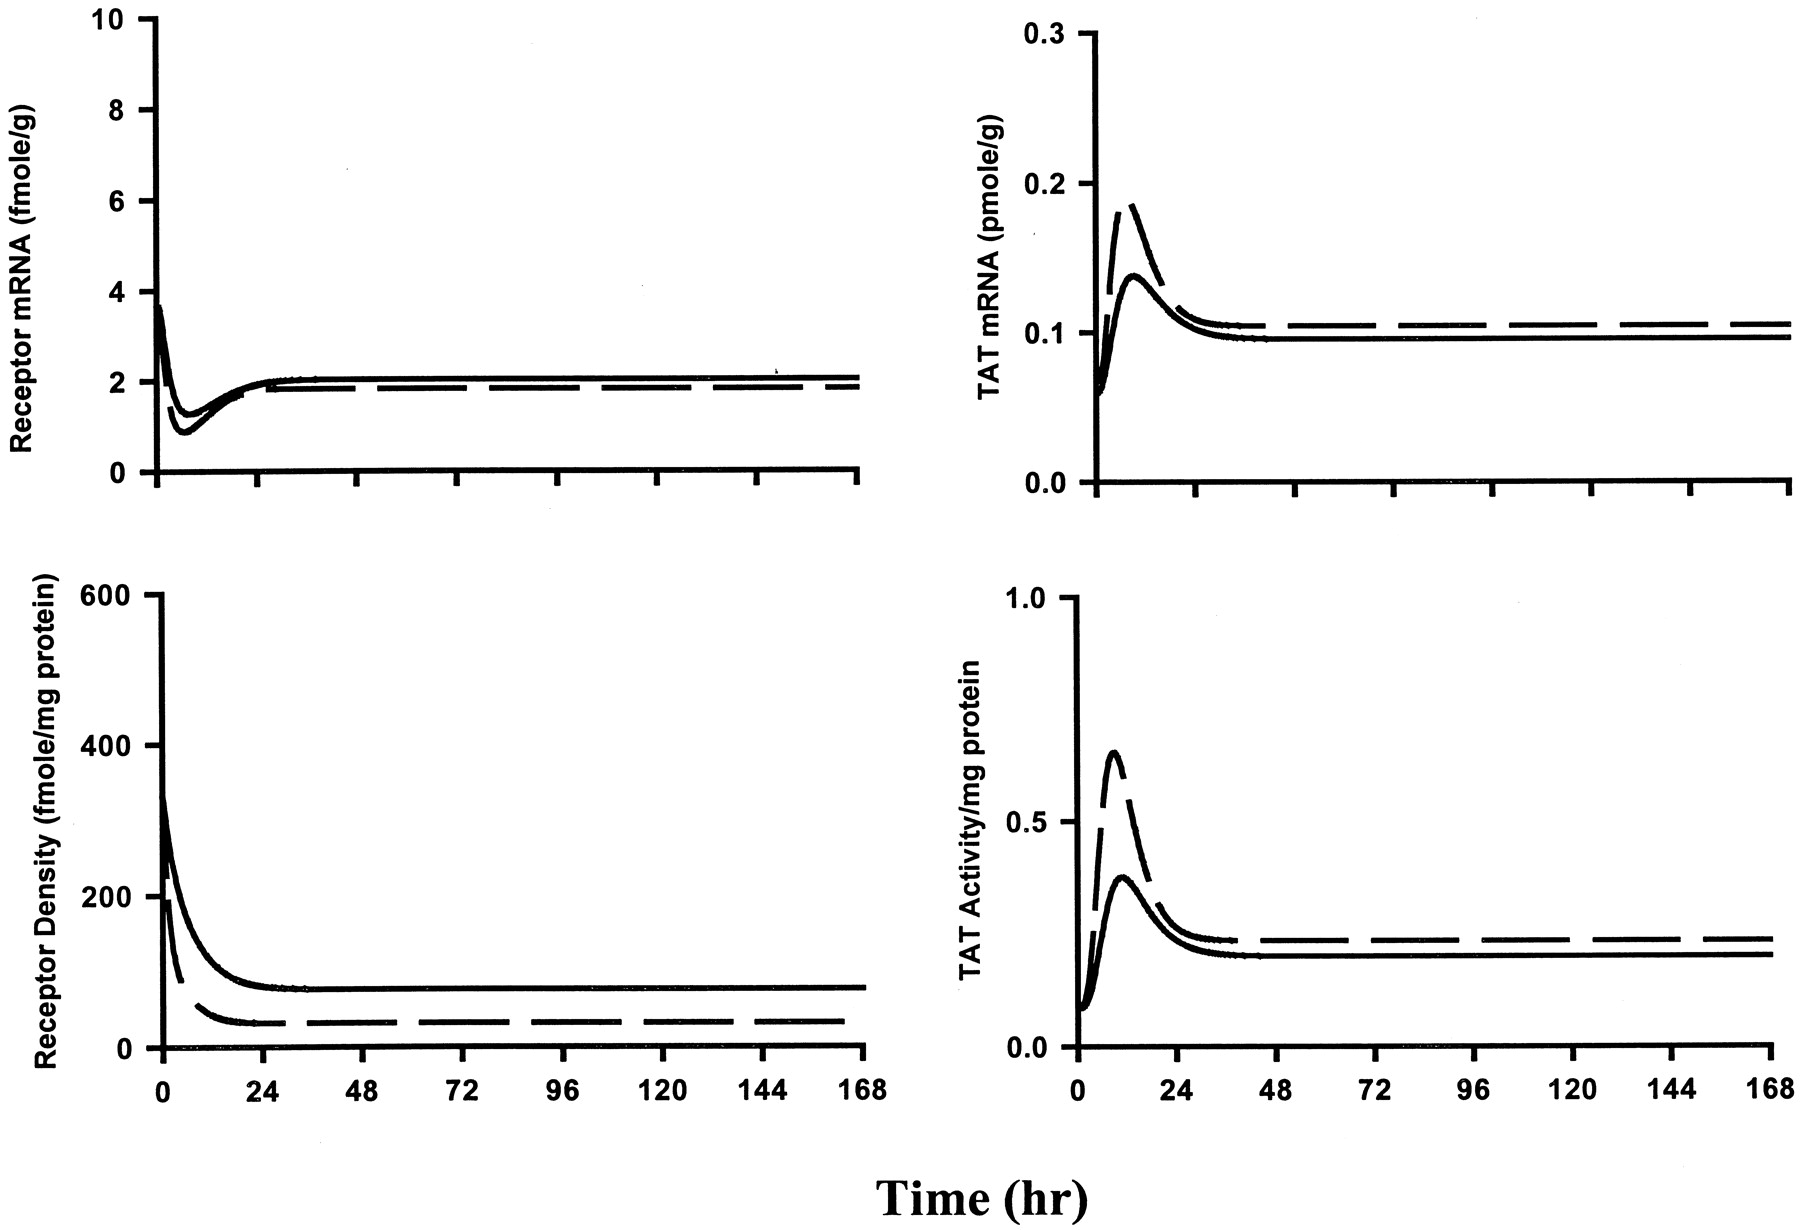
Simulations using the fifth-generation model (eqs.7-14) for the time course of receptor mRNA (top left), free cytosolic receptor density (bottom left), TAT mRNA (top right), and TAT activity (bottom right) during 0.1- (solid line) and 0.3 (dashed line)-mg/kg/h 7-day infusions of methylprednisolone in male ADX Wistar rats. The parameters used include those for acute steroid effects as listed in Table 1.

Time course of receptor mRNA (top left), free cytosolic receptor density (bottom left), TAT mRNA (top right) and TAT activity (bottom right) upon 0.1- (●) and 0.3 (○)-mg/kg/h 7-day infusions of methylprednisolone in male ADX Wistar rats. The solid and broken lines are the simulations using the fifth-generation model taking into account the effects on liver weights for the low and high doses (eqs. 7-14). The parameters used include those for acute steroid effects as listed in Table 2.
Table 2 lists the parameters for the TAT dynamics specific to our long-term infusion study and Fig. 11shows the fitting of the model to the data. A comparison of the parameters indicated that there was more than a 50% change in theS, γ, andk deg t parameters. This suggests that the efficiency of TAT gene induction had been reduced during long-term dosing. Also, an amplification of the efficiency of translation of TAT mRNA to TAT as well as an increase in the half-life of the TAT protein might have contributed to the differential effect on induction of TAT activity.

Time course of TAT mRNA (top) and TAT activity (bottom) upon 0.1- (●) and 0.3 (○)-mg/kg/h 7-day infusions of methylprednisolone in male ADX Wistar rats. Symbols are the mean data and errors are the standard deviations. The solid and broken lines are the fittings using the fifth-generation model for the low and high doses (eqs. 11-13). The receptor dynamics and liver weight ratios were fixed as listed in Table 2. The estimated parameters for long-term TAT dynamics are also indicated in Table 2.
There is considerable evidence in the literature that changes in cAMP can alter the extent of TAT gene expression (Wicks, 1968; Hashimoto et al., 1984). We measured cAMP in rat liver to determine whether there was any fall in cAMP levels that could have contributed to a reduction in the efficiency of TAT gene expression. As seen in Fig.12, there was no change in cAMP levels in the rats administered the i.v. bolus, but levels were in fact 3- to 6-fold higher than control values between 18 and 72 h for the infusion groups. However, at early times up to 18 h, the levels remained close to control, which suggests that cAMP action cannot explain the discrepancy in the receptor and TAT dynamics during long-term dosing.

Left, time course of cAMP concentrations in hepatic rat cytosol upon 0.1- (●) and 0.3 (○)-mg/kg/h infusions of methylprednisolone. Solid circles are the mean data and bars are the standard deviations. The solid and broken lines connect the means. Right, cAMP concentrations in the controls and the animals administered the 50-mg/kg i.v. bolus dose, which were sacrificed at 5 and 6 h.
Lymphocyte Trafficking.
As shown in Fig.13, within 6 h, the lymphocyte counts had plummeted to a minimum in all treatment groups. The percentage of predose lymphocyte counts dropped in a dose-dependent manner to mean steady-state values of 19 and 13%. Due to unavailability of early time points governing the down-curve, we did not have the power to estimate k out, which is a physiological drug-independent parameter. Therefore, its value was fixed based on a literature reported value of 0.643 h−1 from a study done in adrenalectomized rats that were administered a single i.v. bolus of prednisolone (Ferron et al., 1999). The IC50 estimated was 6.15 ng/ml. Surprisingly, the control group animals showed a mean 20% drop in blood lymphocyte counts, including the first measured time point itself. These animals being adrenalectomized, do not have any steroid in circulation, and hence should be expected to have a constant baseline blood lymphocyte count. However, it is possible that pump implantation might have caused some tissue trauma associated with a local inflammatory reaction, causing a change in the baseline lymphocyte counts.

Cell trafficking model for redistribution of lymphocytes between the blood and lymphoid organs (top) and the time course of predose normalized blood lymphocyte count for the controls (▪), the 0.1- (●) and 0.3 (○)-mg/kg/h infusion groups (bottom). The k in and k outare the zero- and first order rates of transfer of lymphocytes to and from the blood compartment, The solid rectangle indicates inhibition of lymphocyte egress from the tissue and is defined by the inhibition function indicated in eq. 16. The solid and broken lines are simultaneous fittings for the low- and high-dose groups by using eq. 16, whereas the dotted line represents the mean counts (80%) in the control group.
Discussion
The 7-day infusion of MPL caused pronounced losses in body weights of rats, which does not occur in acute dosing studies (Sun et al., 1998b). This dose and duration-dependent differential effect was well captured by our model. The IC50 andS max for the catabolic effects on the various organs varied substantially, indicating that these tissues show different sensitivities and capacity to respond to steroid treatment. Assuming that all the tissues studied were well perfused, the dissociation constant for the drug-receptor binding and the free receptor density, as controlled by recycling fraction and receptor mRNA autoregulation would limit the overall response of a tissue to steroid treatment. Tissue-specific regulation of glucocorticoid receptor mRNA levels has been reported in normal, adrenalectomized as well as steroid-treated rats (Kalinyak et al., 1987; Miller et al., 1998). TheK d for dexamethasone-receptor binding has been reported to be significantly higher in the spleen and thymus of adrenalectomized rats compared with the lung or liver (Ichii, 1981). We obtained higher IC50 values for the spleen and thymus suggesting that drug-receptor binding may reflect the sensitivity of these tissues to steroids. In adrenalectomized as well as normal rats, the thymus has been reported to have the highest concentration of cytosolic glucocorticoid receptor followed by the liver, spleen, and lung (Ichii, 1981; Miller et al., 1998). Except for the spleen whose S max was higher than that for the liver, our results are consistent with this order, indicating that the S max estimated is a measure of the overall receptor density in these tissues. Furthermore, the ABEC0–168 h values further confirm the observation that the net steroid effect on any organ would be proportional to the free receptor density.
Because our fifth-generation model covers the complete time course of receptor and enzyme induction events, it provided us with the opportunity to perform simulations for prediction of expected results during long-term treatment. The parameters from the single-dosing studies could satisfactorily predict the temporal patterns of receptor mRNA and receptor dynamics, suggesting that receptor regulation is not altered upon long-term dosing. However, we noted a marked disagreement between the model-predicted and observed TAT dynamics in our study. The remarkable pathophysiological effects of 7-day steroid treatment on these animals leads us to postulate that other hormones might come into play under these conditions, thus opposing or enhancing the steroid effects on enzyme induction. Hyperglycemia could be expected to cause elevated plasma insulin levels. The global effects of the steroid could lead to alterations in liver cAMP levels via changes in glucagon secretion.
It is known that hormones, including insulin, glucagon, and glucocorticoids control TAT activity (Holten and Kenney, 1967; Ernest and Feigelson, 1979). Genes that encode gluconeogenic enzymes such as phosphoenolpyruvate carboxykinase and TAT are transcriptionally up-regulated by glucocorticoids as well as by glucagon via cyclic AMP (Yeung and Oliver, 1968; Scherer et al., 1982; Hashimoto et al., 1984). Unlike glucocorticoids that bind to a cytosolic receptor and directly enhance gene transcription, glucagon binds to cell surface receptors and activates a second messenger system (cAMP), leading to phosphorylation and activation of a variety of transcription factors up-regulating TAT activity (Schmid et al., 1987). The cAMP levels in the hepatic cytosol remained close to control and hence cannot explain the lack of expected induction in TAT mRNA seen between 10 and 24 h. Moreover, our cAMP data would lead us to expect higher than predicted TAT mRNA levels between 24 and 48 h. On the contrary, we found that message levels were lower implying that the expected cAMP-mediated TAT gene induction at these times is opposed by other factors. Studies in a rat hepatoma cell line have implicated interactions with specific target sequences in the cAMP response element and hepatic nuclear factor-4 binding sites adjacent to the GRE in mediating the glucocorticoid/insulin and cAMP/insulin antagonism of TAT gene expression (Ganss et al., 1994). It has also been shown that insulin alone induces TAT mRNA and TAT activity (Reel et al., 1970; Spencer et al., 1978), but in the presence of glucocorticoids, insulin acts at a post-transcriptional level only increasing TAT activity (Crettaz et al., 1988). We propose that gluconeogenesis stimulated by methylprednisolone in the treated rats might have led to elevated plasma glucose levels, stimulating the release of insulin by 10 h. This could have repressed the TAT gene expression and further antagonized the cAMP-mediated gene expression as well. Studies using hepatoma cells suggest that whereas steroids enhance gene transcription, insulin acts on a post-transcriptional or translational step by increasing the rate at which existing TAT mRNA is translated to TAT (Kenney et al., 1970) as well as impairing the degradation rate of the enzyme (Crettaz et al., 1988). Our modeling results suggest that both a change in the message translation rate as well as a decrease in the enzyme degradation rate may have contributed to the amplification of TAT activity upon long-term continuous dosing, which further supports the role of insulin.
We incorporated the effects of tissue organ weights on the measured molecular markers into our model. Because the liver weight changes in response to long-term steroid treatment, traditional normalization of the receptor/TAT mRNA levels on a per gram liver tissue basis would lead to a net dilution effect, resulting in an underestimation of the true increases in these measures. Simultaneous modeling of the liver weight and delayed gene-mediated effect data allowed us to relate the anabolic effects on the liver tissue to those at a molecular level. The steroid-receptor complex DR(N) in the nucleus can mediate the induction of a variety of metabolic genes (TAT being one of them), leading to altered expression of enzymes. This would contribute to the liver hypertrophy via a net increased synthesis of glucose, RNA, and proteins as well as fat deposition (Baxter and Forsham, 1972). It was not attempted to directly correlate the rise in TAT to increase in liver weight because TAT is only one of the numerous genes induced by steroids and might not be the rate-limiting factor causing liver hypertrophy.
The rapid immunosuppressive effects of various steroids on blood lymphocyte counts upon single IV bolus dosing in animals (Ferron and Jusko, 1998; Ferron et al., 1999) as well as humans (Fisher et al., 1992; Chow et al., 1999) has been described earlier. The loss in blood lymphocyte counts upon long-term dosing could be adequately described using the cell trafficking model in our study.
Several studies by us and other investigators have demonstrated that the rate and extent of receptor depletion correlates with the biological response upon acute dosing in adrenalectomized rats. However, an understanding of the in vivo receptor regulation and biological response upon long-term steroid dosing is limited. Repeated stress has been shown to be associated with decrease in cytosolic receptor numbers in liver (Alexandrova and Farkas, 1992) and brain (Sapolsky et al., 1984) of intact rats. However, stress is a complex and nonspecific stimulus and receptor down-regulation cannot be definitively attributed to being glucocorticoid-induced. Yoshida et al. (1986) reported that receptor function is not distorted upon chronic steroid treatment in adrenalectomized rats. The authors also proposed that the correlation between receptor loss and TAT induction disappears upon long-term dosing. Our studies and quantitative analysis extend their results in that we found that long-term continuous steroid treatment does not cause alterations in receptor mRNA autoregulation as well as receptor dynamics and nuclear molecular events (receptor binding, translocation, chromatin binding).
Steroid kinetics coupled with receptor mRNA autoregulation seem to be the primary factors governing the time course of free receptor levels during both acute and long-term dosing. Furthermore, our results suggest that postreceptor events might have contributed to a decoupling between receptor dynamics and gene induction during long-term dosing. Although the early TAT response was exaggerated, continuous steroid treatment was associated with the development of tolerance due to receptor down-regulation. In line with our findings, down-regulation of cytoplasmic receptors has been proposed to be one possible mechanism for the development of hormonal resistance during chronic therapy. Our results suggest that the extent of tolerance in the biological effects, however, may be countered by alterations in signal transduction processes by other hormones whose levels may change as a result of the global steroid effects during continuous dosing.
These studies assess corticosteroid kinetics and dynamics on the molecular, tissue, whole body, and mathematical modeling levels, and thus provide a physiological integrated examination of how multiple factors interact to control the in vivo responses to an important type of therapeutic agent. This also allows evaluation of the relevance of related measurements carried out in isolated systems such as cell culture. The 7-day infusion of methylprednisolone in adrenalectomized rats provides organ responses that mimic adverse effects during chronic dosing in humans; thus, this may be a highly useful model system to further address methods of avoiding or ameliorating such effects in therapeutic situations. As the integration of gene microarray technology allows a more comprehensive examination of multiple gene changes, the present mRNA patterns indicate that such measurements will require interpretation in view of dose, duration, pharmacokinetic, pharmacodynamic, and toxicity variables controlling receptor/gene-mediated drug effects.
Footnotes
-
This study was supported by Grant GM24211 from the National Institutes of Health.
Abbreviations
- TAT
- tyrosine aminotransferase
- GRE
- glucocorticoid response element
- MPL
- methylprednisolone
- CL
- clearance
- ABEC
- area between the baseline and effect curve
- GCR
- glucocorticoid receptor
- Received June 14, 2001.
- Accepted August 24, 2001.
- The American Society for Pharmacology and Experimental Therapeutics


