


Abstract
Two drugs that produce overtly similar effects will sometimes produce exaggerated or diminished effects when used concurrently. A quantitative assessment is necessary to distinguish these cases from simply additive action. This distinction is based on the classic pharmacologic definition of additivity that, briefly stated, means that each constituent contributes to the effect in accord with its own potency. Accordingly, the relative potency of the agents, not necessarily constant at all effect levels, allows a calculation using dose pairs to determine the equivalent of either agent and the effect by using the equivalent in the dose-response relation of the reference compound. The calculation is aided by a popular graph (isobologram) that provides a visual assessment of the interaction but also requires independent statistical analysis. The latter can be accomplished from calculations that use the total dose in a fixed-ratio combination along with the calculated additive total dose for the same effect. Different methods may be used, and each is applicable to experiments in which a single drug is given at two different sites. When departures from additivity are found, whether in “two-drug” or “two-site” experiments, the information is useful in designing new experiments for illuminating mechanisms. Several examples, mainly from analgesic drug studies, illustrate this application. Even when a single drug (or site) is used, its introduction places it in potential contact with a myriad of chemicals already in the system, a fact that underscores the importance of this topic in other areas of biological investigation.
When two drugs that produce overtly similar effects are present together, certain questions arise: How does a particular effect of the combination compare with the effects of the individual constituents when given at the same doses? What is the expected effect of the combination, and how is that expected effect calculated? Is the observed effect of the combination significantly greater (or less) than the expected effect? Even if one is not administering two drugs together, it is clear that giving even a single drug places it in potential contact with a myriad of other chemicals already present in the system. Hence, a quantitative knowledge of drug combination pharmacology is important—in clinical settings and in all experiments aimed at studying mechanism.
Independent Similar Action
Our main concern is with combinations of two or more agonists that produce a common effect through mechanisms that are not obviously related to a single common receptor, i.e., situations in which the presence of one does not affect the receptor binding of the other. This kind of agonist joint action was termed “similar and independent” by Bliss (1939). The model of joint action, therefore, is derived only from the potency and efficacy information contained in each drug's dose-effect data. An important first question is, do the two drugs produce an effect whose magnitude is consistent with the individual dose-effect relations for that effect, or is the combination effect exaggerated? This seemingly simple question does not always have an equally simple answer. Interestingly, this topic has not received much attention in most major textbooks of pharmacology—even in monographs that devote considerable discussions to theory and quantitation.
Additivity
In some cases, predicting the effect level of a combination of doses is straightforward. An example is that in which each drug is equally efficacious and the pair has a relative potency that is not significantly different at each effect level. In this case, each dose pair of the combination can be calculated as an equivalent of either constituent from knowledge of the relative potency. If the individual drugs are denoted A and B and the relative potency, assumed constant, is R (=dose A/dose B), then a combination (a,b) is equivalent to a dose of A given by a + Rb. This equivalent then leads to a determination of the effect from the dose-effect relation of drug A. If drug B is the reference drug, then the combination is equivalent to a/R + b, and that quantity is used in drug B's dose-effect relation. Much of the classic literature dealing with drug combinations is restricted to analyses in which the individual log dose-effect data are legitimately constrained by regression procedures that yield parallel lines (Finney, 1942, 1971). This constraint, when applicable, means that the relative potency is constant and, thus, the calculation described above gives the expected effect. Whether the relative potency is constant or not, the calculation of an equivalent dose that is based on the relative potency provides an equivalent dose that is termed “additive”, and the corresponding effect that follows from this calculation is termed an “additive effect”. Thus, additivity means that one drug (the less potent one) is acting as though it is merely a diluted form of the other. Alternatively, one may say that the more potent drug acts like a more concentrated form of the other.
Isbologram
In situations in which two agonist drugs have a varying relative potency, i.e., R varies with the level of the effect, the simple calculation described above is not applicable. Getting the additive effect in this case involves a more complicated computation that uses the individual dose-response data and the definition of additivity (Tallarida, 2000). When obtaining that effect is not the goal and it is desired only to assess whether a combination dose is additive, then simple graphical methods may be used. A commonly used method uses the isobologram, a graph of equally effective dose pairs (isoboles) for a single effect level. Specifically, a particular effect level is selected, such as 50% of the maximum, and doses of drug A and drug B (each alone) that give this effect are plotted as axial points in a Cartesian plot (Fig. 1) (the doses are denoted by italicized letters that correspond to the respective drugs). The straight line connecting A and B is the locus of points (dose pairs) that will produce this effect in a simply additive combination. This line of additivity allows a comparison with the actual dose pair that produces this effect level experimentally. It is notable that some dose combinations may be subadditive while others are either superadditive or additive (Fig. 1).

Isobologram (illustration) for some particular effect (e.g., 50% of the maximum) in which the dose of drug A alone isA = 20 and drug B alone is B = 100. The straight line connecting these intercept points (additivity line) is the locus of all dose pairs that, based on these potencies, should give the same effect. An actual dose pair such as point Q attains this effect with lesser quantities and is superadditive (synergistic), while the dose pair denoted by point R means greater quantities are required and is therefore subadditive. A point such as P that appears below the line would probably be simply additive. A suitable statistical analysis is required to demonstrate the nature of the interaction.
The isobologram was introduced by Loewe (1953, 1957) but seems to have attracted little attention until it was used in a study of the combination of ethyl alcohol and chloral hydrate (Gessner and Cabana, 1970). That study demonstrated that among combinations tested in different fixed ratios, some were additive, some were subadditive, and others were superadditive. Although useful for its visual display, the isobologram does not obviously allow a statistical distinction. The errors inherent in the dose-effect data mean that terms like “above” the line and “below” the line, based on the plot, lack the precision needed in such distinctions. For example, a group of experiments with different fixed-ratio mixtures may present data in which some points appear below the line of additivity while others are close to it or above it (Fig. 2A). This finding suggests that some fixed-ratio combinations, those whose points are below the additive line, are superadditive. This suggestion could be tested with a regression analysis, but that would require a different kind of plot—one in which the independent variable is controlled. That can be achieved by plotting the total dose (for the specified effect) against the fraction (fA ) of drug A's potency (A) in each combination (Fig. 2B). This approach permits a regression analysis on the subset of points that appear to be below the line of additivity and, thus, provides a way to determine the character of this subset in relation to additivity or nonadditivity (Tallarida, 2000). It also allows a way to express the total additive dose at any effect level for the fixed-ratio combination, calculated asfAA + (1 −fA )B, from which a variance is also readily determined. These determinations therefore permit a statistical analysis of the difference between the total additive dose and the total dose actually obtained from experiment. For a particular proportion (or fraction fA ), this can be accomplished by getting the total dose (Zt ) for the specified effect, along with its variance, from a standard regression analysis of the data. Then Zt and the total additive dose (calculated as above) may be tested for a significant difference in a procedure by using the Student tdistribution (Tallarida, 2000). The isobologram, when accompanied by this kind of statistical analysis, is the method most clearly tied to the classical definition of additivity. It has been described as the “gold standard” for drug interactions (Gebhart, 1992a,b) and has been previously discussed with mathematical details (Tallarida et al., 1989; Tallarida, 1992).

Top, isobologram (not related to Fig. 1) illustrates several different dose combinations that attain the specified effect level. A group of these combinations (X) that contains points below the line of additivity can be examined for synergism by replotting the data as shown in the lower plot. The bottom graph plots the same data (arrow shows the same data point) as the total dose (Zt ) in the combination plotted against the quantity (f) that represents the fraction of drug A's potency (e.g., if f = 1/2 then proportions are 1/2A and 1/2 B). This alternate way of expressing the mixture proportions permits a statistical analysis with regression techniques. A similar analysis for subadditivity can be made on the group denoted by Y that contains points that appear above the line. [From Tallarida (2000) with permission of Chapman-Hall/CRC Press].
The Additive Composite Curve
The isobologram uses sets of equally effective dose combinations for a single specific effect and is therefore limited in application to that one effect level. In contrast, a generalization of isobolar analysis that examines drug combinations over the range of effects provides more complete information that is especially useful if the relative potency varies appreciably. In this more recent approach (Tallarida et al., 1997; Tallarida, 2000) the individual dose-response data (curves) are used to construct the curve for a fixed-ratio combination in which the proportion of the total dose that is drug A is kept at pA and the proportion of the total dose that is drug B is kept at pB (pA + pB = 1). The idea is based on the classical definition of additivity and, thus, uses the relative potency values over the range of effects common to the two compounds (see Fig. 3). An experiment with this proportion produces an actual total dose-effect relation that may then be statistically compared with this composite additive curve in an analysis of variance procedure on the log dose-effect data.
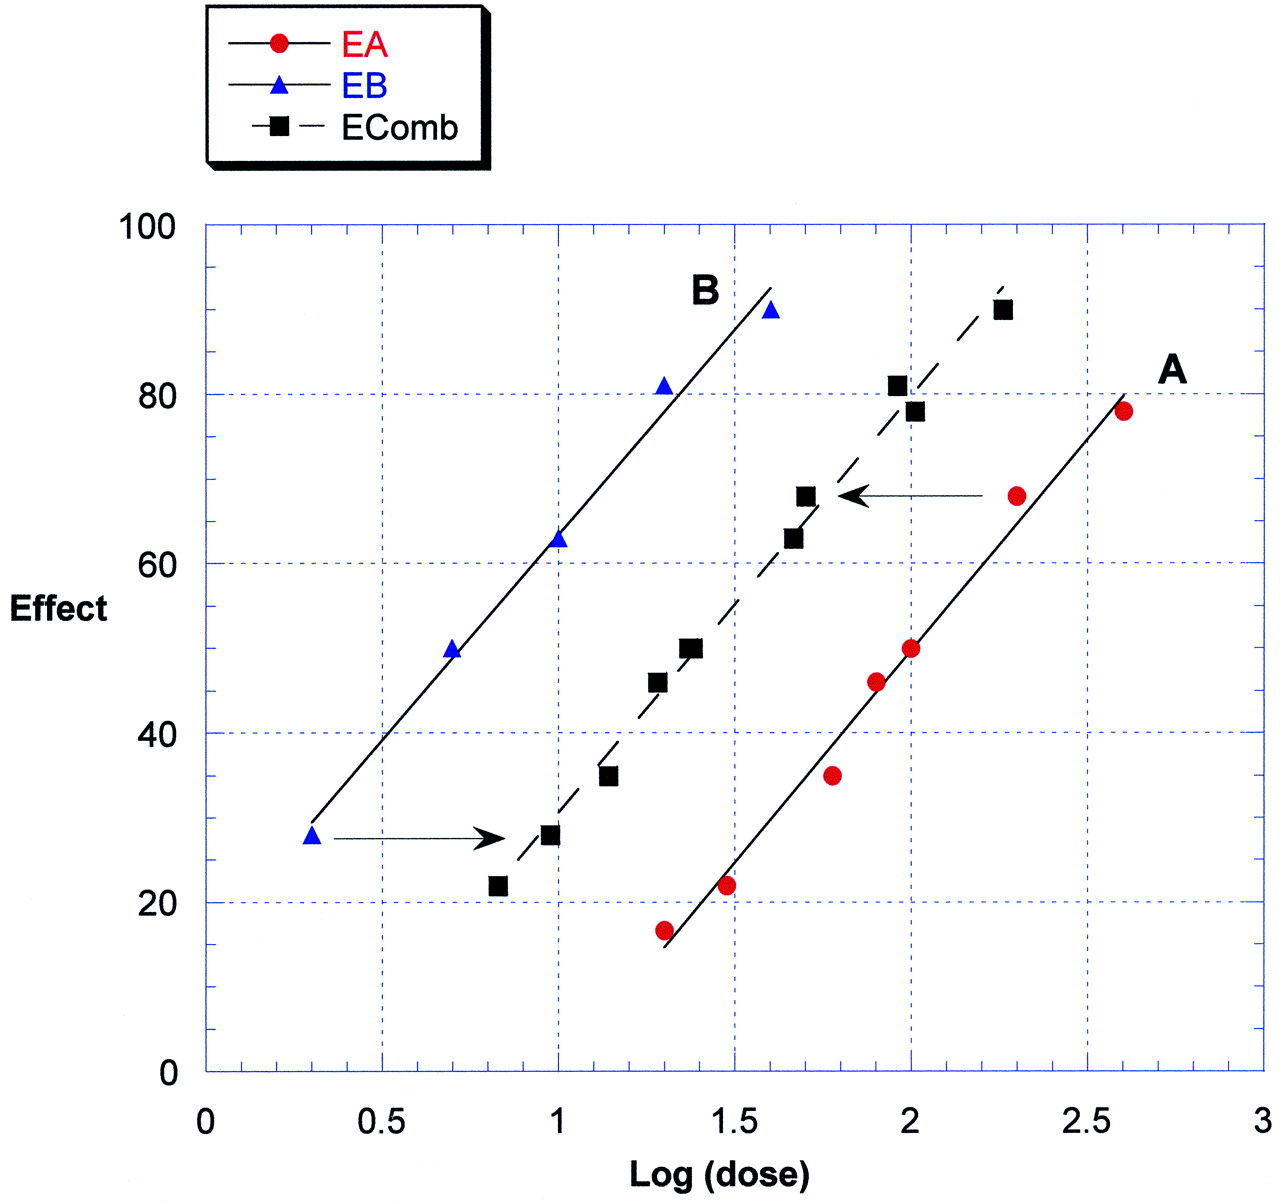
Regressions of effect [EA (●) andEB (▴)] on log dose for two drugs, A and B, respectively, with different potency illustrating the use of these in constructing a composite line of additivity that has the log of the total dose on the abscissa. A data point from the lower potency drug (A), when in a fixed-ratio combination with drug B, has a (calculated) lesser total in the combination [effectEcomb (▪)] because of the presence of the higher potency drug as indicated by the leftward shift. For the same reason, the doses of the higher potency drug are shown as a rightward shift. The shifted data produce the composite additive set that can be statistically compared with the experimentally derived data for a combination having the same dose proportions used in the calculation. Note: the broken line is derived (for each effect) as the logarithm of the total dose in an additive combination in which the constituent proportions are held fixed.
A special case is that in which one of the two drugs lacks efficacy for the effect that is studied, but is not a receptor antagonist. A situation of this kind was observed by Vaught and Takemori (1979), who reported that i.c.v. [Leu5]enkephalin did not produce antinociception over a range of doses given but, nevertheless, could still enhance the potency of morphine. Porreca et al. (1990)examined this finding quantitatively by administering [Leu5]enkephalin i.p. to mice that also received morphine by this same route. They used four different fixed-ratio combinations of the two agents and determined the potency as EC50 values in the hot water tail-flick test. For each combination tested, the total dose (for the 50% effect) was significantly less than the calculated total additive dose. For one combination, the total dose was approximately 1/4 of the additive. Thus, the interaction index was 1/4. The analysis of data for this situation in which one drug lacks efficacy is straightforward. The total combination dose does not have to be used in this case (although it can be, as noted above). One need only compare the active drug's dose-effect curve when it is present alone and when it is present in the combination. Since the zero-efficacy drug does not contribute to the effect when it acts alone, its presence in the fixed-ratio combination is like adding saline. Hence the additive dose-effect curve in this special case is the curve of the active ingredient alone. In general, comparing the additive curve with the combination's actual experimental curve allows an assessment of synergism, or subadditivity, depending on the relative position of the two curves. The interaction index, or ratio of combination potency to additive potency, indicates the magnitude and nature of the interaction. When this ratio is a number less than one, there is synergism (superadditivity); when it is greater than one, there is subadditivity. It is important to note that a potency value (such as EC50) is a value of dose or concentration for a specified effect (e.g., the 50% level). Hence, the interaction index, which is calculated from potency values, may differ with the effect level. A different, but related, kind of analysis of combined drug action is obtained from a three-dimensional view of combination action.
Response Surface Analysis
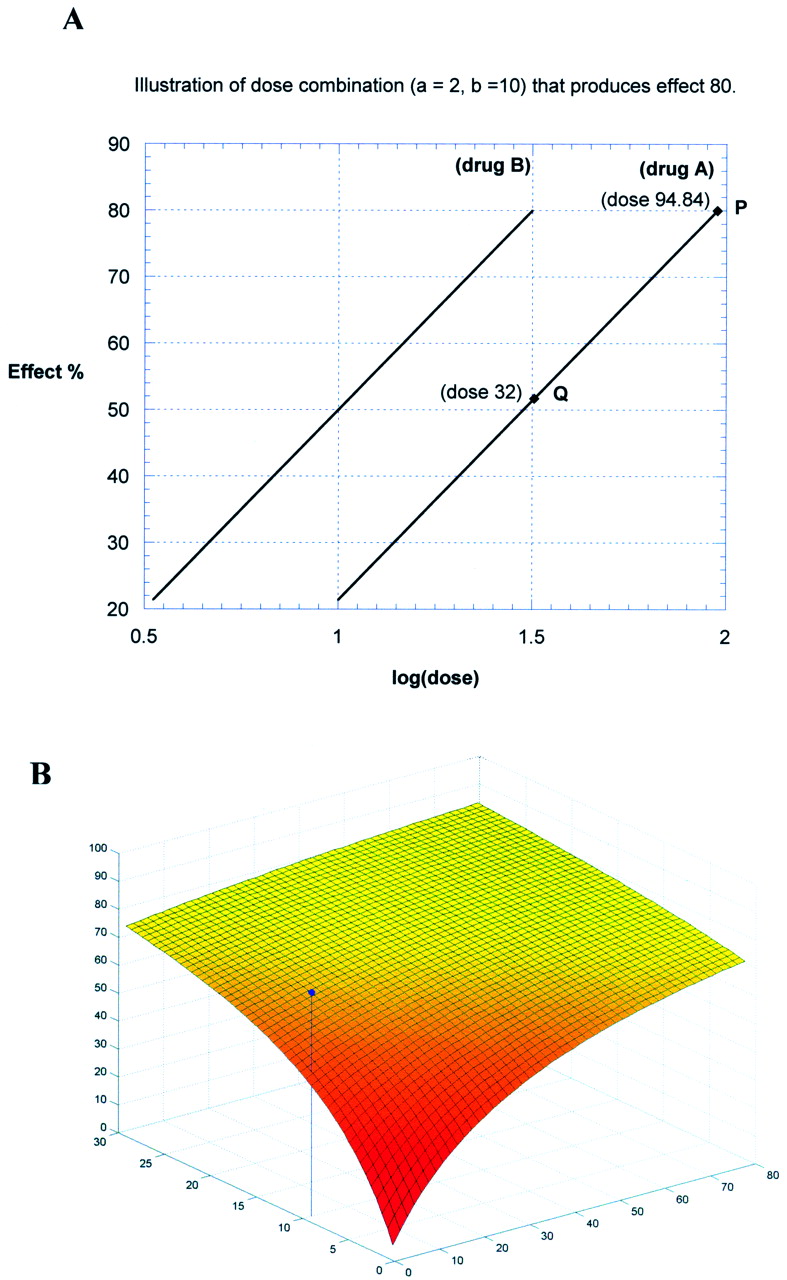
The doses of two drugs used in a combination experiment represent independent variables. An effect that results from the combination is the dependent variable. It is possible, therefore, to represent the relation for this combined action in a three-dimensional plot in which the doses are plotted as Cartesian coordinates in thex-y-plane, and the effect is plotted as the vertical distance above the planar point. The collection of spatial points plotted in this way provides a view that represents the combined dose-effect relation. Just as single dose-effect relations may not produce a smooth curve (or line) and, therefore, may require a model to construct some smooth curve for the data, this is also the case in a three-dimensional plot of a combination dose-effect relation. When the individual drug dose-effect points are appropriately fitted, the combined curve-fit can be used to construct a smooth surface representing the additivity of the combination. This additive surface becomes the reference surface for viewing actual combination effects. An experimentally determined effect of the combination that is significantly above this surface indicates a superadditive (synergistic) response, whereas an effect that is below means subadditivity. Construction of the additive surface can sometimes be mathematically complicated, but, in cases in which the individual dose-effect curves are the usual hyperbolas with the same maximum, the construction is straightforward. This is so because hyperbolas of this kind mean a constant potency ratio; that is, at every effect level, the ratio of dose A to dose B for the effect level is the same value =R and, thus, the log dose-effect curves are parallel. It follows that any dose pair (a, b) can be expressed as an equivalent of either drug; e.g., the total equivalent of this pair is a quantity of drug A equal to a + Rb. Therefore, substitution of a + Rb for dose A in drug A's dose-effect equation gives the additive effect. When all dose pairs are plotted this way, the additive surface results. In this case of constant R, an observed effect greater than the calculated additive effect (meaning synergism) would correspond to a greater dose of A given by (a + Rb)/α, where α (less than one) is the interaction index (see Fig.4).

A, illustration of a response surface calculation for two agonists A and B with constant relative potency R(=3 in this example). Equations: EA = 60x − 38.62 andEB = 60x − 10. Consider, for example, the dose pair, a = 2,b = 10, equivalent to 2 + 3 (10) = 32 of drug A. The expected (additive) effect = 51.69 (point Q). Instead, suppose that this combination gave the higher effect of 80, thus acting like a higher dose of 94.84 (point P). Then the interaction index α = 32/94.8 = 0.337, a value indicating synergism. B, the set of additive dose pairs, along with the calculated additive effect, produces a surface in a three-dimensional plot (as shown). A synergistic dose pair (as in this example) plots as a point above this surface. When R is not a constant, the calculation of α is more complicated (see Tallarida, 2000).
This kind of analysis was used in experiments with morphine and clonidine in mice that received intrathecal doses and were subsequently tested for antinociception in the hot water tail-flick test (Tallarida et al., 1999). Data for the dose combinations (each in a fixed ratio of the constituents) revealed effects that were well above the additive surface. These values allowed an assessment of the interaction index for each combination. Each showed significant synergism for this drug pair and also showed that the degree of synergism, measured as the interaction index, was dependent on the drug ratio of the combination. This kind of analysis, although entailing additional computation, provides a more comprehensive picture of the drug interaction than that obtained from the typical isobolar analysis that is tied to a particular effect level. It can also be used for a single dose pair. The findings from this study (and many others) also underscore the fact that synergism is not merely a property of a drug combination. It also depends on the ratio of the compounds and the test (endpoint) that is used. The observations from this experiment are especially interesting when viewed along with the work of others with this same drug combination. For example, Ossipov et al. (1990a,b) found synergism for this combination using the intrathecal route but only simple additivity with systemic administration of the same drugs. It is quite plausible that different routes of administration lead to different values of the spinal concentration values of the drugs and, as observed from the response-surface approach, different values of the interaction index. Accordingly, the index can be unity (indicative of additivity) for one concentration combination while having very different values (<1 or >1) for other combinations. A response surface analysis, by examining all concentration pairs, allows for these possible pharmacokinetic considerations.
Synergism and Mechanism
At the start of this review it was mentioned that a finding of synergism may illuminate the mechanism of action of even a single agent. An illustration is afforded by findings resulting from concomitant administration of morphine at both spinal and supraspinal sites in the rat that showed antinociceptive synergy (Yeung and Rudy, 1980) and similar findings in the mouse (Roerig et al., 1984; Wigdor and Wilcox, 1987; He and Lee, 1997). Because systemic morphine will get into both brain and spinal sites, the analgesia produced by this narcotic would reflect this synergy. It would follow that other attributes of morphine action might be explained by an awareness of this synergism. In that regard Roerig et al. (1984) explored the possibility that morphine tolerance in mice might somehow be a phenomenon related to the change in the degree of this synergism and obtained results that supported that hypothesis. A later study (Roerig, 1995) showed that spinal morphine + clonidine synergism is reduced to additivity in morphine-tolerant mice. Similar experiments carried out with this goal (Fairbanks and Wilcox, 1999) obtained results showing that spinal synergism between morphine and clonidine persists in mice made tolerant to morphine. While the latter experimental finding did not support the former, the point here is in the demonstration that analyses measuring interactive synergy (or subadditivity) can provide directions for investigating drug mechanism. In other words, each of these experiments used synergism analysis as a basis for investigating a mechanism. Also contained in these experiments were results that further pointed out the role of coactivation of both alpha-2 adrenergic receptors and opioid receptors on spinal cord neurons, a finding we previously mentioned. Raffa et al. (2001) considered the possibility that alpha adrenergic receptors may also play a role in antinociception produced by drugs of an entirely different class and, acting on this idea, examined acetaminophen and the alpha blocker phentolamine in mice receiving intrathecal doses of each. The result was a pronounced synergism.
The use of two sites in the administration of the same compound, and the observation that each site potentiates the effects from the other site, illustrates a powerful new technique for studying drug action. Porreca's laboratory has been active in applying this technique and extended it to an investigation of morphine action in animals with peripheral nerve injury (Bian et al., 1999). These investigators reasoned that the spinal/supraspinal antinociception produced by morphine is an important feature of its normal clinical analgesic utility and, thus, the absence of spinal efficacy of morphine in rats with experimental nerve injury might be due to a loss of the synergy. They tested this hypothesis in nerve-injured rats and demonstrated a loss of synergy, thereby supporting their hypothesis and giving a possible explanation for the inability of morphine to provide pain relief in neuropathic pain.
A further application of the site-site methodology was made by Raffa et al. (2000) in studies of acetaminophen antinociception. In contrast to much mechanistic information on opioid analgesia, and much on nonsteroidal anti-inflammatory drug analgesia, there is little known about the pain pathway that is affected by acetaminophen (Walker, 1995). The Raffa studies were aimed at elucidating this mechanism by giving acetaminophen spinally (i.th.) and supraspinally (i.c.v.) to mice subsequently examined in the abdominal irritant test. Absence of writhing during a 10-min observation period was the criterion for protection, thereby yielding quantal dose-effect data that was analyzed with probit analysis (Tallarida, 2000). Acetaminophen administered supraspinally (i.c.v.) was found to be virtually without antinociceptive effect in this test, whereas i.th. administration produced a dose-dependent effect. This finding suggested that the simultaneous use of both routes (in equal amounts), if additive, would produce effects in which the dose dependence is identical to that of the i.th. component of the dose. Analysis of the dose-effect data, however, revealed a marked synergism. This finding of synergism suggested to the investigators that some endogenous substance in brain might be released into the spinal cord and that assumption prompted additional tests with the opioid antagonist naloxone. Naloxone (10 nmol) administered i.c.v. did not alter the combination action. Intrathecal administration of the opioid antagonist translated thecombination dose-effect curve toward the curve of additivity, while i.th naloxone plus i.th acetaminophen resulted in a curve virtually identical to that of i.th acetaminophen alone. These findings suggest that acetaminophen in the brain results in a naloxone-independent release of an opioid-like compound in the spinal cord but in a quantity not sufficient to produce analgesia. However, this released compound, in association with acetaminophen's nonopioid action in the spinal cord, interacts synergistically. This interaction, termed “self-synergy”, has provided new insights on the mechanism of acetaminophen action by invoking the role of an endogenous opioid pathway that is (at least partly) involved in the analgesic mechanism of this popular analgesic drug. This work has opened an entirely new line of investigation on this important pain pathway.
Receptor Subtypes and Synergism
Much work in recent years has demonstrated the existence of subtypes of receptors for the same compound or group of compounds. Thus, all known neurotransmitters and many important drug classes now have very specific agonist and antagonist agents that are useful clinically and experimentally. The role of receptor subtypes and the possible communication among the sites that are stimulated are matters that fall naturally into the subject discussed here. Investigators in the opioid field seem to be among the most aggressive in experiments of this kind, i.e., the use of receptor-specific agents in combination with the aim of detecting synergism. Studies in Adler's laboratory examined delta and mu opioid agonists (in rat) using different antinociceptive tests (Adams et al., 1993). Those experiments revealed that departures from additivity (super- and subadditivity) were strongly dependent on the ratio of constituents and on the test of antinociception used. The importance of the test is especially interesting and is emphasized by recent work in that laboratory that has been extended to examinations of opioid and other combinations on end points that include immune system suppression (Eisenstein et al., 1997), in addition to the more usual opioid end points. Porreca's laboratory has conducted numerous studies of morphine and specific opioid delta agonists in mice. In one such study (Horan et al., 1992) morphine was examined along with either [d-Pen2,d-Pen5]enkephalin, deltorphin, or [Met5]enkephalin given i.c.v. and tested in the hot water tail-flick test. The first two synergized with morphine, whereas the latter produced a subadditive interaction. These findings support the concept of a functional interaction between these receptor subtypes and a potential regulatory role of endogenous ligands of the opioid delta receptor. Studies in Hammond's laboratory also examined delta subtypes of the morphine receptor (in rat) but used a different design, viz., one that used concurrent administration at spinal and supraspinal sites of either the delta-1 agonist [d-Pen2,5]enkephalin or the delta-2 agonist [d-Ala2,Glu4]deltorphin (Hurley et al., 1999). The delta-1 agent produced simple additivity, whereas the delta-2 agonist showed synergism at low doses and additivity as the dose was raised. This is a further example illustrating the use of combination analysis as a methodology useful in guiding studies of mechanism.
Mathematics and Synergism Studies
Evidence that synergism exists comes down to a quantitative analysis, namely, a demonstration that some number (e.g., potency) of the combination is different from some other number that is calculated from the individual drug data. In that regard, this subject is mathematical and dependent on statistical analyses because of the variability seen in drug actions. In preparing this review, it was tempting to insert these mathematical details. It was also clear, however, that the space and scope of this communication could not accommodate an adequate discussion of the mathematics. Yet it seems that some guidance ought to be provided here. It was pointed out by John L. Plummer [in an internet review of the recent monograph by this author (Tallarida, 2000)] that journal articles dealing with analyses of drug combinations exist, but are scattered throughout the literature. I fully agree, and it was that fact that motivated my own work and the reference list included here. It is also known that much of the methodology for analyzing combination drug data requires related statistical procedures for the analysis of dose-response data and dose-response curves. Especially important are the weighted regression procedures that are necessary when examining quantal dose-effect data. These are probit and logit methods that, unfortunately, seem to be neglected in most standard statistics books, but these topics are covered in some older works (Goldstein, 1964; Finney, 1971). For graded dose-effect data, simple linear regression often suffices, but sometimes nonlinear curve fitting is desirable or actually required. Several standard software packages can accommodate some of these needs (SPSS, Chicago, IL; MATLAB, Mathworks, Inc., Natick, MA). These are well known, and a recently released software package (PharmToolsPro, The McCary Group, Elkins Park, PA) provides a comprehensive set of procedures that accommodate linear and nonlinear dose-effect analysis of single drug and combination data.
This discussion of drug combination analysis and synergism has dealt with methods that are closely tied to the definition of additivity and the departures from additivity that are consequent to this definition. The definition is the classic pharmacological one and is based on the idea that overtly similar drugs, when used in combination, will produce effects that are predictable from their individual potencies. The term additivity is used, however, in different ways and is sometimes coupled to models that are a bit more complicated, that is, less closely tied to the definition used here. Some are quite useful, however, and may help reveal mechanisms that are responsible for the enhanced combination action (Plummer and Short, 1990; Gennings et al., 1990). Others arising from different definitions, models, and statistical approaches have sometimes caused confusion, as pointed out by Gebhart (1992a,b) and by Caudle and Williams (1993). Use of combinations of drugs, or combinations of sites of administration of the same drug, when analyzed by proper definitions and plausible models, represents a valuable technique that can be useful in illuminating mechanism as well as providing clinical information.
Acknowledgments
I thank Jeffrey McCary for technical assistance in the preparation of the manuscript.
Footnotes
-
This work was supported in part by Grant DA 09793-04 from the National Institute on Drug Abuse.
- Abbreviations:
- A
- dose (or concentration) of drug A
- α
- interaction index
- B
- dose (or concentration) of drug B
- R
- relative potency
- (a
- b), doses in a combination
- pA
- proportion of total that is drug A
- pB
- proportion of total that is drug B
- fA
- fraction of potency of drug A
- fB
- fraction of potency of drug B
- i.th.
- intrathecal
- i.c.v.
- intracerebroventricular
- Zt
- total dose
- Received February 23, 2001.
- Accepted April 17, 2001.
- The American Society for Pharmacology and Experimental Therapeutics


