


Abstract
Treatment with the microsomal enzyme inducer trans-stilbene oxide (TSO) can decrease biliary excretion of acetaminophen-glucuronide (AA-GLUC) and increase efflux of AA-GLUC into blood. The hepatic canalicular multidrug resistance protein (Mrp) 2 and sinusoidal protein Mrp3 transport AA-GLUC conjugates into bile and blood, respectively. Thus, TSO-induced alterations in the vectorial excretion of AA-GLUC may occur via increased hepatic Mrp3 levels. The goal of this study was to determine whether TSO, diallyl sulfide (DAS), and oltipraz (OLT) treatments can up-regulate Mrp3 protein expression, and whether treatment with DAS and OLT can correspondingly increase hepatovascular efflux of AA metabolites. Rats were administered phenobarbital, TSO, DAS, OLT, or vehicle for 4 days. Interestingly, all of the chemicals increased the plasma concentration and urinary excretion of AA-GLUC and decreased its biliary excretion. In control animals, approximately 77% and 23% of AA-GLUC was excreted into bile or urine, respectively, whereas with inducer-pretreated animals, <32% of AA-GLUC was excreted into bile and >68% was excreted into urine. Correspondingly, all of the compounds increased hepatic Mrp3 mRNA levels by 13- to 37-fold and protein levels by 2- to 6-fold, respectively. In conclusion, these studies correlate increased Mrp3 protein levels in liver with increased hepatovascular excretion of AA-GLUC and suggest that induction of Mrp3 affects the route of drug excretion.
In liver, acetaminophen is mainly detoxified by conjugation with glucuronide or sulfate to form AA2-glucuronide (AA-GLUC) or AA-sulfate (AA-SULF), respectively. Depending on dose, a fraction of AA will also undergo metabolism by Cyp2E1, Cyp1A2, and Cyp3A to form the reactive metabolite N-acetyl-p-benzoquinoneimine, which is subsequently detoxified by conjugation with intracellular glutathione to form the AA-glutathione metabolite (AA-GSH) (for review, see Vermeulen et al., 1992). Normally, in rats administered AA, the AA-GLUC and AA-GSH metabolites are predominantly excreted into bile, whereas the AA-SULF metabolite is predominantly excreted into urine (Gregus et al., 1988). AA-GSH can be further metabolized to AA-cysteine and AA-N-acetyl-l-cysteine (mercapturate) (AA-NAC) in kidney and liver and excreted into urine (Fischer et al., 1985).
Preteatment of rats with microsomal enzyme inducers such as phenobarbital (PB) and trans-stilbene oxide (TSO) prior to AA administration impairs biliary and increases urinary excretion of AA metabolites (Brouwer and Jones, 1990; Gregus et al., 1990). Interestingly, pretreatment with PB or TSO increased plasma concentrations of AA-GLUC, increased urinary excretion of AA-GLUC, and increased the ratio of urinary to biliary excretion for AA-GLUC. In addition, TSO pretreatment decreased the biliary excretion of morphine-glucuronide and increased the transfer of morphine-glucuronide to the blood (Fuhrman-Lane and Fujimoto, 1982).
The mechanism by which pretreatment with microsomal enzyme inducers alter drug uptake and excretion may be in part related to their effects on drug transport proteins in the liver. Multidrug resistance proteins 2 and 3 (Mrp2, Abcc2; Mrp3, Abcc3) are members of the ATP-binding cassette transporter family of proteins responsible for the excretion/transport of organic anions such as glucuronide, sulfate, and glutathione conjugates (Borst et al., 2000; Keppler and Konig, 2000). Mrp2 is localized to the canalicular membrane of the hepatocyte and is generally thought to be a transport protein responsible for the biliary excretion of unconjugated and conjugated drugs (Buchler et al., 1996; Keppler et al., 1997). In contrast to Mrp2, Mrp3 protein is localized to the basolateral membrane of hepatocytes and cholangiocytes (Konig et al., 1999; Donner and Keppler, 2001; Soroka et al., 2001). However, Mrp3 does share similar substrates, such as some glucuronide, sulfate, and glutathione conjugates, with Mrp2 (Akita et al., 2002). Recently, it has been demonstrated that Mrp2 and Mrp3 can transport AA-GLUC (Xiong et al., 2000, 2002a). Importantly, studies utilizing GY/TR- rat livers perfused with AA showed a decrease in the amount of AA-GLUC in bile and an increase in AA-GLUC present in the hepatovascular compartment (Xiong et al., 2000). This demonstrates that under naive conditions, Mrp2 is responsible for the biliary excretion of AA-GLUC, and absence of Mrp2 results in increased transport of AA-GLUC across the sinusoidal membrane, probably because there are increased levels of Mrp3 protein (Xiong et al., 2000, 2002a). Furthermore, AA-GLUC can decrease Mrp2-mediated 5- (and 6-)carboxy-2′,7′-dichlorofluorescein uptake in membrane vesicles that contain recombinant rat Mrp2 protein, and AA-GLUC is transported in membrane vesicles that contain recombinant rat Mrp3 (Xiong et al., 2002a). Thus, AA-GLUC is a substrate for Mrp2 and Mrp3 transport.
Mrp3 mRNA and protein levels are induced under conditions where functional hepatic Mrp2 protein is absent or down-regulated, such as in livers from patients with Dubin-Johnson syndrome, in livers from EHBRs and GY/TR-, and in bile duct-ligated rats (Konig et al., 1999; Ogawa et al., 2000). The increased level of liver Mrp3 protein in EHBRs has also been associated with increased sinusoidal efflux of taurocholate, an Mrp3 substrate (Akita et al., 2001). Mrp3 protein expression in liver is induced under conditions of cholestasis (Soroka et al., 2001). In addition to cholestasis, induction of Mrp3 mRNA expression in rat liver can occur by treatment with microsomal enzyme inducers that induce cytochrome P450 2B1/2 (Cyp2B1/2), such as PB, diallyl sulfide (DAS), and oltipraz (OLT) (Ogawa et al., 2000; Cherrington et al., 2002). It has not been determined whether TSO, DAS, and OLT treatment can increase Mrp3 protein levels in liver. Furthermore, it has not been determined whether pretreatment with DAS or OLT can alter AA excretion or whether the previously observed TSO-induced alterations in vectorial excretion of AA-GLUC occurs via increased hepatic Mrp3 levels.
Therefore, the goal of this study was to determine 1) whether pretreatment with TSO, DAS, and OLT can up-regulate liver Mrp3 protein expression in liver, and 2) whether other compounds that increase liver Mrp3 mRNA levels, such as DAS and OLT, can correspondingly increase hepatovascular efflux and urinary excretion of AA-GLUC and/or other AA metabolites.
Materials and Methods
Materials. AA, DAS, and urethane were purchased from Sigma-Aldrich (St. Louis, MO). TSO was obtained from Aldrich Chemical Co. (Milwaukee, WI), OLT was a gift from Dr. Ronald Lubet (National Cancer Institute, Bethesda, MD), and PB was a gift from Dr. Sara Li (University of Kansas Medical Center, Kansas City, KS). The analytical column and guard cartridges for high performance liquid chromatography (HPLC) analysis were purchased from Bodman (Aston, PA). HPLC-grade water, HPLC-grade methanol, Tris base, SDS, sodium chloride, and sucrose were purchased from Fisher Scientific (Pittsburgh, PA), and all other chemicals used were of reagent grade or better.
Treatment of Animals. Male Sasco Sprague-Dawley rats weighing 200 to 250 g were purchased from Charles River Laboratories Inc. (Wilmington, MA). Animals were housed in a temperature-, light-, and humidity-controlled environment in hanging cages with hardwood chips. The rats were fed Laboratories Rodent Chow W (Harlan Teklad, Madison, WI) ad libitum. TSO, DAS, and OLT were dissolved in corn oil, and PB was dissolved in saline. The rats (n = 3–5/group) were treated for 4 days using the following daily doses: PB (80 mg/kg, 5 ml/kg i.p.), DAS (400 mg/kg, 5 ml/kg i.p.), OLT (150 mg/kg, 5 ml/kg p.o.), and TSO twice daily (200 mg/kg, 2 ml/kg i.p.). Controls received the corresponding vehicle for 4 days at the same dose volume. Because there were no differences between the various control groups, the data from all of the control animals were pooled and are shown as one group. All animal studies were conducted according to the National Institutes of Health guidelines.
AA Excretion Experiments. Under urethane-induced anesthesia (1.1 g/kg, 5 ml/kg i.p.), the left carotid artery and bile duct were cannulated with PE 50 and PE 10 polyethylene tubing, respectively. Before injection of AA, the carotid cannula was flushed with approximately 0.5 ml of saline-5% mannitol solution containing 50 U of heparin to prevent clotting. AA was dissolved in saline containing 5% mannitol and injected into the carotid cannula at a dosage of 1 mmol/kg (10 ml/kg) using a 3-ml syringe with a 22-gauge needle. After AA injection, the carotid cannula was flushed with a 0.5-ml injection of saline-5% mannitol solution. At 2, 10, 20, 40, 60, and 90 min after AA administration, approximately 250-μl blood samples were collected from the carotid artery into heparinized tubes. Bile was collected at 15, 30, 45, 60, 75, and 90 min after AA administration. To maintain urine flow, 10 ml/kg saline was injected through the carotid cannula every 15 min after AA administration. Urine was collected at 60 and 90 min by gently pressing on the bladder. Any urine remaining in the bladder at 90 min after AA administration was collected by ligation of the bladder and removal with a 22-gauge needle and 3-ml syringe. All samples were stored at -70°C until analysis.
Detection of AA and AA Metabolites. AA and AA metabolites in plasma, bile, and urine were determined by high performance liquid chromatography analysis based on previously described methods (Howie et al., 1977; Zaher et al., 1998; Gregus et al., 1990; Chen et al., 2000). AA and AA metabolites were resolved using a Zorbax SB-C18 column (4.6 mm × 250 mm, 5-μm pore size) with an SB-C18 precolumn guard cartridge (4.6 mm × 12.5 mm) and eluted with mobile phase (85% methanol, 0.1% acetic acid) at a flow rate of 1.1 ml/min. Retention times were verified using standards and under the above conditions, AA-GLUC, AA-SULF, AA, AA-GSH, and AA-NAC eluted at the following retention times, respectively: 4.3, 5.4, 8.2, 10.2, and 16.2 min. AA and AA metabolite concentrations were calculated using an AA standard curve because the molar extinction coefficient of the metabolites is the same as that for AA (Howie et al., 1977). To precipitate protein, bile, plasma, and urine were diluted 1:2, 1:2, and 1:5, respectively, with ice-cold methanol and centrifuged at 4,000g for 15 min. The resulting supernatants were collected and diluted in mobile phase 1:3 (bile and urine) or 1:2 (plasma). Because AA-GSH, AA-cysteine, and AA-NAC were virtually undetectable in plasma, only AA-GLUC and AA-SULF metabolite levels in plasma are presented.
RNA Extraction. Total RNA from liver and kidney tissue was extracted using RNAzol B reagent (Tel-Test Inc., Friendswood, TX) according to the manufacturer's protocol. RNA integrity was confirmed by formaldehydeagarose gel electrophoresis.
Branched DNA Signal Amplification (bDNA) Assay. Rat Mrp1–Mrp3 mRNA was measured using the branched signal amplification assay (QuantiGene High Volume bDNA Signal Amplification Kit; Bayer Corp.-Diagnostics Div., Tarrytown, NY) with modifications (Cherrington et al., 2002). Multiple oligonucleotide probe sets (containing capture, label, and blocker probes) specific to Mrp1–Mrp6 mRNA transcripts were designed using ProbeDesigner software v1.0 (Bayer Corp.-Diagnostics Div.). The probe sets used to detect rat Mrp4, Mrp5, and Mrp6 have been previously described by Leazer and Klaassen (2003). Probes were designed with an annealing temperature of approximately 63°C, which enabled the hybridization conditions to be held constant (i.e., 53°C) during each hybridization step and for each probe set. Every probe developed in ProbeDesigner was submitted to the National Center for Biotechnological Information for nucleotide comparison by the basic logarithmic alignment search tool (BLASTn), to ensure minimal cross-reactivity with other known rat sequences and expressed sequence tags. Oligonucleotides with a high degree of similarity (≥80%) to other rat gene transcripts were excluded from the design.
Total RNA (1 μg/μl; 10 μl/well) was added to each well of a 96-well plate containing capture hybridization buffer and 50 μl of each diluted probe set. For each gene, total RNA was allowed to hybridize to the probe set overnight at 53°C. Subsequent hybridization steps were carried out per the manufacturer's protocol, and luminescence was measured with a Quantiplex 320 bDNA Luminometer interfaced with Quantiplex Data Management Software Version 5.02 for analysis of luminescence from 96-well plates. The luminescence for each well was reported as relative light units (RLU) per 10 μg total RNA.
Western Analysis of Mrp2 Protein Expression. Liver and kidney membrane preparations were made as previously described (Ogawa et al., 2000). Protein concentration of the liver membrane fractions was determined by the DC protein assay (Bio-Rad, Hercules, CA). Prior to Western analysis, sample integrity, concentration, and loading volume were checked by SDS-PAGE stained with Coomassie Brilliant Blue staining. Membrane proteins (40–60 μg/lane) were electrophoretically resolved using Bio-Rad Criterion Tris-Glycine gels (10% resolving gel, 4% stacking gel) and then transblotted overnight at 4°C onto nitrocellulose(Bio-Rad) with Tris-glycine buffer containing 10% methanol and 0.1% SDS. The blots were then blocked for 1 h in 5% Carnation nonfat dry milk in TBS-Tween buffer (15 mM Trizma base, 154 mM sodium chloride, 0.05% Tween 20, pH 7.4), incubated overnight at 4°C with mouse anti-human M2III-6 monoclonal antibodies (ID Labs Inc., London, ON, Canada) diluted in 5% nonfat dry milk (1:2000), and then washed three times for 5 min in TBS-Tween buffer. Following the above washes, the blots were incubated for 1 h at room temperature with sheep anti-mouse IgG conjugated with horseradish peroxidase (Amersham Biosciences Inc., Piscataway, NJ), diluted 1:2,000 in TBS-Tween buffer, and then subjected to three additional 5-min washes. Mrp2 protein-antibody complexes were detected using ECL Western blotting reagents (Amersham Biosciences Inc.), and resulting autoradiographs were exposed to Fuji medical X-ray film (Fisher Scientific, Springfield, NJ) and quantified using an Amersham Biosciences Inc. Image Quant densitometer and software.
Western Analysis of Mrp3 Expression. The method was the same as above for Mrp2 Western analysis with modifications. Affinity-purified antibodies against rat Mrp3 protein were generated in rabbits immunized with a 19-amino acid peptide antigen (CLRNYAPDENQEANEGVLQ) representing amino acids 847 to 864 of the rat Mrp3 protein (GenBank accession number O88563). Before Western analysis, sample integrity, concentration, and loading volume were checked by SDS-PAGE stained with Coomassie Brilliant Blue staining. Proteins were transblotted onto a polyvinylidene difluoride membrane, and blots were incubated with anti-Mrp3 that was diluted in blocking solution at a concentration of 1:5,000 for 3.5 h at room temperature. Blots were washed three times for 5 min in TBS-Tween buffer, and then incubated for 1 h at room temperature with donkey anti-rabbit IgG conjugated with horseradish peroxidase (Amersham Biosciences Inc.) diluted 1:5,000 in TBS-Tween buffer. For peptide competition, 10 μl of purified antibody was incubated with 500 μg of peptide dissolved in 90 μl of TBS-Tween buffer and incubated for 1.5 h at 37°C. The mixture was then diluted in 50 ml of blocking solution to give an anti-Mrp3 concentration of 1:5,000.
The antibodies generated against rat Mrp3 protein detect a protein product that is inducible by both PB and bile duct ligation, detect a partial recombinant rat Mrp3 protein (aa 838–973), and do not cross-react with recombinant rat mrp2 protein (data not shown).
Immunohistochemical Detection of Mrp2 and Mrp3 in Rat Liver. Sections of liver were rapidly frozen in isopentane cooled with dry ice and stored at -70°C until use. Cryosections (4–5 μm) were obtained using a Leica Jung Frigocut 2800N microtome, thaw-mounted onto Superfrost slides (Fisher Scientific, Pittsburgh, PA), and stored at -70°C in a bag with desiccant until use. All antibody solutions were filtered through 0.22-μm Low Protein Binding Durapore (polyvinylidene difluoride) membrane syringe-driven filter units (Millipore Corporation, Bedford, MA) prior to use. For Mrp2 detection, sections were air-dried at room temperature for 30 min and blocked at room temperature for 30 min with 5% goat serum/phosphate-buffered saline with 0.2% Triton X-100 (PBS-T), and then incubated with affinity-purified Mrp2 primary antibody EAG15 diluted 1:50 in 5% goat serum/PBS-T for 2 h at room temperature (Johnson et al., 2002). For Mrp3 detection, the sections were then incubated with anti-Mrp3 (same as used for Western analysis, diluted 1:25) in 5% goat serum/PBS-T for 2 h at room temperature. After incubation in primary antibody, the sections were washed three times for 10 min with PBS-T and incubated for 1 h at room temperature with fluorescein isothiocyanate (FITC)-labeled secondary antibody to rabbit IgG (Santa Cruz Biotechnology, Inc., Santa Cruz, CA) diluted 1:200 in 5% goat serum/PBS-T. Slides were washed in PBS (without Triton X-100) three times for 10 min each and then rinsed twice in distilled deionized water. The sections were air dried and mounted with Vectashield (Vector Laboratories, Burlingame, CA). Sections were visualized and analyzed using a Zeiss LSM 510 confocal microscope with LSM software v2.8.
Statistics. For excretion studies, statistical differences between treatment groups at each time point were determined by one-way analysis of variance followed by Duncan's post hoc test. Similarly, differences in mRNA or protein expression between treatment groups were determined by analysis of variance followed by Duncan's post hoc test. Asterisks (*) represent a statistical difference from control (p ≤ 0.05).
Results
Effect of OLT, TSO, DAS, and PB on Bile Flow. The cumulative amount of bile collected within 90 min after AA administration for each treatment group is shown in Fig. 1. Because there was not a statistical difference in bile flow among the vehicle-treated control groups, the data were pooled and are shown as one control group. There was no difference in cumulative bile flow between control animals and animals pretreated with OLT or DAS. In PB-pretreated animals, there was a 20% increase in the cumulative volume of bile eliminated at several time points. Although not statistically significant, it appears that TSO treatment may slightly increase bile flow as well.
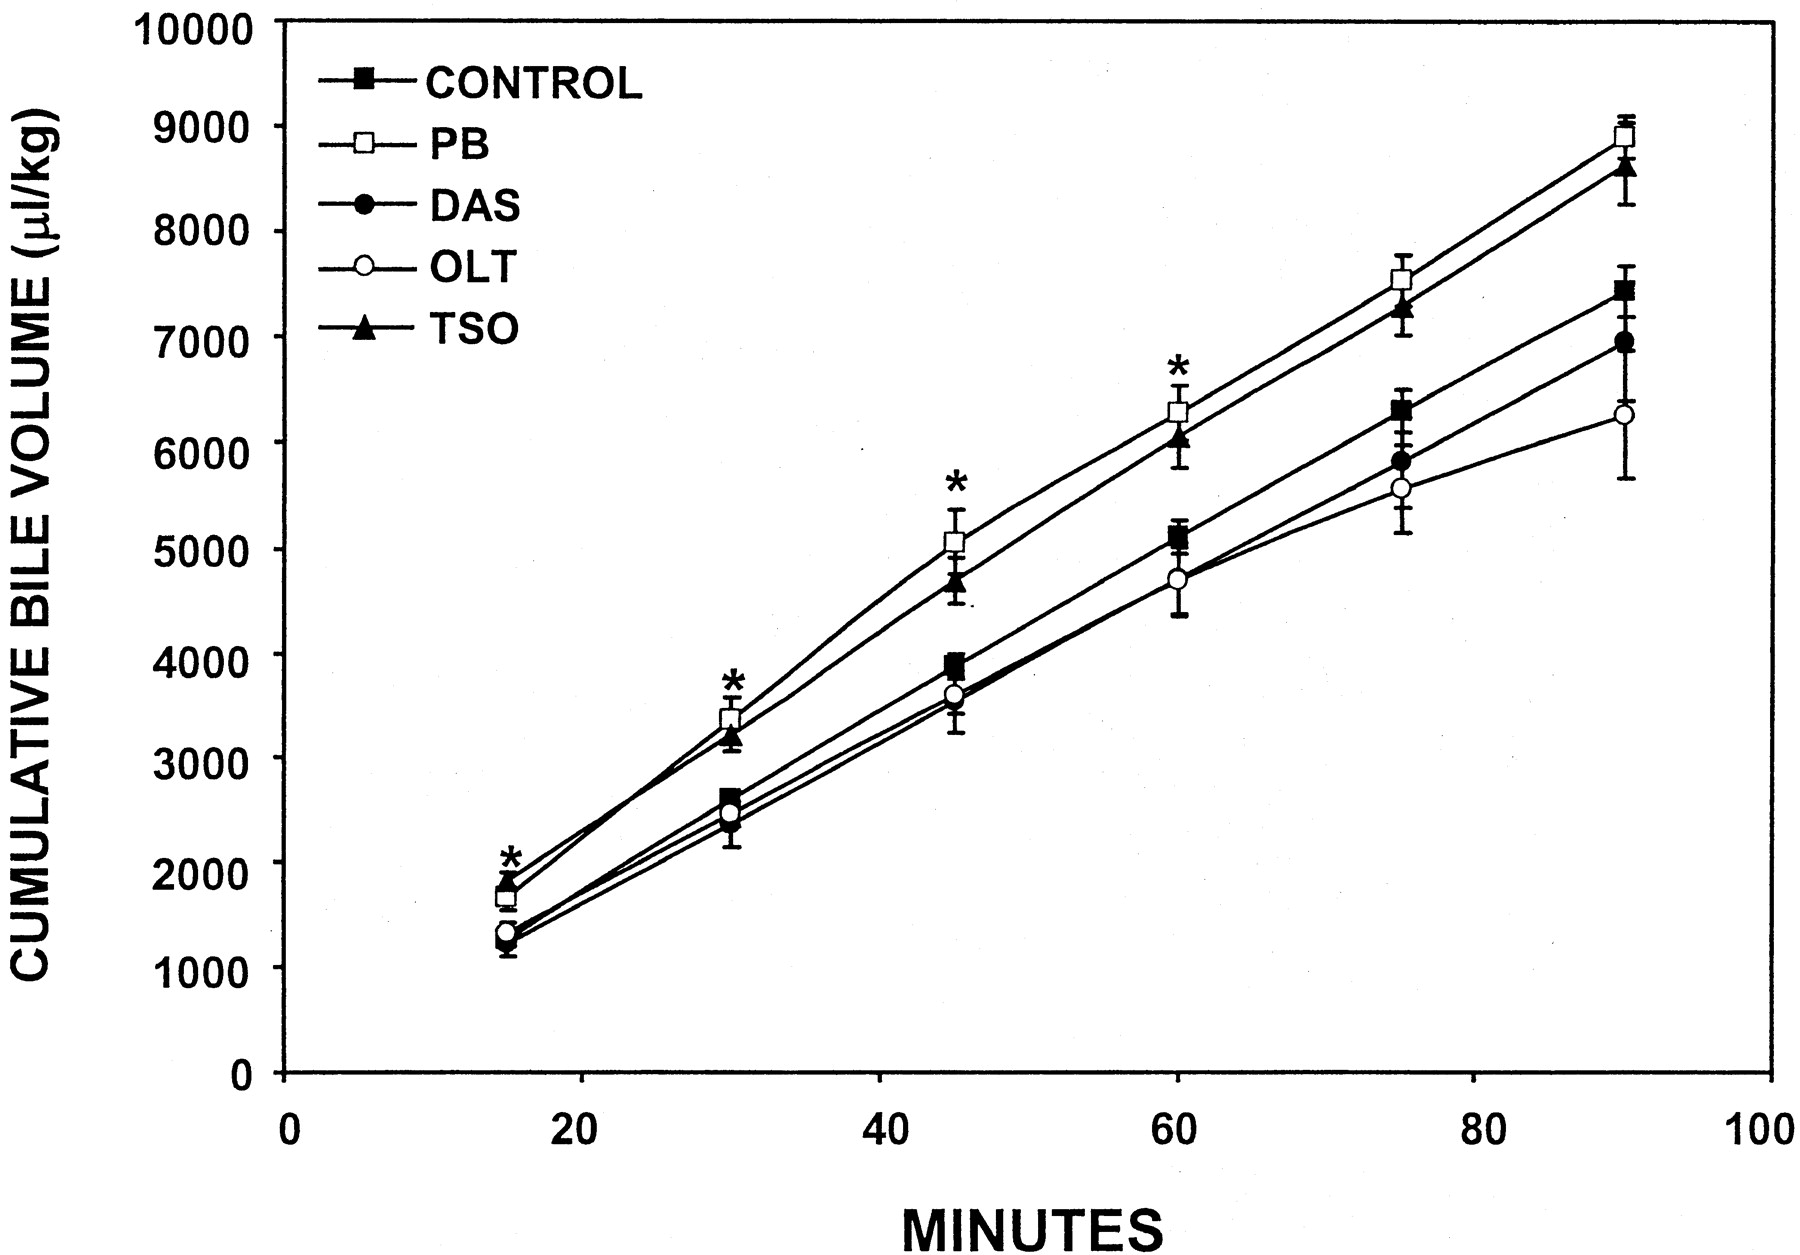
Effect of PB, DAS, OLT, or TSO pretreatment on cumulative bile volume.
Rats were administered PB, DAS, OLT, or TSO for 4 days. The left carotid artery and common bile duct were cannulated and AA was administered. Bile was collected every 15 min thereafter for 90 min. The data are presented as mean ± S.E.M. Asterisks (*) represent a statistical difference (p ≤ 0.05) from control.
Effect of OLT, TSO, DAS, and PB on AA Disposition.Biliary excretion. The cumulative biliary excretion of AA and its metabolites over 90 min is shown in Fig. 2, and the total amount of AA and its metabolites excreted into bile is shown in Table 1. Quantitatively, AA-GLUC was the most abundant metabolite excreted in bile from control rats. AA and AA metabolites were detected in bile from control and treated animals within 15 min after AA administration, and the amount of AA and AA metabolites excreted into bile increased over time. For controls, the total amount of AA-GLUC excreted over 90 min was 84.2 ± 5.7 μmol/kg. Interestingly, pretreatment with DAS, OLT, and TSO decreased the cumulative biliary excretion of AA-GLUC by approximately 80%, each being slightly more effective than PB, which decreased AA-GLUC biliary excretion 56% from controls (Fig. 2, panel A).

Effect of PB, DAS, OLT, or TSO pretreatment on biliary excretion of AA and AA metabolites.
Experimental conditions are the same as for Fig. 1. Shown is the cumulative biliary excretion of AA-GLUC (A), AA-SULF (B), AA (C), and AA-GSH (D) following AA administration. The data are presented as mean ± S.E.M. The bracketed treatment groups with adjacent asterisks (*) indicate that values were statistically different (p ≤ 0.05) for all groups from control.
Cumulative biliary excretion of AA and AA metabolites after PB, DAS, OLT, or TSO pretreatment Experimental conditions are the same as those described for Fig. 1. Bile was collected over 90 min after administration of AA (1 mmol/kg i.v.). Values are means ± S.E.M.
The cumulative biliary excretion of AA-SULF is shown in Fig. 2, panel B, and Table 1. In controls, the total amount of AA-SULF excreted into bile was 22.2 ± 2.5 μmol/kg. PB, DAS, OLT, and TSO all significantly decreased the biliary excretion of AA-SULF by 15 min after AA administration. All of the compounds decreased the biliary excretion of AA-SULF to 20–29% of that for control rats.
The cumulative biliary excretion of AA is shown in Fig. 2, panel C and Table 1. In control rats, the total amount of AA excreted into bile 90 min after administration was 6.5 ± 1.1 μmol/kg. PB pretreatment more than doubled the biliary excretion of AA to 16.4 μmol/kg. TSO, OLT, and DAS pretreatment had no significant effect on the biliary excretion of AA.
The cumulative biliary excretion of AA-GSH is shown in Fig. 2, panel D, and Table 1. In control rats, the total amount of AA-GSH excreted into bile 90 min after AA administration was 18.5 ± 2.0 μmol/kg. TSO pretreatment significantly decreased the amount of AA-GSH excreted into bile over 90 min by approximately 75%. In contrast, PB pretreatment significantly increased the total amount of AA-GSH excreted into bile by about 240%. DAS and OLT pretreatment did not have a statistically significant effect on the biliary excretion of AA-GSH, but DAS tended to decrease the biliary excretion of AA-GSH.
Plasma Concentration of AA-GLUC and AA-SULF. The time course of AA-GLUC and AA-SULF in plasma following AA administration in control, as well as TSO, OLT, DAS, and PB pretreated rats is shown in Fig. 3, panel A. In vehicle treated control animals, AA-GLUC was detected in plasma within 2 min following AA administration and reached a concentration of 220 nmol/ml at 90 min after AA administration. Importantly, plasma AA-GLUC concentrations were significantly higher in all inducer-treated groups by 10 min after AA administration, and remained significantly elevated throughout 90 min. In general, OLT pretreatment was the most effective in elevating plasma AA-GLUC concentrations, with TSO, DAS and PB pretreatments being somewhat less effective. At 20 min after AA administration, OLT and TSO increased plasma concentrations of AA-GLUC by at least 5 fold above control concentrations, whereas DAS and PB increased concentrations by about 3 fold. Plasma AA-GLUC concentrations remained elevated above control levels for 90 min after AA administration, with the level of AA-GLUC being approximately 2.5–4 fold higher in plasma from PB, DAS, OLT, and TSO pretreated animals than in plasma from control rats.

Effect of PB, DAS, OLT, or TSO pretreatment on plasma concentration of AA-GLUC and AA-SULF.
Experimental conditions are the same as for Fig. 1. A, serum concentration of AA-GLUC following AA administration. B, serum concentration of AA-SULF following AA administration. The data are presented as mean concentration ± S.E.M. The bracketed treatment groups with adjacent asterisks (*) indicate that values were statistically different (p ≤ 0.05) for all groups from control.
AA-SULF was detected in the plasma of vehicle-treated control animals by 2 min after AA administration with a concentration of 235 nmol/ml (Fig. 3, panel B). In PB, DAS, and OLT treated animals, plasma AA-SULF concentration was increased about 2 fold over controls 2 min after AA administration. Pretreatment with PB, DAS, and OLT did not significantly elevate AA-SULF concentrations in plasma at any of the other time points analyzed, except OLT increased AA-SULF in plasma 20 min after AA administration, and PB pretreatment increased plasma AA-SULF concentration at 90 min. Unlike the other compounds, TSO pretreatment decreased the plasma concentration of AA-SULF at 40, 60, and 90 min after AA.
Effect of OLT, TSO, DAS, and PB on AA Disposition.Urinary excretion. The effect of TSO, OLT, PB, and DAS on the urinary excretion of AA and AA metabolites is presented in Table 2. In urine from control rats, AA-SULF was the AA metabolite present in the highest amount, followed by AA-GLUC, and AA-NAC. All of the microsomal enzyme inducer treatments increased the amount of AA-GLUC excreted into urine. TSO and OLT treatments increased the amount AA-GLUC in urine by approximately 7.5-fold and 5-fold, respectively. PB and DAS increased the urinary excretion of AA-GLUC to a lesser extent, by approximately 3- to 4-fold. None of the compounds increased the urinary excretion of AA-SULF. The cumulative urinary excretion of the parent AA was unaffected by any of the inducer treatments. All of the microsomal inducers increased the urinary excretion of AA-NAC. OLT and TSO pretreatment significantly increased the urinary excretion of AA-NAC by 10- to 14-fold, whereas PB and DAS pretreatments increased urinary excretion of AA-NAC to a lesser extent (6- and 4-fold, respectively). Overall, TSO and OLT increased the total AA and AA metabolite excretion into urine by approximately 2- to 3-fold. Although not statistically significant, PB and DAS treatments tended to increase the total urinary excretion of AA and AA metabolites.
Cumulative urinary excretion of AA and AA metabolites after PB, DAS, OLT, or TSO pretreatment Experimental conditions are the same as those described for Fig. 1. Urine was collected over 90 min after administration of AA (1 mmol/kg i.v.). Values are means ± S.E.M.
Relative Biliary and Urinary Excretion of AA and AA Metabolites. Under naive conditions, AA-GLUC and AA-GSH are predominantly excreted into bile and to a lesser extent into urine, whereas a greater portion of AA-SULF is excreted into urine, with a smaller fraction being excreted into bile (Table 3). Approximately 78% of the AA-GLUC was excreted into bile and 22% was excreted into urine. By contrast, in control rats, AA-SULF was predominantly excreted in urine (80%) instead of bile (20%). For control rats, AA-GSH was predominantly excreted into bile (93%), with a small amount of AA-GSH excreted in urine as AA-NAC (7%). Overall, the total amount of AA and AA metabolites excreted into bile and urine was equivalent in control rats.
Percentage of AA metabolite excreted into urine or bile after PB, DAS, OLT, or TSO pretreatment Experimental conditions are the same as those described for Fig. 1. Bile and urine were collected over 90 min after administration of AA (1 mmol/kg i.v.). Values are the percentage of the total amount of metabolite excreted into bile and urine over 90 min.
Treatment with the microsomal inducers studied decreased the biliary excretion and increased the urinary excretion of AA metabolites. Pretreatment with PB, DAS, OLT, and TSO decreased the percentage of AA-GLUC excreted into bile from 78% in control rats to 30%, 15%, 12%, and 9%, respectively, and correspondingly increased the urinary excretion of AA-GLUC from 22% in control rats to 70 to 91% in treated rats. A similar, but less dramatic shift in excretion occurred for AA-SULF in inducer-exposed animals. In PB-, DAS-, OLT-, and TSO-pretreated animals, the amount of AA-SULF excreted into bile decreased from 20% in control bile to <9% in bile from inducer-treated rats, and the amount of AA-SULF in urine increased from 80% in control rat urine to >91% in urine from inducer-treated rats. Pretreatment with DAS, OLT, and TSO also appeared to decrease the relative amount of AA-GSH excreted into bile. The relative amount of AA-GSH and its degradation product, AA-NAC, excreted in control rats was 93% into bile and 7% into urine. However, it was decreased to <70% in bile from controls and increased to >30% in urine for DAS-, OLT-, and TSO-treated animals.
In control rats, the cumulative amount of AA and AA metabolites excreted into bile or urine over 90 min was nearly equivalent. However, in DAS-, OLT-, and TSO-pretreated animals, the excretion of AA and its metabolites was shifted primarily to urinary excretion. Hence, treatment with DAS, OLT, and TSO markedly shifted the route of excretion for AA-GLUC and, to a lesser extent, AA-GSH, from being predominantly biliary to predominantly urinary.
Analysis of Mrp2 and Mrp3 Protein Expression in Liver following Treatment with TSO, OLT, DAS, and PB. The Mrp3 antibodies were characterized (Fig. 4) to ensure that they detected changes in Mrp3 similar to those described in previous publications (Ogawa et al., 2000; Donner and Keppler, 2001). The Mrp3 antibodies generated detected two protein products that are approximately 185 kDa in molecular mass and were inducible by both PB and bile duct ligation (Fig. 4). The two major bands likely represent diffentially glycosylated forms of Mrp3 as described by Scheffer et al. (2002). Peptide competition abrogated the observed antibody binding, which suggests that antibodies are specific to the peptide sequence and recognize rat Mrp3.

Characterization of antibodies generated against rat Mrp3.
Antibodies against rat Mrp3 were generated in male New Zealand rabbits against an Mrp3-specific peptide linked to keyhole limpet hemocyanin. Liver membrane fractions from control, phenobarbital (PB), or bile duct-ligated rats (4 days post ligation; BDL) were resolved by SDS-PAGE and analyzed by Western blot analysis with either Mrp3 antibodies (A) or Mrp3 antibodies and peptide (B).
To determine whether TSO-, OLT-, and DAS-induced alterations in AA metabolite excretion could be due to changes in Mrp expression, liver membrane fractions from animals treated with these microsomal inducers were analyzed by Western analysis with anti-human Mrp2 antibodies that cross-react with rat Mrp2 protein (Fig. 5). With this method, the molecular mass of Mrp2 protein was approximately 190 to 200 kDa. Mrp2 was undetectable in membrane preparations from EHBR livers, and was increased in liver membrane fractions from pregnenolone-16α-carbonitrile-treated rats. Mrp2 protein was detected in liver membranes from control animals and were significantly increased approximately 200% in livers from animals pretreated with DAS, OLT, and TSO (Fig. 5). Levels of membrane-associated Mrp2 tended to increase after PB treatment, but this increase was not statistically significant.

Effect of PB, DAS, OLT, or TSO pretreatment on Mrp2 protein levels in liver.
A, representative Western blot of liver crude membrane fractions from PB-, DAS-, OLT-, and TSO-treated animals stained with antibodies that detect rat Mrp2 (40 μg protein/lane). B, quantification of Mrp2 protein levels in liver crude membrane fractions after treatment with PB, DAS, OLT, or TSO (n = 5–6/treatment group). Bars represent mean ± S.E.M. and asterisks (*) represent a statistical difference from control (p ≤ 0.05).
More importantly, changes in liver Mrp3 protein expression were assessed because Mrp3 transports organic anions from the hepatocyte into blood. Analysis of liver membranes from inducer-treated animals using Mrp3 antibodies revealed that basal Mrp3 protein levels were low, yet still detectable in control liver membranes, and that PB, DAS, OLT, and TSO pretreatments significantly increased the level of membrane-associated Mrp3 protein in liver (Fig. 6). DAS, OLT, and TSO were the most effective inducers of Mrp3 protein and increased Mrp3 levels by approximately 500% over controls. To a lesser extent, PB increased hepatic Mrp3 protein levels by 100%. A second band at approximately 90 kDa was also detected by anti-Mrp3 and was induced in a manner similar to that of the band that migrated to 185 kDa, that is assumed to be Mrp3 (Fig. 6). This band may be a partial protein product that is an Mrp3 degradation product or a protein product from a related gene. Other Mrp3 antibodies in a previous publication by Ogawa et al. (2000) also detect a protein of similar size that is also induced by PB and bile duct ligation.

Effect of PB, DAS, OLT, or TSO pretreatment on Mrp3 protein levels in liver.
A, representative Western blot of liver crude membrane fractions from PB-, DAS-, OLT-, and TSO-treated animals stained with anti-Mrp3 (40 μg protein/lane). B, quantification of Mrp3 protein levels in liver crude membrane fractions after treatment with PB, DAS, OLT, or TSO (n = 5–6/treatment group). Bars represent mean ± S.E.M. and asterisks (*) represent a statistical difference from control (p ≤ 0.05).
Analysis of Mrp2 and Mrp3 Protein Expression in Kidney following Treatment with TSO, OLT, DAS, and PB. Mrp2 and Mrp3 mRNA and protein have been detected in kidney (Lee et al., 2001; Cherrington et al., 2002; Scheffer et al., 2002). Because the inducers increased the urinary excretion of AA-GLUC and AA-NAC, the expression levels of Mrp2 and Mrp3 in kidney were examined (Fig. 7). In kidney, Mrp2 protein migrated to approximately 190 kDa and Mrp3 migrated to approximately 185 kDa, and both were barely detectable. Levels of both Mrp2 and Mrp3 were apparently unchanged by PB, DAS, and OLT treatment.

Effect of PB, DAS, OLT, or TSO pretreatment on Mrp2 and Mrp3 protein levels in kidney.
Western blots of kidney crude membrane fractions from PB-, DAS-, OLT-, and TSO-treated animals stained with antibodies that detect rat Mrp2 (top) or rat Mrp3 (bottom) (60 μg protein/lane).
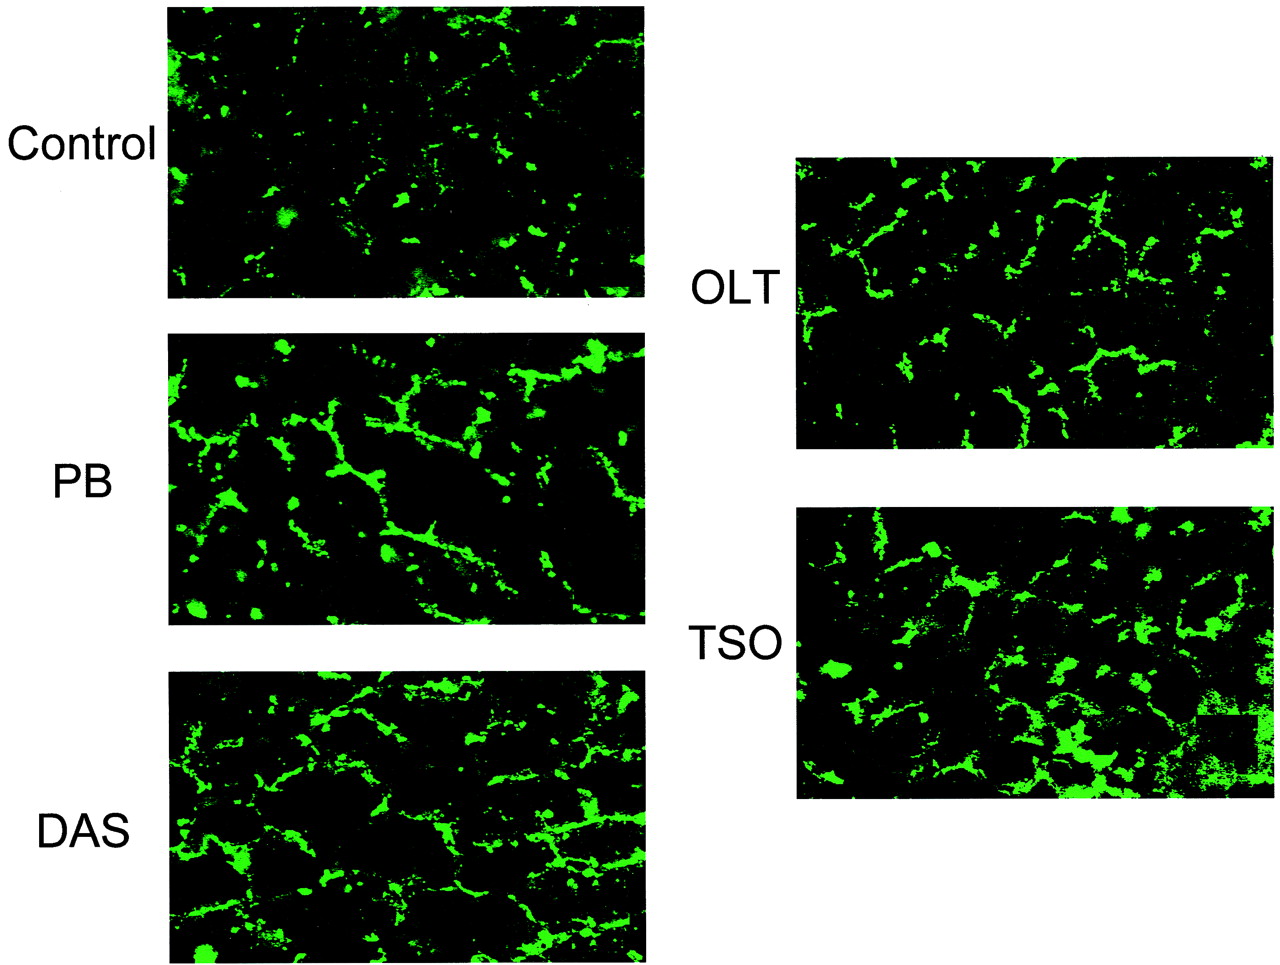
Immunohistochemical Determination of Liver Mrp2 and Mrp3 Levels following Treatment with TSO, OLT, DAS, and PB. To confirm that treatment with the microsomal enzyme inducers increased Mrp2 and Mrp3 protein levels in the canalicular and basolateral membranes, respectively, immunohistochemical analysis was performed on livers from animals treated with the microsomal inducers (Figs. 8 and 9). Staining with anti-rat Mrp2 (EAG15) was consistent with previous reports (Buchler et al., 1996; Johnson et al., 2002) and with staining localized to the hepatocellular canalicular membranes. However, because the Mrp2 staining was somewhat diffuse, we cannot rule out that some of the staining was localized to subcanalicular vesicles, because it has been published that Mrp2 undergoes endocytic retrieval to subcanalicular vesicles, which is associated with diffuse Mrp2 staining. Mrp2 staining was detected in control liver and was increased in all of the inducer-exposed livers (Fig. 8). Also consistent with other publications, Mrp3 was detected at low levels in control liver with staining that was localized to the basolateral membranes of hepatocytes (Donner and Keppler, 2001; Soroka et al., 2001). The staining for Mrp3 was localized around the perimeter of the hepatocyte, unlike the staining for Mrp2, which has a more “branchlike” appearance. Consistent with the Western analysis in Fig. 6, OLT and TSO pretreatments most effectively increased basolateral Mrp3 staining, with PB and DAS induction being less dramatic (Fig. 9).

Immunohistochemical detection of Mrp2 in liver following PB, DAS, OLT, or TSO administration.
Photomicrographs depict fluorescent immunohistochemical localization of Mrp2 in liver. Cryosections (4–5 μm) from livers of control (A)-, PB (B)-, DAS (C)-, OLT (D)-, or TSO (E)-pretreated rats were stained with Mrp2 antibodies diluted 1:50, followed by incubation with FITC-conjugated anti-rabbit IgG. Original magnification, 630×.

Immunohistochemical detection of Mrp3 in liver following PB, DAS, OLT, or TSO administration.
Photomicrographs depict fluorescent immunohistochemical localization of Mrp3 in liver. Cryosections (4–5 μm) of livers from control (A)-, PB (B)-, DAS (C)-, OLT (D)-, or TSO (E)-pretreated rats were stained with Mrp3 antibodies diluted 1:40 followed by incubation with FITC-conjugated anti-rabbit IgG. (Original magnification, 630×.)
Analysis of Mrp1–6 mRNA Levels in Liver following Treatment with TSO, OLT, DAS, and PB. To determine whether the increased excretion of AA-GLUC into plasma by the microsomal enzyme inducers was related to changes in gene expression of membrane-associated proteins in liver responsible for the transport of conjugated drugs into bile and blood, mRNA levels for Mrp family members in liver were measured using the bDNA assay (Fig. 10). Hepatic Mrp levels were not significantly different among the several vehicle-treated control groups, and therefore, the data for each gene from the control groups were pooled. Importantly, treatment with the inducers significantly increased hepatic levels of Mrp3. DAS, TSO, and OLT treatments massively increased Mrp3 mRNA levels by 23-, 27-, and 37-fold, respectively (Fig. 10). PB treatment also increased Mrp3 mRNA levels in liver by 13-fold. In addition, DAS and PB treatment had no effect on Mrp2 mRNA levels in liver, but TSO and OLT treatments increased Mrp2 mRNA by approximately 100% (Fig. 10). The hepatic expression of other Mrp family members after inducer treatment was also assessed (Fig. 10). Mrp1 levels were not induced by any of the treatments, and it appeared that DAS treatment decreased Mrp1 expression. Mrp4 was also induced by the treatments to approximately 150 to 300% of control. Hepatic Mrp5 and Mrp6 expression was not altered by treatment with the inducers.

Effect of PB, DAS, OLT, or TSO treatment on Mrp2 and Mrp3 mRNA levels in liver.
Total RNA was isolated from liver of rats pretreated with PB, DAS, OLT, or TSO and analyzed by the bDNA assay for Mrp1, Mrp2, Mrp3, Mrp4, Mrp5, or Mrp6 mRNA expression. The data are presented as mean RLU ± S.E.M. (n = 4–6 animals). Asterisks (*) represent a statistical difference (p ≤ 0.05) from control.
Analysis of Mrp1–6 mRNA Levels in Kidney following Treatment with TSO, OLT, DAS, and PB. To determine whether the observed increase in urinary excretion of AA-GLUC into plasma by the microsomal enzyme inducers was related to changes in gene expression of membrane-associated proteins in kidney responsible for the transport of conjugated drugs into bile and blood, mRNA levels for Mrp family members in kidney were measured using the bDNA assay (Fig. 11). Renal Mrp levels were not different among the several vehicle-treated control groups, and therefore, the data for each gene from the control groups were pooled. For the most part, there was little to no induction of Mrps in kidney. DAS did slightly induce Mrp2 and Mrp3, but only to 150% of control levels. Also, DAS treatment increased Mrp4 mRNA levels in kidney to approximately 200% of control levels. Mrp1, Mrp5, and Mrp6 were not induced by any of the inducer treatments.

Effect of PB, DAS, OLT, or TSO treatment on Mrp2 and Mrp3 mRNA levels in kidney.
Total RNA was isolated from kidney of rats pretreated with PB, DAS, OLT, or TSO and analyzed by the bDNA assay for Mrp1, Mrp2, Mrp3, Mrp4, Mrp5, or Mrp6 expression. The data are presented as mean RLU ± S.E.M. (n = 4–6 animals). Asterisks (*) represent a statistical difference (p ≤ 0.05) from control.
Discussion
Previous findings have documented that pretreatment with PB impairs the biliary excretion of AA-GLUC and shifts its excretion from being predominantly biliary to predominantly urinary (Brouwer and Jones, 1990; Gregus et al., 1990). The data presented in this study are consistent with a recent publication that documents impaired biliary excretion of AA-GLUC by phenobarbital pretreatment with the induction of the sinusoidal organic anion transporter Mrp3 (Xiong et al., 2002a). Furthermore, the present study extends the observation of decreased biliary excretion of AA-GLUC and AA-SULF with pretreatment of two other microsomal enzyme inducers, DAS and OLT, and associates this change in drug excretion with induction of Mrp3 protein in liver.
Under naive conditions, AA-GLUC and AA-GSH are predominantly excreted into bile, whereas AA-SULF is predominantly excreted into urine (Brouwer and Jones, 1990; Gregus et al., 1990). However, the normal vectorial route of excretion for these metabolites was changed by pretreatment with the inducers. The most apparent shift in excretion for inducer-pretreated rats was that observed for AA-GLUC. To a lesser degree, AA-GSH excretion also shifted in inducer-treated rats. All of the inducers significantly increased the urinary excretion of AA-NAC.
The inducers also decreased biliary excretion of AA-SULF. DAS, OLT, and TSO decreased AA-SULF excretion into bile more effectively than did PB. The shift from biliary excretion to urinary excretion for AA-SULF in inducer-pretreated rats was not as apparent as that observed for AA-GLUC. This less dramatic shift in excretion is probably because the transport mechanism for excretion of AA-SULF out of the liver and into blood has a higher capacity or affinity for AA-SULF transport than into bile.
The decreased biliary excretion of AA metabolites is likely not due to decreased levels/activity of UDP-glucuronsyl transferases, sulfotransferases, or glutathione S-transferase (GST) responsible for AA metabolite formation. PB does not alter UDP-glucuronsyl transferase isoforms responsible for conjugation of AA, and instead, OLT, TSO, and DAS pretreatments appear to induce glucuronosyl transferase activity (Kuo et al., 1981; Fuhrman-Lane and Fujimoto, 1982; Guyonnet et al., 1999; Kessler et al., 2002). Additionally, sulfotransferases are relatively unaltered by microsomal enzyme inducers (Thompson et al., 1982). Furthermore, TSO, DAS, and OLT are also reported to increase GST levels in liver (Thompson et al., 1982; Thabrew and Emerole, 1983; Gregus et al., 1985; Guyonnet et al., 1999; Ramos-Gomez et al., 2001). PB pretreatment increased the amount of AA-GSH excreted into bile, which was consistent with Gregus et al. (1990). This may occur because PB pretreatment increases AA bioactivation (Mitchell et al., 1973) and induces GSTA1/A2 in liver (Selim et al., 2000). Thus, the inducers most likely increase biotransformation of AA, and the observed decrease in biliary excretion of AA metabolites is not due to decreased biotransformation of AA.
Excretion of organic anions into the bile occurs via transporters localized to the apical membrane of the hepatocyte (i.e., Mrp2), and efflux of organic anions into blood occurs via transport across the sinusoidal membrane of the hepatocyte into blood (i.e., Mrp1 and Mrp3). AA-GLUC and AA-SULF excretion into bile was decreased in isolated perfused livers from GY/TR- rats (Xiong et al., 2000), indicating that AA-GLUC and AA-SULF are substrates for Mrp2. Because Mrp3 protein levels are significantly increased in livers of GY/TR- rats as compared with levels in livers from Wistar controls, increased AA-GLUC sinusoidal efflux was associated with increased Mrp3 levels (Xiong et al., 2002a). Furthermore, Mrp3 can transport AA-GLUC (Xiong et al., 2002a). Thus, compounds that induce Mrp3 protein expression in liver will increase sinusoidal efflux of AA-GLUC and will most likely affect the sinusoidal efflux of AA-GSH.
Based on the data from the present study, the likely explanation for the shift in excretion of AA-GLUC and AA-GSH from bile to blood after treatment with microsomal enzyme inducers is induction of Mrp3 mRNA and protein, although Mrp2 protein levels also were also induced by DAS, TSO, and OLT. The relatively much greater induction of hepatic Mrp3 as compared with hepatic Mrp2 seems to be important for the change in vectorial excretion of AA metabolites. Xiong et al. (2002a) have demonstrated that AA-GLUC has a higher affinity for Mrp3 than for Mrp2. Thus, under naive conditions, there is relatively much more Mrp2 present in the liver than Mrp3, and APAP metabolites are subsequently excreted into bile. However, under conditions where amounts of liver Mrp2 and Mrp3 are relatively equal, or with Mrp3 higher than Mrp2, there may be competition between the two transporters for export of the metabolites, causing a smaller portion of the metabolite to be excreted into bile. The massive increase in Mrp3 protein expression and higher affinity of Mrp3 than Mrp2 for AA-GLUC is likely the cause for the changed vectorial excretion of AA-GLUC. The affinity of Mrp2 and Mrp3 for AA-GSH remains to be determined, although biliary AA-GSH excretion is impaired in GY/TR- rats (Dr. Jose Manautou, personal communication), indicating that AA-GSH is a substrate for Mrp2 and suggesting that it is also a substrate for Mrp3. Moreover, Mrp1 mRNA levels in liver were unaltered by inducer treatment (data not shown). The amount of Mrp3 induction correlated well with the increased plasma levels of AA-GLUC, urinary excretion of AA-GLUC and AA-NAC, and the ability of the compound to shift the vectorial excretion of AA-GLUC and AA-GSH in inducer-treated rats. These data agree with a recent publication by Xiong et al. (2002a) that correlates liver Mrp3 levels with basolateral clearance of AA-GLUC.
The increased urinary excretion of AA-GLUC and AA-NAC is likely due to increased plasma levels of AA-GLUC and AA-GSH derived from the liver and not due to an increase in renal excretion of these metabolites. Cherrington et al. (2002) demonstrated that treatment with PB, DAS, and OLT does not induce Mrp2 or Mrp3 mRNA levels in kidney. The data in Figs. 6 and 10 agree with these findings and also demonstrate that these treatments do not significantly increase Mrp2 or Mrp3 protein levels in kidney. Because the urine levels of AA-GLUC and AA-NAC were significantly increased by all of the inducers, increased renal expression of Mrp2 protein does not explain the corresponding increase in plasma AA-GLUC. Instead, the increased urinary excretion of APAP-GLUC can be explained by the massive induction of Mrp3 in liver, which was associated with increased plasma levels of APAP-GLUC. Because the inducers did not increase renal levels of Mrp3, the increased plasma levels of APAP-GLUC are not due to increased Mrp3 levels in kidney that could export APAP-GLUC back into the blood. Taken together, these data indicate that the observed increase in urinary excretion of APAP metabolites is not due to increased renal expression of Mrps that could aid in the excretion of APAP metabolites. Instead, the increased urinary excretion of APAP-GLUC and APAP-NAC appears to be related to the induction of Mrp3 in liver, which can then efflux a greater portion of APAP metabolite back into blood from the hepatocyte instead of into bile.
Aside from Mrps, organic anion polypeptide transport proteins (Oatps) can also transport organic anions, such as glucuronide conjugates (Noe et al., 1997), and alterations in liver or kidney Oatp levels may effect AA-GLUC disposition. However, Oatps are generally thought to be uptake transporters that are responsible for the extraction of organic anions from the blood. Induction of Oatp2, but not Oatp1, protein expression in liver is associated with increased levels of Oatp2 substrates in liver (Staudinger et al., 2001) and is associated with decreased blood levels of Oatp2 substrates due to an increase in hepatic uptake (Klaassen, 1972). Because there are no published data on Oatp induction in kidney, it is difficult to speculate whether or not altered renal Oatp levels in kidney contribute to the observed increase in urine levels of AA-GLUC and AA-NAC. Thus, we suspect that induction of Mrp3 in liver and not kidney is responsible for increased AA-GLUC levels in plasma and the corresponding increase in AA-GLUC and AA-NAC levels in urine after treatment with PB, DAS, OLT, and TSO.
For Mrp3, the observed increase in protein caused by all of the compounds was associated with increased hepatic Mrp3 mRNA levels. All of the compounds dramatically induced Mrp3 mRNA levels in liver by at least 13-fold. This suggests that these compounds increase Mrp3 protein levels in liver through enhancing Mrp3 gene transcription. The amount of hepatic Mrp3 protein induction was lower and ranged from 2- to 5-fold above control levels. The difference in levels of mRNA induction and protein induction may be due to differences in the rate of gene transcription and translation for Mrp3, with translation being the rate-limiting step in Mrp3 induction. At the present time, the mechanism by which these compounds regulate Mrp3 gene transcription is not known, but it has been suggested to be mediated through the constitutive androstane receptor (CAR) and activation of the transcription factor nuclear factor-E2-related factor 2 (nrf2) (Cherrington et al., 2002). However, recent studies using Wistar-Kyoto rats that are sexually dimorphic in liver CAR expression and Cyp2B1/2 induction by PB have demonstrated that PB induction of Mrp3 is CAR-independent (Xiong et al., 2002b). Although OLT also induces Cyp2B1/2 mRNA in liver (Langouet et al., 1997), OLT is more commonly studied because it induces NAD(P)H: quinone reductase and glutathione S-transferases by transcriptional activation of antioxidant response element/electrophile response elements via nrf2 (Ramos-Gomez et al., 2001). Thus, it is possible that the observed increase in Mrp3 mRNA in liver by OLT is related to activation of nrf2 and that Mrp3 gene expression can be regulated via nrf2.
In summary, we report that the microsomal enzyme inducers DAS and OLT alter the vectorial route of excretion for AA-GLUC and AA-GSH along with PB and TSO. This altered excretion was associated with significant induction of Mrp3 protein, a protein previously demonstrated to transport AA-GLUC. Importantly, they suggest that induction of Mrp3 can affect the excretion of drugs that are metabolized to glucuronide and glutathione conjugates.
Acknowledgments
We thank Yaping Liu for valuable assistance with bile duct and carotid artery cannulations; David Buckley, Mindy Shelby, Susan Buist, and Drs. Tyra Leazer, Terrilyn Couch, and Chuan Chen for technical assistance with blood and bile collections; and Dr. Michael Werle for assistance with the confocal microscopy.
Footnotes
-
↵2 Abbreviations used are: AA, acetaminophen; AA-GLUC, acetaminophen-glucuronide; AA-SULF, acetaminophen-sulfate; AA-GSH, acetaminophen-glutathione; AA-NAC, acetaminophen-N-acetyl-l-cysteine (mercapturate); PB, phenobarbital; TSO, trans-stilbene oxide; Mrp2, multiple drug resistance protein 2; Mrp3, multiple drug resistance protein 3; EHBR, Eisai hyperbilirubinemic rat; GY/TR-, Groningen-Yellow transport-deficient rat; DAS, diallyl sulfide; OLT, oltipraz; HPLC, high performance liquid chromatography; RLU, relative light unit(s); PAGE, polyacrylamide; TBS, Tris-buffered saline; TBS-T, TBS/Tween 20; FITC, fluorescein isothiocyanate; bDNA, branched DNA signal amplification; GST, glutathione S-transferase; Oatp, organic anion polypeptide transport protein; CAR, constitutive androstane receptor; nrf2, nuclear factor-E2-related factor 2.
-
Financial support for this research was provided by National Institutes Health Grants ES-09716, ES-07079, and ES-11239. A.L.S. was supported National Institutes of Health Grant ES-011239-01. This work was presented in at the annual Society of Toxicology meeting, 2002 March 18–21.
-
↵1 Present address: Department of Pharmacology and Toxicology, PO Box 210207, 1703 E. Mabel St., Tucson, AZ 85721-0207.
- Received November 14, 2002.
- Accepted June 6, 2003.
- The American Society for Pharmacology and Experimental Therapeutics


