


Abstract
It is a commonly accepted hypothesis that central nervous system (CNS) activity is determined by the unbound brain drug concentration. However, limited experimental data are available in the literature to support this hypothesis. The objective of this study was to test this hypothesis by examining the relationship between in vitro binding affinity (KI) and in vivo activity quantified as the drug concentration occupying 50% of the transporters (OC50) for 18 serotonin (SERT) and dopamine transporter (DAT) inhibitors. In vivo rat OC50 was determined by autoradiography using [3H]N,N-dimethyl-2,2-amino-4-cyanophenylthiobenzylamine and [3H](–)-2-β-carbomethoxy-3-β-(4-fluorophenyl)tropane-1,5-napthalenedisulfonate (WIN35,428) as the ligands to assess SERT and DAT occupancy, respectively. The unbound brain concentrations were calculated from total brain concentrations and the unbound brain fraction, which was determined by the brain homogenate method. The in vivo total brain SERT and DAT OC50 values (mean ± S.D.) were 408 ± 368- and 410 ± 395-fold greater than the KI values, respectively. In contrast, the in vivo unbound brain SERT and DAT OC50 values were only 3.3 ± 2.1- and 4.1 ± 4.0-fold different from the KI values. Therefore, prediction of the biophase drug concentration by using the unbound brain concentration rather than the total brain concentration results in an approximately 100-fold improvement for the accuracy. In the present study, a 10-fold improvement was also observed by using the unbound plasma concentration rather than the total plasma concentration to predict the biophase concentration in the brain. This study supports the hypothesis that CNS activity is more accurately determined by the unbound brain drug concentration and not by the total brain drug concentration.
It is a commonly accepted hypothesis that the free or unbound drug concentration is the species available for interaction with drug targets in the body. This hypothesis is referred to as the “free drug hypothesis” in traditional pharmacokinetics (Wilkinson, 2001). As an extension of this hypothesis for drug targets that are localized in the brain tissue, it has been commonly assumed that unbound drug molecules in brain interstitial spaces are directly in contact with the drug receptors. Thus, the unbound concentration represents the drug concentration at the site of action or so-called biophase. This brain free drug hypothesis has been applied in preclinical and clinical pharmacokinetic/pharmacodynamic studies. For example, in preclinical CNS drug discovery, to prove the mechanism of action or to validate an animal behavior model, it is necessary to demonstrate the correlation between the affinity of drug to the target (e.g., KI), determined from in vitro pharmacology assays and the in vivo efficacious drug concentration (e.g., EC50) at the site of action. In phase I clinical trials for CNS drugs, it is important to determine whether the estimated unbound brain concentration is sufficiently high compared with the drug's KI so the efficacy and safety can be adequately evaluated and demonstrated in phase II trials.
The total brain tissue concentration is composed of the unbound drug in the interstitial and intracellular space and the drug bound to proteins and phospholipids. Therefore, total brain concentration does not represent the drug concentration at the biophase. Although the scientific rationale for the free drug hypothesis is very strong, there are limited data in the literature to actually prove that the unbound brain concentration, not the total brain tissue concentration, determines CNS activity (Cox et al., 1998; Kalvass et al., 2007b; Watson et al., 2009). Because of the lack of extensive well documented data in the literature and the lack of understanding of novel drug targets in most drug discovery and development programs, sometimes it is debatable whether the unbound brain concentration or the total brain concentration determines in vivo activity. In particular, when in vivo activity does not correlate with in vitro potency in a pharmacological model for a series of compounds, one may question the proposed mechanism of action or the appropriateness of the in vitro assay or the animal model or may wonder whether the total brain concentration, not the unbound brain concentration, governs the in vivo activity.
One of the reasons for the lack of data in the literature is the difficulty in accurately measuring both the pharmacological activity of CNS targets and brain free concentrations. In the last few years, the brain homogenate method has been validated as a surrogate for brain unbound drug concentrations (Kalvass and Maurer, 2002; Maurer et al., 2005; Becker and Liu, 2006; Liu et al., 2006, 2009; Summerfield et al., 2006, 2007, 2008; Fridén et al., 2007; Kalvass et al., 2007a). This method can be used to rapidly determine brain unbound concentration and to test the free drug hypothesis for multiple compounds.
The present study was designed to test the free drug hypothesis by investigating the correlation of in vitro and in vivo activities of 18 compounds for two pharmacological targets. We examined the relationship between receptor occupancy, unbound and total brain concentrations, and unbound and total plasma concentrations for 18 serotonin reuptake transporter (SERT) and dopamine reuptake transporter (DAT) inhibitors. SERT and DAT are monoamine transporters that belong to the solute carrier gene family and are localized to perisynaptic sites of neuron synaptic terminals, where they are crucial for the termination of signal transmission and the maintenance of presynaptic monoamine storage (Torres et al., 2003). Antidepressants act on these transporters via competitive interaction and inhibit the reuptake of neurotransmitters into presynaptic sites (Apparsundaram et al., 2008). Receptor occupancy of SERT and DAT was used as a surrogate biomarker for CNS activity. The KI was determined with expressed human SERT and DAT proteins. The in vivo receptor occupancy for SERT and DAT was determined in rats using trace amounts of radiolabeled transporter substrates.
Materials and Methods
Chemicals. Bupropion, citalopram, cocaine, GBR 12909, GBR 12935, nomifensine, and venlafaxine were obtained from Sigma-Aldrich (St. Louis, MO). Indatraline was obtained from Tocris Bioscience (Ellisville, MO). [3H]WIN35,428 and [3H]citalopram were obtained from PerkinElmer Life and Analytical Sciences (Waltham, MA). Thirteen Roche proprietary compounds (compounds 1–13), duloxetine, NS2359, and [3H]DASB were synthesized at Roche Palo Alto, LLC (Palo Alto, CA) with purity greater than 98%. All other chemicals used in the experiments were of the highest available grade.
In Vitro Binding. Radioligand binding studies were conducted in assay buffer (126 mM NaCl, 2.7 mM KCl, 10 mM Na2HPO4, and 1.76 mM KH2PO4, pH 7.4). [3H]Citalopram and [3H]WIN35,428 were used as radioligands for SERT and DAT assays, respectively. The equilibrium dissociation constant or KI of test compounds for human SERT and human DAT was determined using the scintillation proximity assay (Bosworth and Towers, 1989). In brief, the membrane homogenate of human SERT or human DAT stably expressing HEK 293 cells was mixed with wheat germ agglutinin-coated scintillation proximity assay beads (GE Healthcare, Little Chalfont, Buckinghamshire, UK). The membrane-bead mixture, radioligand, and test compound were incubated for 2 h at room temperature. Nonspecific binding was determined using 10 μM indatraline. The bound radioactivity was determined using a Packard TopCount scintillation counter (PerkinElmer Life and Analytical Sciences).
KI values of test compounds for rat SERT and rat DAT were determined using rat cortical and rat striatal synaptosomal membranes as described previously (Apparsundaram et al., 2008). In brief, rat brain cortices or striata were isolated and homogenized to obtain crude synaptosomal fractions. For rat SERT and rat DAT binding assays, 40 μg in 0.2 ml of cortical membrane and 20 μg in 0.2 ml of striatal membrane in 96-well plates were used. Membrane, radioligand, and test compounds were incubated for 2 h at room temperature with constant shaking. Reactions were terminated by rapid filtration onto 0.5% polyethyleneimine-treated GF/B filter plates (PerkinElmer Life and Analytical Sciences). Filters were washed three times with ice-cold 15 mM HEPES (pH 7.4) buffer. The bound radioactivity was determined using a Packard TopCount scintillation counter. Nonspecific binding of [3H]citalopram and [3H]WIN35,428 was determined via addition of 10 μM indatraline.
In competition binding assays for determining OC50 (also known as IC50) values for test compounds, [3H]citalopram and [3H]WIN35,428, were used at 2 and 10 nM, respectively. The OC50 was determined for each unlabeled test compound over a range of five to eight different radioligand concentrations. The OC50 represents the drug concentration that can displace 50% of the radiolabeled ligand and was determined using the Hill equation (eq. 1):  where C is the concentration of test compound and γ is the Hill constant. Each compound was tested at 10 concentrations over a 6-log concentration range in duplicate in at least two independent experiments. KI values for test compounds were calculated using the Cheng-Prusoff equation (Cheng and Prusoff, 1973). For the determination of equilibrium dissociation constants for the radioligands (Kd), [3H]citalopram and [3H]WIN35,428 were used over the concentration range of 0.22 to 70 nM and 5 to 150 nM, respectively.
In Vivo Occupancy. Male Long-Evans rats (200–350 g; Charles River Laboratories, Inc., Wilmington, MA) were given an intraperitoneal dose of either vehicle (5 mg/ml hypromellose, 4 mg/ml Polysorbate-80, 9 mg/ml benzyl alcohol, 0.4 mg/ml citric acid monohydrate, and 2.4 mg/ml sodium citrate, pH 6.0) or a test compound (0.1–30 mg/kg). At 30 min after the administration of the test compound, 400 μCi/kg [3H]DASB or 160 μCi/kg [3H]WIN35,428 was administered intravenously via the tail vein for SERT or DAT labeling, respectively. Sixty minutes after radiotracer administration, rats were euthanized using CO2 asphyxiation. Blood was collected and centrifuged for plasma. Brains were quickly removed and frozen on dry ice. Brains and plasma were stored at –80°C before analyses.
Coronal rat brain tissue sections (12-μm thick) were taken at a brain level containing striatum, nucleus accumbens, and olfactory tubercles (bregma +1.00 mm) and cerebellum (bregma –12.80 mm) (Paxinos and Watson, 1998) using a Leica CM3050 cryostat (Leica Microsystems Inc., Deerfield, IL). Tissues were thaw-mounted onto Superfrost Plus microscope slides (VWR, West Chester, PA) and analyzed for 8 h at a high-resolution setting.
Bound [3H]DASB and [3H]WIN35,428 in rat brain were quantified by counting the number of beta particles emerging from a manually delineated region of interest using Betavision software (Biospace, Paris, France). For quantification of SERT labeling, a sampling tool was used to outline the area containing striatum, nucleus accumbens, and olfactory tubercles. For quantification of DAT labeling, the sampling tool was used to outline the striatum. For each rat, the average binding density was calculated from four consecutive tissue sections and expressed as the sum of the counts in the specified brain region over an 8-h detection period (counts per square millimeter). Nonspecific binding of both [3H]DASB and [3H]WIN35,428 was defined as the mean binding density measured in the cerebellum.
Receptor occupancy was calculated for each rat using eq. 2 (van Waarde, 2000). The plasma and brain OC50 values were calculated with eqs. 6 and 8, respectively, using GraphPad Prism 4 software (GraphPad Software Inc., San Diego, CA).  where S/N = [mean striatum (counts per square millimeter)]/[mean cerebellum (counts per square millimeter)].
Protein Binding. The in vitro unbound fraction in brain homogenate and plasma for each compound was determined using a 48-well rapid equilibrium dialysis device (Linden Bioscience, Woburn, MA). Brain tissue was homogenized in 2 volumes (w/v) of 0.9% saline. Brain homogenate or plasma was spiked with a compound for the final concentration of 1000 ng/ml, and 200 μl of the matrix was added to the donor side of a dialysis chamber. The receiver side contained 350 μl of the buffer. The dialysis apparatus was maintained on a shaking device at 37°C for 4 h.
Sample Analysis. The brain tissues of each rat were homogenized in 2 volumes (w/v) of 0.9% saline, and 50 μl of brain homogenate or plasma and 200 μl of internal standard in acetonitrile were mixed in 96-well polypropylene plates. The acetonitrile mixtures were vortexed and then centrifuged at 1800g for 10 to 15 min. Aliquots of the supernatant were transferred to a 96-well plate and diluted with an equal aliquot of water before analysis by high-performance liquid chromatography (HPLC) combined with tandem mass spectrometry.

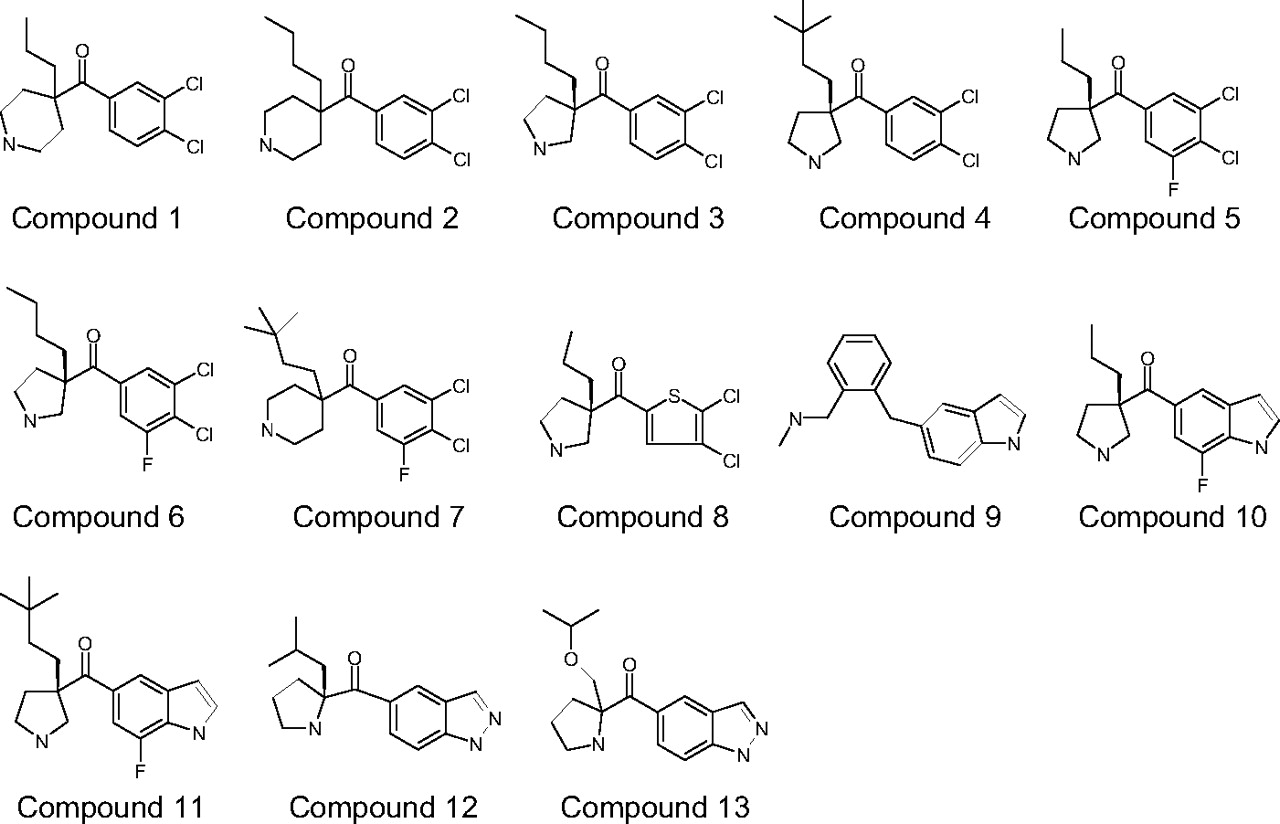
Structures of compounds 1 to 13. Structures for compounds 3, 4, 5, 6, 8, 10, 11, and 12 represent the presumed relative stereochemistry.
All samples were analyzed on a standard curve prepared by spiking a known amount of compound into a blank matrix and then processing according to a procedure described previously for each matrix. The HPLC-tandem mass spectrometry system consisted of either a Shimadzu LC-10A ternary pump (Shimadzu, Kyoto, Japan) or an Agilent quaternary pump HPLC system (Hewlett Packard, Palo Alto, CA), an HTS-PAL autosampler (LEAP Technologies, Carrboro, NC), and a PE Sciex API 4000 (PerkinElmerSciex Instruments, Waltham, MA) mass spectrometer with a turbo ion spray interface (PerkinElmerSciex Instruments). A 10-μl aliquot of each sample was injected onto a reverse-phase C18 column. The concentration of samples was within the linear range of quantitation for all assays. The low limit of quantitation for all compounds was 0.5 to 2 ng/ml for plasma and 1.5 to 6 ng/g for brain. The assay accuracy was between 80 and 120%.
Occupancy Theorem and Data Analysis. Under the assumption that inhibitors and labeling ligand competitively bind to the available sites of SERT or DAT, eq. 3 can be derived:  where KI is the equilibrium dissociation rate constant of the drug, Kd is the equilibrium dissociation rate of the radiolabeled ligand, C is the drug concentration that interacts with SERT or DAT, and γ is the Hill constant.
For the in vitro binding assay, eq. 4 can be derived from eq. 3 and is used to calculate the KI:  [3H]Citalopram and [3H]WIN35428 were used for SERT and DAT, respectively. The human Kd values for citalopram and WIN35,428 were 2.2 ± 0.28 and 11.6 ± 0.4 nM, respectively. The rat Kd values for S-citalopram and WIN35,428 were 0.84 ± 0.09 and 21.0 ± 2.0 nM, respectively.
For the in vivo receptor occupancy assay, because only a trace amount of ligand was administered, the ligand concentration was much less than its Kd. Therefore, eq. 3 can be simplified to the Hill equation, by assuming that the effects of endogenous ligands on the drug binding to the transporter are negligible:  where C represents the drug concentration at the biophase that interacts with the targets, Cu, brain represents the unbound brain concentration, and Cu, brain, 50 represents the unbound brain concentration that occupies 50% of the receptor. Under the free drug hypothesis, Cu, brain = C, and OCu, brain, 50 = KI.
If total brain concentrations are used and because Cu, brain = Cbrain · fu, brain, eq. 6 can be obtained from eq. 5:  where Cbrain is the total brain concentration and fu, brain is the unbound fraction in brain tissue and OCbrain, 50 = KI/fu, brain. If unbound plasma concentrations are used and because Cu,plasma = Cu, brain/Kp, free, where Kp, free is the ratio of unbound brain concentration over unbound plasma drug concentration (Liu et al., 2008), eq. 7 can be obtained from eq. 5:
  where OCu, plasma, 50 = KI/Kp, free. If total plasma concentrations are used and because Cu,plasma = Cplasma · fu, plasma, eq. 8 can be obtained from eq. 7:
  where fu, plasma is the unbound fraction in plasma and OCplasma, 50 = KI/(fu, plasma · Kp, free).
The unbound fractions determined from diluted brain tissue homogenates were corrected for dilution factor to yield an estimate of unbound fraction in the intact brain tissue using eq. 9 (Kalvass and Maurer, 2002):  where fu, brain and fu, homogenate represent the unbound fraction in brain tissue and unbound fraction in brain homogenate, respectively, and D is the dilution factor for the brain homogenate. -Fold of difference was calculated for each compound as follows: -fold of difference = OC50/KI if OC50 > KI; otherwise, -fold of difference = KI/OC50.
Results
The structures of compounds 1 to 13 are shown in Fig. 1. The physicochemical properties, including molecular weight, pKa, calculated logD (clogD), and polar surface area of the 18 compounds are listed in Table 1. All of the compounds are basic compounds with molecule weights ranging from 240 to 360. Their clogD and polar surface values range from 2.2 to 5.7 and from 21 to 62 Å2, respectively. The plasma unbound fractions range from 0.010 to 0.66, a 66-fold difference, and the brain unbound fractions range from 0.00056 to 0.56, a 1000-fold difference. For all of the compounds, except for bupropion, their plasma unbound fractions are higher than their brain bound fractions as we observed in our previous study (Liu et al., 2005).
Physicochemical properties and plasma and brain unbound fractions of the 18 model compounds
Data are means. n = 2–4.
In Vivo Occupancy versus Drug Concentrations. The KI values for rat and human SERT and DAT for a set of compounds selected from the literature are listed in Table 2. The difference between rat and human was 1- to 3.6-fold for those compounds. The correlation in the present study was determined between rat in vivo receptor occupancy and human in vitro receptor binding affinity.
Human and rat SERT and DAT KI for selected compounds
To examine the occupancy-concentration relationship among compounds with different in vitro binding affinities, all concentrations were normalized to the KI of the corresponding compound. A theoretical simulation was constructed based on the free drug hypothesis (eqs. 5–8) and is illustrated in Fig. 2. For a nonefflux substrate at the blood-brain barrier (BBB), the drug concentrations at the biophase and unbound brain and unbound plasma concentrations are identical at steady state, but total plasma and total brain concentrations are much higher because of the protein binding in the plasma protein and brain tissue (Fig. 2A). For an efflux substrate, its biophase, the unbound, and total brain IC50 values remain the same as those for a nonefflux substrate (Fig. 2A), but it has higher unbound and total plasma IC50 values because of the efflux transport at the BBB (Fig. 2B).
The relationship between the simulated and observed receptor occupancy for SERT and DAT and brain and plasma concentrations of tested compounds are shown in Fig. 3. Similar to the simulation in Fig. 2, the observed data demonstrated that to achieve the same receptor occupancy, much higher total plasma and brain concentrations than unbound plasma and brain concentrations are required (Fig. 3, A versus B, C versus D, E versus F, and G versus H). For total plasma or brain concentrations, the majority of symbols and fitted lines are on the right side of the theoretically projected curves using in vivo measured KI (Fig. 3, A, C, E, and G). After correction for the plasma and brain tissue binding (Fig. 3, B, D, F, and H), all the symbols are shifted left and appear to be more evenly distributed along both sides of the theoretically projected curves. These observations support the brain free drug hypothesis, which states that unbound brain concentrations better represent the concentrations at the biophase and can be used to predict the in vivo occupancy.
A quantitative way to assess the relationship in Fig. 3 is to calculate the -fold of difference between in vivo OC50 and in vitro KI. The total plasma and brain OC50 values are presented in Table 3 and were calculated by fitting the Hill equation to the data in Fig. 3 for each compound. The -fold of difference using in vivo OC50 and in vitro KI for each compound was computed from the data in Table 3 and is presented in Table 4. On average, in vivo total brain OC50 values were 408- and 410-fold greater than the corresponding in vitro KI values for SERT and DAT, respectively. The -fold of difference between in vivo unbound brain OC50 and in vitro KI was from 3.3 and 4.1 for SERT and DAT, respectively. This difference results in an approximately 100-fold improvement in the accuracy of using the unbound brain concentration to predict the biophase concentration over the predictions made using the total brain concentration. Likewise, the average in vivo total plasma OC50 was 44- and 53-fold greater than the corresponding in vitro KI for SERT and DAT, respectively. The -fold of difference between in vivo unbound plasma OC50 and in vitro KI was from 4.4 and 4.6 for SERT and DAT, respectively. This indicates a 10-fold improvement in the accuracy of using the unbound plasma concentration to predict the biophase concentration over the predictions made using the total plasma concentration.
In vitro KI for human SERT and DAT and rat in vivo plasma OC50, brain OC50, and Kp of 18 compounds
-Fold difference of OC50 and KI of the 18 compounds
Numbers in parentheses represent fold of OC50 less than KI.

Simulated occupancy and concentration curves for nonefflux substrates (A) and efflux substrates (B) for the concentration in biophase (——), unbound brain concentration (▵), total brain concentration (▴), unbound plasma concentration (○), and total plasma concentration (•). The concentrations were normalized to the KI. Equations 5, 6, 7, and 8 were used for the simulation with Hill coefficient = 1, fu, plasma = 0.1, fu, brain = 0.01, and Kp, free = 1 for nonefflux substrates and Kp, free = 0.3 for efflux substrates.
The correlation between in vivo OC50 and in vitro KI is presented in Fig. 4. For 17 compounds with available SERT data, only 2 compounds showed total brain OC50 values within 3-fold of their KI values (r2 = 0.01) (Fig. 4C), but 9 compounds showed unbound brain OC50 values within 3-fold of their KI values (r2 = 0.58) (Fig. 4D). For 15 compounds with available DAT data, only 1 compound showed a total brain OC50 within 3-fold of its KI (r2 = 0.11) (Fig. 4G), but 10 compounds showed unbound brain OC50 values within 3-fold of their KI values (r2 = 0.66) (Fig. 4H).
Similar results were observed for the total and unbound plasma concentrations for both SERT and DAT. Four of the 17 compounds showed total plasma SERT OC50 values within 3-fold of their KI values (r2 = 0.04) (Fig. 4A), but 9 compounds showed unbound plasma OC50 values within 3-fold of their KI values (r2 = 0.44) (Fig. 4B). Five of the 15 compounds showed total plasma DAT OC50 values within 3-fold of their KI values (r2 = 0.05) (Fig. 4E), but 9 compounds showed unbound plasma OC50 values within 3-fold of their KI values (r2 = 0.35) (Fig. 4G).
In Vivo Receptor Occupancy versus Brain/Plasma Ratios and Protein Binding. The correlation of in vivo unbound OC50/KI for SERT and DAT and total brain/total plasma concentration ratios is presented in Fig. 5. There is no correlation between the unbound plasma OC50/KI and the brain/plasma total concentration ratios (r2 = 0.09). Therefore, a high brain/plasma ratio does not result in high in vivo CNS activity.
Discussion
The results from the present study support the brain free drug hypothesis, which states that the unbound brain drug concentration, not the total brain drug concentration, determines the in vivo efficacy. Therefore, the unbound brain concentration represents the drug concentration at the biophase and should be used to evaluate brain penetration. Furthermore, this study demonstrated that a large total brain/total plasma ratio does not indicate a large unbound brain/plasma ratio, which represents the efficiency of brain drug penetration.
The SERT and DAT receptor occupancy was used as the efficacy biomarker to test the free drug hypothesis in the present study. In preclinical studies, it was demonstrated that SERT and DAT inhibitors increase concentrations of neurotransmitters, such as serotonin and dopamine, in the brain interstitial fluid (Ascher et al., 1995; Beyer and Cremers, 2008). There is an association between receptor occupancy and behavior changes such as the ones measured in the mouse forced swimming test or the mouse tail suspension test (Porsolt et al., 1977; Steru et al., 1985). It is well documented in the literature that there is a direct association between the receptor occupancy of SERT inhibitors and their preclinical and clinical antidepressive activities (Torres et al., 2003; Meyer et al., 2004; Argyelán et al., 2005). The receptor occupancy measured by positron emission tomography or singlephoton emission computed tomography has been used in clinical trials as a validated target biomarker for SERT and DAT inhibitors (Meyer, 2008).
According to the brain free drug hypothesis that the unbound brain concentration represents the drug concentration interacting with the CNS targets, one can predict that the unbound brain OC50 should be similar to the in vitro KI, assuming the affect of the endogenous ligands on the occupancy of the drug is negligible. In contrast, the total brain OC50 will be greater than the KI because some of the drug molecules are nonspecifically bound to the cellular components, such as phospholipids, and are not available to interact with the drug targets. Our experimental observations are consistent with this prediction. The -fold of difference between in vivo unbound brain OC50 and in vitro KI was from 3.3- to 4.1-fold for SERT and DAT, respectively. In contrast, the average in vivo total brain OC50 was more than 400-fold greater than the corresponding in vitro KI for SERT and DAT. This results in a 100-fold improvement in the prediction accuracy of the biophase concentration by using unbound brain concentration versus the total brain concentration to make the same prediction.
According to the free brain drug hypothesis, the unbound plasma OC50 is determined by the affinity of the compound and drug transport at the BBB. The total plasma OC50 is determined by the affinity of the compound, drug transport at the BBB, and the plasma unbound fraction. Thus, if the drug transport at the BBB is negligible, the unbound plasma OC50 should be similar to the in vitro KI and the total plasma OC50 will be greater than the KI because of the plasma protein binding. This prediction is supported by the experimental data from the present study. The -fold of difference between in vivo unbound plasma OC50 and in vitro KI was from 4.4 to 4.6 for SERT and DAT. In contrast, the in vivo total plasma OC50 was 44- to 53-fold greater than the corresponding in vitro KI for SERT and DAT, resulting in a 10-fold improvement in the prediction accuracy of the biophase concentration by using the unbound plasma concentration versus the total plasma concentration to make the same prediction.
It was observed that unbound brain OC50 and unbound plasma OC50 were similar for this data set probably because most of the compounds in the present study are not efflux substrates at the BBB. For non-P-gp substrates, it is expected that their unbound plasma concentration is similar to their unbound brain concentration. For P-gp substrates, the unbound plasma concentration is expected to be higher than the unbound brain concentration (Becker and Liu, 2006; Liu et al., 2008). This result has also been recently demonstrated by Kalvass et al. (2007b). They showed that the unbound plasma EC50 for antinociceptive activity in mice of loperamide, a P-gp substrate, was more than 50-fold of its in vitro KI, whereas its unbound brain EC50 was similar to its KI.

Relationship between in vivo observed SERT (A–D) and DAT (E–H) receptor occupancy and the ratio of concentration/KI of 18 compounds after intraperitoneal administration in rats. The occupancy and plasma and brain concentrations were determined from the in vivo study with three to six dose levels for each compound. Unbound plasma and brain concentrations were calculated from the total concentration and corresponding unbound fractions. The KI for each compound was determined from in vitro expressed human SERT or DAT cell membranes (Table 2). The black lines represent the theoretical simulation using eq. 5 with the assumption that in vivo IC50 = KI. Each type of symbol represents one compound, and each symbol represents the observed datum from one rat for the compound. The color lines represent the best fit of the Hill equation to the observed data for each compound.
Kp has been a commonly used parameter in CNS drug design to enhance brain drug penetration. The limitations of using this parameter to characterize brain penetration have been discussed in the literature (Hammarlund-Udenaes et al., 1997, 2008; Liu and Chen, 2005; Syvänen et al., 2006; Liu et al., 2008). A more appropriate parameter to described the brain penetration efficiency is Kp, free, the ratio of unbound brain concentration over unbound plasma concentration at steady state. In the present study, the unbound plasma OC50/KI ratio represents the in vitro potency. Lack of correlation between the unbound plasma OC50/KI ratio and Kp confirms that Kp is not a good indicator for brain drug penetration efficiency. If compounds are not subject to any drug transporters, as are the compounds in the present study, their Kp is determined simply by the ratio of the unbound fraction in the plasma over unbound fraction in the brain (Liu et al., 2008). A high Kp indicates a relatively high total drug concentration, but it does not indicate a high unbound brain concentration or high brain drug penetration efficiency. The brain/plasma ratio should not be used as a parameter to select CNS drugs in drug discovery.
One of the assumptions for correlating the in vivo OC50 observed at 90 min with the in vitro potency KI is that no hysteresis exists between the occupancy and plasma drug concentrations. Although, in the work reported by Kalvass et al. (2007b), a counterclockwise hysteresis was observed for antinociception for seven of the μ-opioid agonists, the authors attributed the hysteresis to the delayed brain penetration. Based on the time course of the brain/plasma ratio in that study, most drugs reached equilibrium after 30 min. Therefore, if later time points were considered, hysteresis would probably not be observed. It has been demonstrated that rapid equilibrium between plasma and brain concentration was achieved for an analog of the tested compounds, and no hysteresis was observed between occupancy and plasma concentrations for that compound (unpublished data). In addition, under these experimental conditions, most compounds reached equilibrium, as we observed in our previous studies (Liu et al., 2005). Therefore, the assumption that no hysteresis exists between the occupancy and plasma drug concentrations is valid.
One limitation of the present study is that we assumed that the KI values for humans and rats are similar because we were not be able to determine the rat KI for the tested compounds. For another set of selected compounds in Table 2, the difference between rat and human SERT and DAT KI values is 1- to 3.6-fold. This small species difference will not affect the conclusions of the present study.
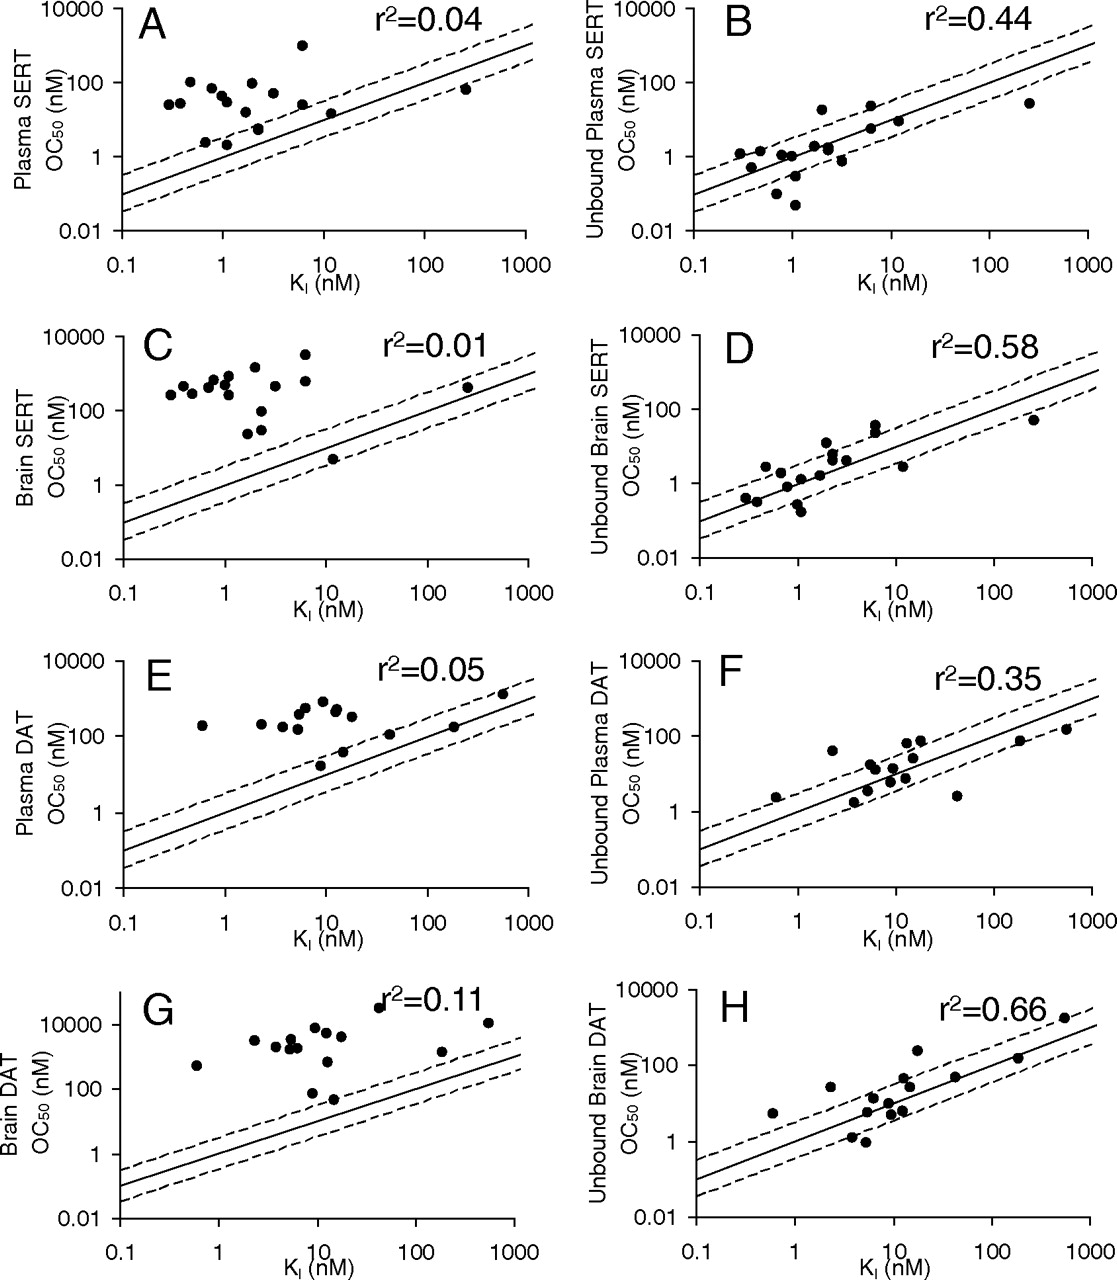
Relationship between in vivo OC50 and human in vitro KI for SERT (A–D) and DAT (E–H) after intraperitoneal administration in rats. OC50 values were calculated from the data in Fig. 3 and are presented in Table 2. KI values were determined from in vitro repressed human SERT or DAT cell membranes for each compound (Table 2). The solid and broken lines represent unity and 3-fold boundaries, respectively.

The relationship between in vivo unbound plasma OC50/KI ratio and brain/plasma ratio (Kp) for SERT (•) and DAT (○). Unbound plasma OC50 values were calculated from the data in Fig. 3 and are presented in Table 3. Kp values are the observed in vivo data at 90 min after the intraperitoneal dose and are presented in Table 3. Unbound fractions were determined from the in vitro study and are presented in Table 1.
In summary, the present study provides an extensive experimental data set to demonstrate that unbound brain concentrations, not total brain concentrations, represent the drug concentration that interacts with receptors on the neuron surface and determines in vivo CNS activity. The brain/plasma concentration ratio does not indicate the brain drug penetration efficiency or the unbound brain drug concentration that is available to interact with a drug target and should not be used as an independent parameter to guide CNS drug design.
Acknowledgments
We thank Yeping Zhao, Yuan Ling Tam, Mey Lee, Kristine Van Natta, Linda Bristow, Wajiha Ali, Renee Martin, Robert Henningsen, Mohammad Masjedizadeh, Werner Rubas, Paul Weller, Philip Worboys, and Mario Monshouwer for their contribution and support.
Footnotes
-
Article, publication date, and citation information can be found at http://dmd.aspetjournals.org.
-
doi:10.1124/dmd.109.026674.
-
ABBREVIATIONS: CNS, central nervous system; SERT, serotonin reuptake transporter; DAT, dopamine reuptake transporter; GBR12909, 1-[2-[bis(4-fluorophenyl)methoxy]ethyl]-4-(3-phenylpropyl)piperazine; GBR12935, 1-(2-(diphenylmethoxy)ethyl)-4-(3-phenylpropyl)piperazine; WIN35,428, (–)-2-β-carbomethoxy-3-β-(4-fluorophenyl)tropane-1,5-napthalenedisulfonate; NS2359, (1R,2R,3S,5S)-3-(3,4-dichloro-phenyl)-2-methoxymethyl-8-methyl-8-aza-bicyclo[3,2,1]octane; DASB, N,N-dimethyl-2,2-amino-4-cyanophenylthiobenzylamine; HPLC, high-performanceliquid chromatography; BBB, blood-brain barrier; P-gp, P-glycoprotein.
-
↵1 Current affiliation: Genentech, Inc., South San Francisco, California.
- Accepted April 20, 2009.
- Received January 11, 2009.
- The American Society for Pharmacology and Experimental Therapeutics


