


Abstract
Typically, concentration-response curves are based upon nominal inducer concentrations for in-vitro-to-in-vivo extrapolation of CYP3A4 induction. The limitation of this practice is that it assumes the hepatocyte culture model is a static system. We assessed whether correcting for: 1) changes in perpetrator concentration in the induction medium during the incubation period, 2) perpetrator binding to proteins in the induction medium, and 3) nonspecific binding of perpetrator can improve the accuracy of CYP3A4 induction predictions. Of the seven compounds used in this evaluation, significant parent loss and nonspecific binding were observed for rifampicin (29.3–38.3%), pioglitazone (64.3–78.6%), and rosiglitazone (57.1–75.5%). As a result, the free measured EC50 values (EC50u) of pioglitazone, rosiglitazone, and rifampicin were significantly lower than the nominal EC50 values. In general, the accuracy of the induction predictions, using multiple static models, improved when corrections were made for measured medium concentrations, medium protein binding, and nonspecific binding of the perpetrator, as evidenced by 18–29% reductions in the root mean square error. The relative induction score model performed better than the basic static and mechanistic static models, resulting in lower prediction error and no false-positive or false-negative predictions. However, even when the EC50u value was used, the induction prediction for bosentan, which is a substrate of organic anion transporter proteins, was overpredicted by approximately 2-fold. Accounting for the ratio of unbound intracellular concentrations to unbound medium concentrations (Kpuu,in vitro) (0.5–7.5) and the predicted multiple-dose Kpuu,in vivo (0.6) for bosentan resulted in induction predictions within 35% of the observed interaction.
introduction
Drug-drug interactions (DDIs) related to CYP3A4 induction remain a concern for the pharmaceutical industry given that induction can affect the safety and efficacy of coadministered drugs (Lin, 2006; Zhang et al., 2014). Typically, the concentration-response data used in these models rely on the nominal concentration of the applied new chemical entities (NCEs). Yet this approach is only appropriate if it can be assumed that the cell culture system is static, which may not always be the case. To address the problem of inducer depletion in vitro, various approaches have been taken into account for the changes that occur in the hepatocyte system over the course of an induction study. Kato et al. (2005) predicted the average unbound concentrations in primary cultured human hepatocyte incubations from in vivo clearance data to estimate the EC50 values used to predict induction risk. Using this method, the predicted magnitudes of induction for multiple inducers, including rifampicin and phenobarbital, were in agreement with the clinically observed DDI. In another study, Zhang et al. (2014) considered the stability of the inducers that were evaluated. However, the inducer concentration was only measured at the 24-hour time point on the last day of incubation, which may result in an overestimation of the induction potency if there is substantial inducer depletion during the dosing interval. Barring these assessments, metabolic changes in the in vitro cultured human hepatocyte system are typically not taken into consideration when attempting to quantitatively predict induction-based DDIs (Fahmi et al., 2008; Almond et al., 2009; Kozawa et al., 2009).
In addition to accounting for perpetrator loss, Chang et al. (2016) factored in specific binding to induction medium protein as well as nonspecific binding to assay culture plates and hepatocytes. The measured rifampicin concentration, accounting for nonspecific binding and inducer depletion over the 24-hour dosing interval, was found to be half of the nominal concentration. Furthermore, when binding to incubation medium containing 0.2% bovine serum albumin (BSA) was determined, the measured unbound inducer concentration was reportedly only 30% of the nominal level (Chang et al., 2016). Such substantial differences between nominal and measured unbound concentrations of rifampicin, which is considered to be a fairly soluble compound with moderate plasma and medium protein binding properties, suggest that, for more highly bound compounds, induction data may be drastically altered depending on whether binding is considered. This issue is important given that some compounds have very poor chemical properties which increase their risk of binding nonspecifically to assay culture plates or to proteins included in medium supplements (Rebeski et al., 1999). For example, in a recent publication of small-molecule kinase inhibitors approved by the Food and Drug Administration from 2000 to 2011, over 70% of these drugs had plasma protein-binding values that were >90%, and ∼30% of them had plasma protein-binding values >99% (O'Brien and Fallah Moghaddam, 2013). The medium unbound fraction is also likely to vary between culture systems since it is known that induction media obtained from different sources can have different types and concentrations of protein (Runge et al., 2000; Madan et al., 2003; Nishimura et al., 2007).
Given the lack of a comprehensive assessment of the relevance of using measured and unbound medium concentrations of perpetrator in induction predictions, we sought to evaluate the contribution of these factors using several static approaches, including the relative induction score (RIS), basic static (R3), and mechanistic static [area under the curve (AUC) ratio (AUCR)] models. Seven known clinical inducers and noninducers of CYP3A4 were selected for this analysis, all of which are commonly used as calibrator compounds in the RIS model (Fahmi et al., 2008). The objectives of our study were to measure: 1) perpetrator depletion over the assay incubation period, 2) direct binding of perpetrator to proteins included in the induction medium, and 3) nonspecific binding of perpetrator to assay culture plates and hepatocytes which were then used to determine whether incorporating these corrections improves the precision and accuracy of CYP3A4 induction predictions. Finally, given that it is the perpetrator intracellular concentration that is most relevant for induction potency, we also estimated the ratio of unbound intracellular concentrations to unbound medium concentrations (Kpuu,in vitro) for two transporter substrates, rifampicin and bosentan, and determined the impact of using free intracellular concentrations on induction predictions.
Materials and Methods
Induction-certified cryopreserved human hepatocytes (Supplemental Table 1, Lot numbers NON, CDP, and Hu1624) and cryopreserved 5-donor pooled hepatocytes were purchased from Thermo Fisher (Waltham, MA) or BioreclamationIVT (Baltimore, MD). Williams’ E medium, cryopreserved hepatocyte recovery medium, hepatocyte maintenance and plating supplement pack, rapid equilibrium dialysis (RED) 96-well blocks, RNAlater solution, MagMax-96 Total RNA Isolation Kit, Applied Biosystems High Capacity cDNA Reverse Transcription Kit, TaqMan Fast Advanced Master Mix, TaqMan human glyceraldehyde-3-phosphate dehydrogenase (GAPDH) probe with Applied Biosystems VIC dye, and CYP3A4 cDNA probe with Applied Biosystems FAM dye were purchased from Thermo Fisher. Carbamazepine, phenytoin, pioglitazone, pleconaril, rifampicin, and rosiglitazone were purchased from Sigma-Aldrich (St. Louis, MO). Semagacestat was procured from AstaTech, Inc. (Bristol, PA). Bosentan was purchased from AvaChem Scientific (San Antonio, TX). [3H]Rifampicin (45 Ci/mmol) and [3H]bosentan (3.3 Ci/mmol) were obtained from Moravek Biochemicals (Brea, CA). LumaPlate and Ultima Gold scintillation fluid were purchased from PerkinElmer (Waltham, MA). The analytical internal standard was synthesized at Vertex Pharmaceuticals Inc. (Boston, MA). All organic solvents were purchased from Thermo Fisher and Sigma-Aldrich.
CYP3A4 Induction Assay
Cryopreserved human hepatocytes from three donors (Supplemental Table 1) were thawed in cryopreserved hepatocyte recovery medium, resuspended in Williams’ E medium containing hepatocyte plating supplement pack and 10% bovine serum, and plated in collagen-coated plates at a density of 0.08 × 10⁶ viable cells/well in 96-well format. After 6 hours of incubation with 5% CO2 and 95% relative humidity at 37°C, the plating medium was removed and replaced with the induction medium (Williams’ E medium containing hepatocyte maintenance supplement pack, containing 0.125% BSA). After plating (24 hours), hepatocyte monolayers were treated with carbamazepine (0.01–250 µM), phenytoin (0.04–240 µM), pioglitazone (0.03–200 µM), pleconaril (0.01–60 µM), rifampicin (0.01–100 µM), rosiglitazone (1–50 µM), semagacestat (0.01–120 µM), and bosentan (0.01–20µM) in induction medium. Dosing solutions containing validation compounds were changed every 24 hours for 2 days. The concentration of dimethylsulfoxide in the culture medium was 0.1%. Cultures were maintained in a 37°C incubator with 5% CO2 and 95% humidity. All experiments were performed in triplicate.
Relative Expression of mRNA by Reverse-Transcription Polymerase Chain Reaction
Following the 48-hour compound treatment period, medium containing the test compound was removed, and the cells were stored in RNAlater solution at −20°C until it was used for RNA isolation. RNA was isolated from cells using the MagMax-96 Total RNA Isolation Kit, according to the manufacturer’s protocol. The RNA concentration and quality of each sample was determined using the ratio of UV absorbance at 260 and 280 nm (A260/A280) using a Nanodrop2000 spectrophotometer (Thermo Fisher). To generate cDNA, reverse transcription of 50 ng of total RNA was carried out using the High Capacity cDNA Reverse Transcription Kit, according to the manufacturer’s protocol. Quantitative polymerase chain reaction of 2 μl of cDNA was performed using the TaqMan Fast Advanced Master Mix, human GAPDH, and CYP3A4 probes. All data were normalized to the expression of the housekeeping gene GAPDH (ΔCt = CtCYP − CtGAPDH). Fold change in mRNA expression over dimethylsulfoxide control was calculated (ΔΔCt = ΔCttreat − ΔCtDMSO).
Assessment of Nonspecific Binding and Stability of CYP3A4 Inducers
Hepatocytes were plated following the same procedures as for the induction assay. All seven CYP3A4 inducers were incubated with hepatocytes (n = 3) at 37°C in the hepatocyte induction medium (containing 0.125% BSA) for 24 hours on day 1 and day 2. This is the same time period that the compound was exposed to the cells in the induction assay, prior to subsequent medium change with fresh dosing medium. Incubation with hepatocytes was also carried out at 4°C to investigate the nonspecific binding of these compounds to cells and cell culture plates. The compound incubation concentrations ranged from 0.1 to 10 µM. Culture supernatants (5 µl) were collected at 0, 2, 4, 6, and 24 hours after application of the dosing medium. As a control, the same incubations were carried out in cell culture plates without hepatocytes at both 37°C and 4°C. Following sampling, 45 µl of blank induction medium and 100 µl of internal standard solution in acetonitrile were added to each sample. The samples were centrifuged at 3000 rpm for 20 minutes, and the supernatants were analyzed using liquid chromatography–tandem mass spectrometry (LC-MS/MS) to determine the concentration of each test compound in the induction medium at each time point.
Determination of the Unbound Fraction of CYP3A4 Inducers in Induction Medium and Hepatocytes
Medium binding of compounds was determined in induction medium with 0.125% BSA at final concentrations of 1 and 10 µM. Two hundred twenty–microliter aliquots were loaded into the donor chambers (red side) of the RED device and were dialyzed against 350 µl of sodium phosphate buffer (pH 7.4). The RED devices were sealed with a gas-permeable membrane and incubated on a shaking plate for 6 hours in a 37°C incubator containing 5% CO2 and saturating humidity. After incubation, a 50-µl aliquot was removed from the donor side of the RED device and added to 200 µl of internal standard in acetonitrile and 50 µl of buffer. A 50-µl aliquot was removed from the receiver side of the RED device and added to 200 µl of internal standard in acetonitrile and 50 µl of induction medium. Samples were vortexed and centrifuged at 3000 rpm for 20 minutes, and a 125-µl aliquot of the supernatants was transferred to 96-well shallow-well plates for LC-MS/MS analysis.
Intracellular binding of bosentan and rifampicin was assessed using equilibrium dialysis (RED device) of hepatocyte homogenate using the same method that was used to assess medium binding. Binding was determined at concentrations of 1 µM for both bosentan and rifampicin to capture the extent of binding at the median observed intracellular concentration. To prepare the homogenate, 10 lots of cryopreserved human hepatocytes were thawed in cryopreserved hepatocyte recovery medium and diluted in Hanks’ balanced salt solution to a concentration of 10 × 106 total cells/ml (Mateus et al., 2013). The suspension was heated at 95°C for 5 minutes, and then cells were lysed over three cycles of freezing on a dry-ice ethanol bath and thawing at 37°C.
Determination of Unbound Drug Accumulation Ratios (Kpuu) for Bosentan and Rifampicin
Cryopreserved human hepatocytes were seeded according to the same protocol as for the induction assays. Two study designs were used to determine the intracellular and medium concentrations of rifampicin and bosentan. First, a time-course experiment was performed in which cells were treated with a single concentration of either rifampicin (0.1 µM) or bosentan (1 µM) and incubated for 0.25, 2, 4, 6, 18, and 24 hours to assess the change in Kpuu over time. The concentrations were chosen to ensure that bosentan and rifampicin levels were sufficiently (>5-fold) below reported Km values for OATP1B1and OATP1B3 transporters (Vavricka et al., 2002; Tirona et al., 2003; Treiber et al., 2007; Izumi et al., 2015). A follow-up experiment was conducted in which rifampicin or bosentan (0.1, 0.3, 1, 3, 5, 10, and 20 µM) was incubated in cryopreserved human hepatocytes for 24 hours to determine the Kpuu values across the range of concentrations used in the induction studies. At the end of the treatment period, supernatant was collected, and 20 µl was added to 180µl of acetonitrile containing internal standard. Cells were washed three times with Hanks’ balanced salt solution prior to lysing with 100 µl acetonitrile containing internal standard. The samples were analyzed by LC-MS/MS to measure the total intracellular concentration of a drug, considering a total intracellular volume of 4 µl/106 cells (Reinoso et al., 2001). The unbound drug accumulation ratios (Kpuu) were then determined using eq. 16.
Characterizing the Uptake Clearance of Bosentan and Rifampicin in Suspension Hepatocytes
The uptake of rifampicin and bosentan was measured in suspension cryopreserved human hepatocytes using the oil-spin method. Hepatocytes were thawed at 37°C and placed in cryopreserved hepatocyte recovery medium. Hepatocytes were centrifuged and then reconstituted in Krebs-Henseleit Buffer at a final density of 1 × 10⁶ viable cells/ml. Cells were then incubated for 2.5 minutes at 37°C and 4°C (on ice) with different concentrations of rifampicin (0.03–5 µM) spiked with [3H]rifampicin (1 µCi/ml)) and bosentan (0.1–30 µM) spiked with [3H]bosentan (1 µCi/ml)). At the end of the incubation period, aliquots were taken and added to centrifuge tubes containing 25 µl of 1 M sucrose and 55 µl of mineral oil (Hepatocyte Transporter Suspension Assay kit; Gentest, Tewksbury, MA). Cells were spun at 10,000 rpm for 15 seconds to stop the uptake, and tubes were immediately placed on dry ice. Tubes were cut to separate the lower part containing the cell pellet and the upper part containing supernatant, which were then mixed with scintillation cocktail to measure radioactivity.
LC-MS/MS Analysis
The LC-MS/MS system, composed of Agilent 1200 Series binary pumps (Agilent Technologies, Palo Alto, CA), a PAL (LEAP) autosampler (CTC Analytics AG, Zwingen, Switzerland), and an API 5500 QTrap tandem mass spectrometer (AB Sciex, Foster City, CA), was used in the analysis of all unlabeled test compounds. A 5-μl aliquot of each sample was injected into the LC-MS/MS system. High-performance liquid chromatography separation was conducted on a Unisol C18 column (2.1 × 30 mm, 5 μm; Agela Technologies, Newark, DE). Mobile phase A was 10 mM ammonium acetate in water (pH 4.0), and mobile phase B was acetonitrile/methanol (50/50, v/v). The analytes were eluted using a gradient method from 0 to 99% mobile phase B in 0.5 minutes with a flow rate of 1.0 ml/min, and 99% mobile phase B from 0.5 to 1.2 minutes with a flow rate from 1.0 to 1.8 ml/min. The electrospray ionization source was operated at 5500 V or −4500 V for positive and negative modes and 650°C. The curtain gas, gas 1, and gas 2 were set to 30, 60, and 70 psi, respectively. Multiple reaction monitoring MS/MS (Supplemental Table 2) was used to measure the analytes.
Data Analysis
EC50 and Emax Determination for CYP3A4 mRNA Induction.
GraphPad Prism 6.0 (GraphPad Software, La Jolla, CA) was used for data fitting. EC50 and Emax values were determined from mRNA expression dose-response curves. The dose-response curves were fitted to a three-parameter sigmoid (Hill) model, with the baseline value of induction fixed to 1, according to eq. 1:
 (1)
(1)Measured Concentration of Parent Drugs during Hepatocyte Incubation.
The concentration versus time profiles of all compounds were measured over the 48-hour incubation period. Cmin is the measured concentration at 24 hours on day 1. The systemic exposure to drugs (AUC) was calculated by the linear trapezoidal method. Cave was calculated according to eq. 2:
 (2)
(2)Protein Binding with Induction Medium and Hepatocytes.
The free fraction in media (fu,media) and the free fraction in the cell (fu,cell) were calculated according to the following equations: (3)
(3) (4)
(4) (5)The fu,cell value was determined by correcting the fraction unbound in homogenate (fu,hom) by a dilution factor (D) as previously reported (Mateus et al., 2013; Riccardi et al., 2016). Based on a hepatocyte volume of 4 µl for 1 × 10⁶ cells (Reinoso et al., 2001), D was determined to be 25.
Correcting the EC50 for Inducer Depletion and Medium Binding.
Nominal EC50 was determined by plotting CYP3A4 mRNA expression fold induction in hepatocytes versus the nominal concentration (C0) of the applied perpetrator compound. The measured EC50 was determined according to eq. 6. Unbound EC50 (EC50,u) was calculated for both nominal and measured EC50 according to eqs. 7 and 8, respectively:
 (6)
(6) (7)
(7) (8)
(8)RIS Model and Correlation to In Vivo CYP3A4 Induction.
The RIS model is a calibration approach to induction predictions in which the EC50 and Emax of various inducers are combined with free plasma concentrations to estimate a relative induction score (Ripp et al., 2006). RIS values were calculated as described by eq. 9 (Ripp et al., 2006; Fahmi et al., 2008): (9)where Cmax,u is the maximum unbound plasma concentration of the CYP3A4 inducer reported in the literature (Supplemental Table 3). The magnitude of the clinical DDI data (percentage decrease in AUC of midazolam) was plotted against the RIS value of the inducers. The curves were fitted to a three-parameter sigmoid (Hill) model, according to eq. 10. GraphPad Prism 6.0 was used for data fitting:
 (10)Here, %DDImax is the maximum %DDI, and RIS50 is the RIS value at 50% of %DDImax. An induction prediction was considered to be positive if the RIS value was <0.1 (Fahmi et al., 2008).
Basic Static Model (R3).
A basic static model (R3 model), accounting for induction potency, maximum fold induction, and circulating inducer concentrations, was used in predictions. The R3 values were calculated using eq. 11 in accordance with the Food and Drug Administration (http://www.fda.gov/downloads/drugs/guidancecomplianceregulatoryinformation/guidances/ucm292362.pdf) draft guidance on drug-drug interactions. The value of d was set to 1. An induction prediction was considered to be positive if the R3 value was <0.9 in accordance with the draft guidance:
 (11)
(11)Mechanistic Static Model.
The mechanistic static model (MSM), or “net effect” model (Fahmi et al., 2009), was used to account for simultaneous reversible inhibition, time-dependent inhibition (TDI), and induction in both the liver and the intestine. The AUCR in the presence and absence of an inducer was calculated according to eq. 12: (12)where A, B, and C denote TDI, induction, and reversible inhibition in the liver, respectively. X, Y, and Z denote TDI, induction, and reversible inhibition in the intestine. Subscripts H and G denote hepatic (H) or intestinal (G) values. These terms are described by the following equations:
 (13)
(13) (14)
(14) (15)FG is the fraction of the substrate that escapes extraction in the gut, and fm,CYP3A4 is the fraction of the substrate cleared via CYP3A4-mediated metabolism. The values of FG and fm,CYP3A4 were 0.51 and 0.9 for midazolam (Galetin et al., 2006; Einolf et al., 2014) and 0.66 and 0.92 for simvastatin, respectively (Chung et al., 2006; Obach et al., 2006). The unbound Cmax was used for [I] in both the intestine and the liver. The empirical scaling factor (d) was set to 1 for all predictions. Reversible inhibition of CYP3A4 by carbamazepine (Ki = 104 µM), pioglitazone (Ki = 20 µM), and rifampicin (Ki = 10.5 µM) was accounted for in the mechanistic static model. Additionally, TDI by pioglitazone (KI = 13 µM, kinact = 0.013 min−1) and rosiglitazone (KI = 4.4 µM, kinact = 0.011 min−1) was incorporated into the model. The kdeg,H and kdeg,G values were 0.019 hour−1 and 0.029 hour−1 (Fahmi et al., 2008). An AUCR of <0.8 was considered to indicate a positive induction risk, as suggested in the draft guidance (http://www.fda.gov/downloads/drugs/guidancecomplianceregulatoryinformation/guidances/ucm292362.pdf).
Evaluation of Model performance.
To assess the prediction accuracy of each model, the root mean square error (RMSE, eq. 16) was calculated (Vieira et al., 2014). The geometric mean fold error (GMFE, eq. 17) was used to determine prediction bias (Vieira et al., 2014). Lower values of RMSE and GMFE indicate greater prediction accuracy and reduced bias, respectively:
 (16)
(16) (17)
(17)Calculation of the In Vitro Kpuu.
The ratio of unbound cell concentration to unbound medium concentration (Kpuu,in vitro) was calculated according to eq. 18 (Mateus et al., 2013): (18)where fu,cell and fu,media are the fraction unbound in hepatocytes and medium, respectively. Ccell and Cmedia represent total intracellular and total medium drug concentration, respectively.
Correction of Bosentan and Rifampicin EC50 Values for Unbound Intracellular Concentrations.
Following incubation of rifampicin and bosentan (0.1, 0.3, 1, 3, 5, 10, and 20 µM) for 24 hours, intracellular and medium concentrations were measured according to the previously described protocol, and the Kpuu,in vitro values were determined. The average steady-state intracellular unbound concentrations at each nominal inducer concentration (Iu,cell,ave) were calculated according to eq. 19: (19)The Iu,cell,ave values were plotted against the fold change in CYP3A4 mRNA, and the EC50,cell,u and Emax,cell values were estimated by fitting the data to eq. 1 using nonlinear regression in GraphPad Prism.
The Extended Clearance Model and Prediction of In Vivo Kpuu.
Hepatic blood clearance following intravenous dosing was described by the well stirred model (Pang and Rowland, 1977): (20)where Qh is hepatic blood flow (90 l/h), fu,b is the unbound fraction in blood, and CLint,h is the intrinsic hepatic clearance. Assuming no basolateral efflux, CLint,h was defined by the extended clearance model (Liu and Pang, 2005):
 (21)where CLint,uptake is intrinsic active uptake clearance, CLint,passive is the intrinsic passive diffusion clearance, CLint,bile is the intrinsic biliary clearance, and CLint,metab is the total intrinsic metabolic clearance.
The in vivo Kpuu (Kpuu,in vivo) was predicted according to eq. 22 (Barton et al., 2013): (22)where SFuptake is an empirical scaling factor for in vitro CLint,uptake that was estimated by comparing the in vitro CLint,uptake to the in vivo CLint,uptake estimated from CLh. In vitro intrinsic clearance values were scaled by assuming 39.8 mg microsomal protein/g liver, 118 × 106 hepatocytes/g liver, 24.5 g liver/kg body weight, and an average 70-kg body weight.
Induction Predictions Incorporating In Vitro and In Vivo Kpuu Estimates.
Induction predictions using the R3 (eq. 11) and MSM (eq. 12) methods were performed to assess the effects of intracellular unbound concentrations on prediction accuracy. Emax,u,cell and EC50,u,cell were used as input parameters. The [I] value used for the R3 model and the hepatic component of the mechanistic static model was equal to Cmax,u*Kpuu. For the intestinal portion of the MSM model, [I] was assumed to be equal to Cmax,u.
In Vitro Uptake Kinetics Measurement.
The active uptake velocity was determined by subtracting the velocity at 4°C from the uptake velocity at 37°C. The active uptake velocity was plotted against substrate concentration and fit via nonlinear regression in GraphPad Prism 6.0. The kinetic parameters Km and Vmax for active uptake were determined using the Michaelis-Menten equation (eq. 23). CLint,uptake was estimated from the ratio of the Vmax and Km values: (23)Intrinsic passive permeability clearance (CLint,passive) was estimated from the slope of the 4°C velocity versus substrate concentration plots using linear regression.
Results
Measured Concentration of CYP3A4 Inducers in Human Hepatocyte Induction Medium.
At 37°C, negligible parent compound loss was observed for phenytoin, carbamazepine, and semagacestat. The concentration change over 24 hours after dosing was within analytical accuracy (data not shown). The profiles of measured concentrations over time for pioglitazone, pleconaril, rifampicin, and rosiglitazone are shown in Fig. 1. Rifampicin concentration decreased when incubated at 37°C, with 56–83% remaining at the 24-hour time point (Fig. 1C) after dosing at three concentrations and incubating with three lots of hepatocytes. Pioglitazone (Fig. 1A) and rosiglitazone (Fig. 1D) showed substantial parent loss when incubated at 37°C, with ∼20–50% remaining at the 24 hour time point after dosing. At 37°C, the percentage of pleconaril remaining (Fig. 1B) decreased to <10% after 24-hour incubation. No notable difference in perpetrator concentration profiles over time was observed between day 1 and day 2 (Fig. 1). The concentrations of pioglitazone, rifampicin, and rosiglitazone were unchanged over the 24-hour incubation period when incubated at 4°C (Supplemental Fig. 1, A, C, and D). However, loss of pleconaril was observed at 4°C (Supplemental Fig. 1B). Similarly, when these compounds were incubated with cell culture plates alone (without hepatocytes; data not shown), pleconaril concentration decreased notably, but the concentrations of the other compounds were close to nominal concentrations at 37°C and 4°C, which indicated nonspecific binding of pleconaril to cell plates. The average measured concentration (Cave = AUC/time) of each CYP3A4 inducer was calculated using the overall exposure (AUC) and incubation time interval (time), whereas minimum concentration (Cmin) was the measured concentration at the 24-hour time point. For each compound, the average percentage remaining and the percentage remaining at the 24-hour time point are summarized in Table 1.
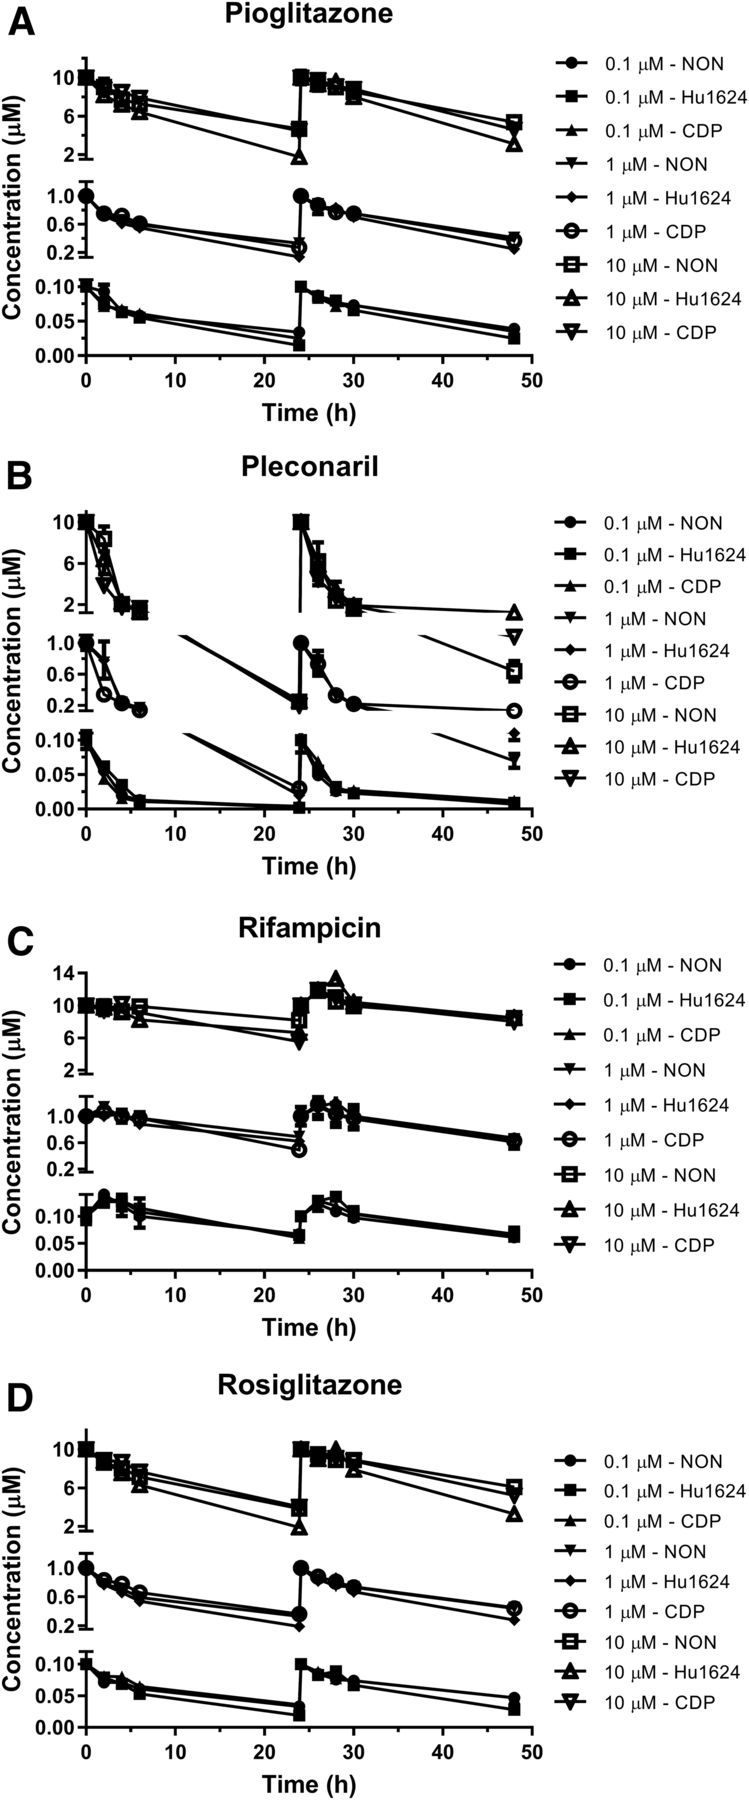
Parent compound loss of various CYP3A4 inducers in human hepatocyte induction assay. Measured medium concentration of pioglitazone (A), pleconaril (B), rifampicin (C), and rosiglitazone (D) over 48-hour incubation with primary human hepatocytes at 37°C in 0.125% BSA containing medium. The inducers were dosed at concentrations of 0.1, 1.0, and 10 µM on day 1 and day 2. Data are represented as the mean ± standard error in triplicate for three hepatocyte lots.
Nominal EC50 of CYP3A4 mRNA induction corrected for measured and unbound concentration of perpetrator in induction medium
Protein Binding of CYP3A4 Inducers in Hepatocyte Induction Medium.
The hepatocyte induction medium that was used in these studies contains 0.125% BSA and other proteins, such as insulin (6.25 µg/ml) and transferrin (6.25 µg/ml). For six of the seven CYP3A4 inducers, recovery in the protein-binding assay ranged between 80 and 120% in both media (Table 1). However, the protein-binding assay for pleconaril resulted in poor recovery values, possibly due to high nonspecific binding and/or poor stability, and was therefore not reported in Table 2. Pioglitazone and rosiglitazone were highly protein bound in the induction medium, with fu values of 0.22 and 0.15, respectively (Table 1). Carbamazepine (fu = 0.89), phenytoin (fu = 0.90), and semagacestat (fu = 0.91) showed less than 11% binding.
Accuracy and bias in the prediction of clinical CYP3A4 induction using various static models
The number of false negatives for each prediction method is listed. In parenthesis is the total number of predictions in the data set. For the R3 model, an R value <0.9 is considered to indicate induction risk. For the mechanistic static, induction potential is considered possible if the AUCR value is <0.8.
CYP3A4 Induction and Generation of RIS Models Based on Nominal and Measured Concentrations of the Perpetrator in Hepatocyte Induction Medium.
For each of the seven CYP3A4 inducers included in this study, the concentration-dependent changes in CYP3A4 mRNA expression were used to determine the Emax and EC50 values in three donors (Table 1). The EC50 was subsequently corrected for the measured and free drug concentrations in the hepatocyte induction medium, as illustrated in Fig. 2. The resulting EC50 values for nominal (C0), nominal unbound (C0,u), measured (Cave), and measured unbound (Cave,u) concentrations are shown in Table 1. For four of the compounds, the measured EC50 values were equivalent to or only slightly lower than the nominal EC50 values. However, for compounds where substantial depletion and nonspecific binding were observed, the measured EC50 values were 27% (rosiglitazone), 44% (pioglitazone), and 82% (pleconaril) lower than the nominal EC50 values. Similar results were observed upon correcting the EC50 values for medium binding. Whereas the measured EC50,u values for carbamazepine, phenytoin, and semagacestat were not substantially different from the nominal EC50 values, the measured EC50,u values for more highly bound compounds were 48% (rifampicin), 87% (pioglitazone), and 90% (rosiglitazone) lower than the nominal EC50 after correction by protein binding.

Schematic for correction of in vitro induction data using measured compound concentration in induction medium and medium protein binding. Correction of nominal EC50 and RIS for loss of compound in the assay incubation results in the measured EC50 and RIS, whereas correction for medium protein binding results in nominal unbound EC50,u and RISu. Both resulting values can be further corrected by loss of compound or medium protein binding to yield measured unbound EC50,u and RISu.
Using the various EC50 values generated, four different RIS curves (nominal RIS, measured RIS, nominal RISu, and measured RISu) were calculated according to eq. 7. Representative regression curves are shown in Supplemental Fig. 2.
Observed versus Predicted DDI by RIS Modeling.
The RIS curves were then used to predict the DDI potential of the seven inducers, and the results are summarized in Supplemental Table 4. The magnitude of induction predicted from all three hepatocyte donors is close to the observed, as shown in Fig. 3. Each of the four RIS models correctly identified all compounds as true positives or negatives. The RIS model utilizing nominal EC50 values predicted the AUCR to be within 2-fold of the observed for four of the seven compounds, whereas the induction magnitude for carbamazepine and phenytoin was underpredicted (<2-fold of the observed), and semagacestat induction was overpredicted (>2-fold of observed). Prediction accuracy was not improved by using the RIS model that incorporated measured medium concentrations, as evidenced by an increase in GMFE and RMSE in two of the three donors (Table 2). However, accounting for protein binding in the RIS models notably improved the prediction accuracy. Regardless of whether protein binding was considered alone or in combination with measured medium concentrations, predictions of phenytoin induction were accurately predicted within 2-fold of the observed. Additionally, the GMFE and RMSE were lower in two of the three donors upon correction for protein binding, with the greatest accuracy (lowest RMSE) values observed when both binding and measured concentrations were included in the model (Table 2). As medium protein binding was not determined for pleconaril, predicted DDI was not determined using the unbound RIS modeling.
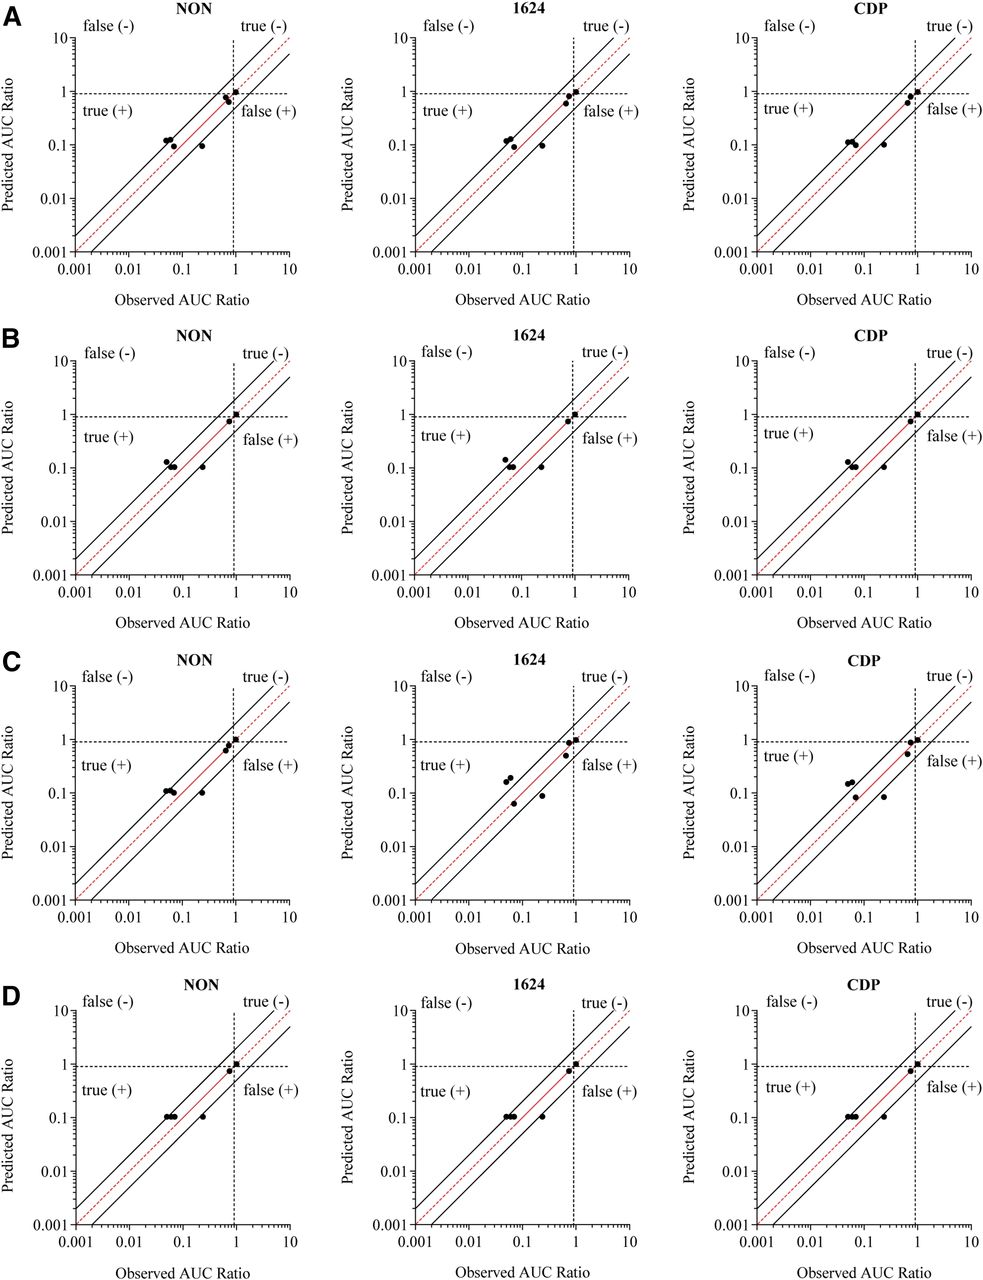
Comparison of predicted magnitude of induction and the observed clinical drug-drug interaction using the RIS correlation approach. The predicted AUCR (1 − DDI%) was determined for three separate donors, and the values are plotted against the observed DDI. The EC50 value used was nominal (A), nominalu (B), measured (C), and measuredu (D). The red line represents unity, and the solid black lines represent the values of 2-fold predictive error. The dotted lines at 0.9 divide the prediction categories of true- and false-positive and -negative inducers.
Static Modeling Predictions.
In addition to RIS modeling, static-prediction models were also tested for their predictive ability (Supplemental Tables 5 and 6). The basic static model predicted DDI risk relatively well across the four quadrants, but use of the nominal EC50 resulted in false-negative predictions (positive induction AUCR < 0.9) for pioglitazone and pleconaril in all three donors (Fig. 4; Supplemental Table 5). Use of the measured EC50 as opposed to the nominal value resulted in true-positive predictions for pleconaril and a reduction in false-negative predictions from 29 to 14% of the seven predictions (Table 2). The fraction of false negatives was further reduced when medium protein binding was accounted for, with only one false-negative prediction for pioglitazone in donor CDP. Phenytoin and carbamazepine, although true positives, were consistently underpredicted (<2-fold of the observed AUCR) across all three donors, whereas semagacestat was overpredicted (>2-fold of the observed AUCR) in donors NON and CDP, regardless of which EC50 values were used. However, RMSE values declined when the EC50 value was corrected for the average measured medium concentrations, and further decreased upon consideration of in vitro protein binding (Table 2), indicating increased prediction precision. Despite improved accuracy, prediction bias slightly increased (higher GFME) when EC50 values were corrected for protein binding (Table 2).

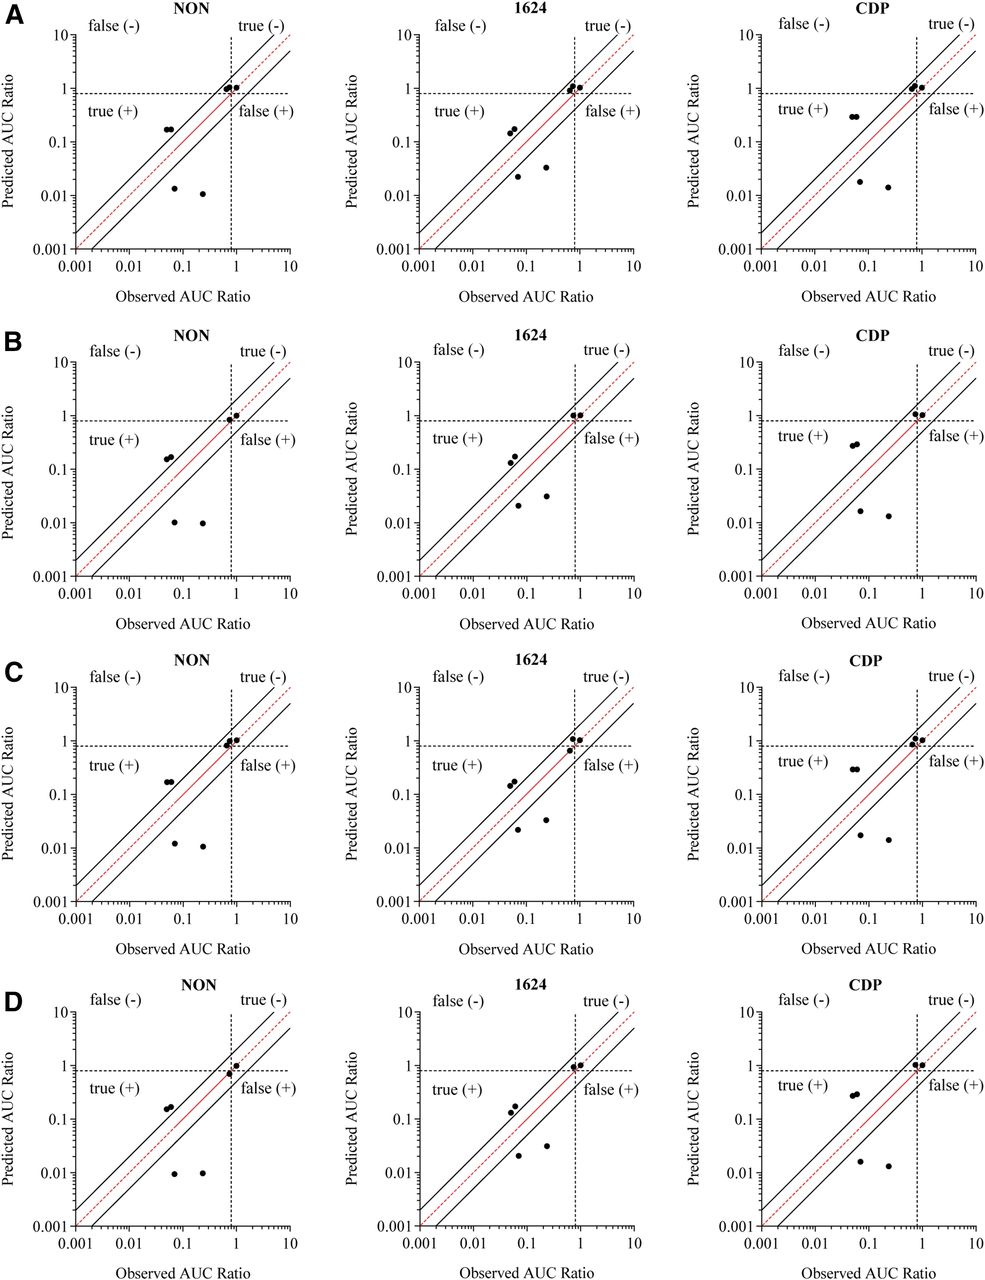
Comparison of predicted magnitude of induction and the observed clinical drug-drug interaction using the basic static R3 model. The predicted AUCR was determined for three separate donors, and the values are plotted against the observed DDI. The EC50 value used was nominal (A), nominalu (B), measured (C), and measuredu (D). The red line represents unity, and the solid black lines represent the values of 2-fold predictive error. The dotted lines at 0.9 divide the prediction categories of true- and false-positive and -negative inducers.
The last approach that was evaluated was the MSM, which takes into account fm,CYP3A4, FG, and simultaneous reversible and time-dependent inhibition (Fig. 5; Supplemental Table 6). The MSM also resulted in relatively accurate classifications of the compounds. Correcting the EC50 for average measured concentrations reduced the percentage of false negatives from 29% to an average of 24% across the three donors (Table 2), which is a minor improvement compared with what was observed with the R3 model, due to differences in the cutoff values used in these two methods. Factoring protein binding into the EC50 estimate resulted in further reductions in false negatives, with the lowest incidence observed when using the measured EC50,u. The magnitude of carbamazepine and phenytoin induction was underpredicted, and rifampicin and semagacestat induction was overpredicted in all three donors, regardless of which EC50 value was used. However, the RMSE was reduced when protein binding was accounted for, and was further reduced when the EC50 value was corrected for the average measured medium concentration. Very little change was seen in the GFME values, with slight increases observed upon correction for protein binding, indicating a minor increase in prediction bias.

Comparison of predicted magnitude of induction and the observed clinical drug-drug interaction using the mechanistic static model incorporating reversible inhibition and TDI. The predicted AUCR was determined for three separate donors, and the values are plotted against the observed DDI. The EC50 value used was nominal (A), nominalu (B), measured (C), and measuredu (D). The red line represents unity, and the solid black lines represent the values of 2-fold predictive error. The dotted lines at 0.9 divide the prediction categories of true- and false-positive and -negative inducers.
Correction of EC50 Values for Unbound Intracellular Concentrations of CYP3A4 Inducers in Hepatocytes.
Ultimately, it is the intracellular concentration of the perpetrator that drives the induction response. This becomes particularly relevant for compounds that are both substrates of uptake transporters as well as CYP3A4 inducers since it cannot be assumed that free intracellular concentrations are equal to free medium concentrations. Therefore, we used organic anion-transporting polypeptide substrates rifampicin and bosentan as model drugs (Treiber et al., 2007; Shou et al., 2008) to compare prediction success after using nominal, measured, and unbound medium concentrations for EC50 determination to the predictions resulting from the use of measured EC50 values, based on intracellular unbound concentrations (EC50,cell,u). Bosentan induction was assessed in cryopreserved human hepatocytes from two donors (CDP, Hu1624) (Supplemental Table 1). The resulting EC50 values were corrected for the average percentage remaining (33–44%) and fu,medium (0.377) (Table 3). In contrast to the inducer predictions previously discussed, predictive error for the R3 and MSM models was greater (93–135%) when the EC50 values were corrected for binding and measured Cave than when nominal EC50 values were used (14–35% error), resulting in approximately 2-fold overpredictions. One potential explanation for the observed overpredictions could be that the intracellular unbound concentrations are higher than the unbound medium concentrations. In this scenario, using the unbound medium concentrations for EC50 determination would result in an overestimation of the inducer potency. To test this hypothesis, we evaluated the impact of using intracellular unbound concentrations on induction predictions.
Bosentan stability, binding, induction parameter estimates, and induction predictions
To fit an EC50 value using average unbound intracellular concentrations, the ratio of the unbound cell to unbound medium concentrations at steady state (Kpuu,in vitro) needed to be determined first. An initial time-course experiment was conducted to assess which time point could be used to ensure that the Kpuu,in vitro had reached steady state. Medium and intracellular concentrations were measured 0.25, 2, 4, 6, 18, and 24 hours after dosing of 1 µM bosentan or 0.1 µM rifampicin. Total intracellular concentrations reached a maximum by 4 (bosentan, 35–50 µM) or 6 hours (rifampicin, 5–9 µM) prior to declining (Fig. 6). Both rifampicin (fu,hom = 0.194) and bosentan (fu,hom = 0.261) were extensively bound to hepatocyte homogenate, yielding fu,cell values of 0.0096 and 0.0139, respectively. Recovery was between 98 and 109%, confirming compound stability over the course of the incubation. The Kpuu,in vitro values were plotted as a function of time to determine the time at which Kpuu,in vitro reached steady state. By 24 hours, Kpuu,in vitro reached an average of 0.92 (rifampicin) and 2.9 (bosentan) at 24 hours (Fig. 6). For both bosentan and rifampicin, the Kpuu,in vitro values remained steady after 18 hours (Fig. 6), so follow-up studies were performed at the 24-hour time point. Kpuu,in vitro values can be concentration-dependent (Riccardi et al., 2016), so a follow-up study was performed in which the cell and medium concentrations were measured following incubation with the full range of inducer concentrations for 24 hours. The Kpuu,in vitro values decreased as the nominal concentrations of bosentan and rifampicin increased (Fig. 6; Supplemental Table 7), likely due to saturation of uptake transporters. For each nominal inducer concentration, the average unbound medium concentrations were multiplied by the corresponding Kpuu value to determine the average steady-state intracellular unbound concentration (Iu,cell,ave) (eq. 17). Iu,cell,ave was plotted against the fold induction, and the resulting Emax,u,cell and EC50,u,cell are reported in Table 5. For bosentan, correction for Iu,cell,ave resulted in EC50,u,cell (Table 5) values that were 2.3- and 2.8-fold higher than the measured EC50,u (Table 3) in donors CDP and Hu1624, respectively. Conversely, the EC50,u,cell values for rifampicin in donors CDP and Hu1624 (Table 5) were 38 and 84% of the measured EC50,u values, respectively (Table 1).

Intracellular concentrations and Kpuu,in vitro assessment for bosentan and rifampicin. The total intracellular concentrations of bosentan (A) and rifampicin (B) over time following incubation of cryopreserved human hepatocytes with 1 µM bosentan or 0.1 µM rifampicin. The Kpuu,in vitro of bosentan (C) and rifampicin (D) over time. The Kpuu,in vitro of bosentan (E) and rifampicin (F) following incubation of multiple concentrations of bosentan or rifampicin in cryopreserved human hepatocytes for 24 hours.
Prediction of In Vivo Kpuu.
Kpuu,in vivo was calculated according to eq. 20 using biliary clearance and metabolism data reported previously (Kobayashi et al., 2012; Varma et al., 2014). Active uptake and passive diffusion of bosentan and rifampicin were assessed in pooled suspension hepatocytes, and the results are reported in Table 4 and representative plots are shown in Supplemental Fig. 3. The in vivo hepatic clearance values previously reported by Loos et al. (1985) (rifampicin) and Weber et al. (1999) (bosentan) were underpredicted for both compounds, so scaling factors were applied to bosentan (SF = 4.3) and rifampicin (SF = 4.1) CLint,uptake to recover the estimated in vivo CLint,uptake (Table 4). Based on the data in Table 4, the Kpuu,in vivo values for bosentan and rifampicin after a single dose were 4 and 15.9, respectively.
Summary of input parameters for estimation of in vivo Kpuu for bosentan and rifampicin
The Impact of Intracellular Unbound Inducer Concentrations on Induction Predictions.
Incorporating the Emax,cell, EC50,u,cell, and Kpuu,in vivo values into R3 and AUCR predictions, the predicted decreases in simvastatin exposure were on average 76.5 and 76.8, respectively (Table 5). The magnitude of induction predicted using this method resulted in a higher degree of overprediction of bosentan than what was predicted using measured EC50,u and Cmax,u values (Tables 3 and 5). For rifampicin, the magnitude of induction using the R3 model was predicted to be roughly equivalent (93% DDI) regardless of whether Emax,cell, EC50,u,cell, and Kpuu,in vivo or Emax, EC50,u, and Cmax,u were used (Tables 1 and 5). However, Emax,cell and EC50,u,cell, resulted in a slightly lower predicted magnitude of DDI (96%) than when Emax, EC50,u, and Cmax,u were used (98%).
Rifampicin and bosentan induction predictions incorporating Kpuu
The limitation to using single-dose clearance data to predict Kpuu,in vitro is that they do not account for reported autoinduction of hepatic clearance for bosentan and rifampicin (Loos et al., 1985; Weber et al., 1999). To estimate Kpuu,in vivo after multiple doses, a new value for CLint,metab was calculated (Table 4) based on multiple-dose CLh (Loos et al., 1985; Weber et al., 1999) assuming no other elimination pathways were induced. The calculated CLint,metab value was then incorporated into eq. 20 to calculate Kpuu,in vivo following multiple doses. The resulting Kpuu,in vivo values were 0.59 and 14.7 for bosentan and rifampicin, respectively (Table 4). Using the multiple-dose Kpuu,in vivo, the predicted magnitude of induction for bosentan using both the R3 (38.5% DDI) and AUCR (41% DDI) models was in good agreement with the observed 34% DDI (Table 5). However, for rifampicin, predictions using multiple-dose Kpuu,in vivo versus single-dose Kpuu,in vivo were identical.
Discussion
Although cultured human hepatocytes are considered the “gold standard” in vitro system with which to assess CYP3A4 induction risk in the clinic (Chu et al., 2009), the dynamics of the system are not always accounted for, and DDI risk is generally based upon nominal concentrations of perpetrators (Almond et al., 2009). Furthermore, BSA (0–2%) is typically added to cell culture medium (Runge et al., 2000; Madan et al., 2003; Nishimura et al., 2007) as a supplement to increase overall cell health, block nonspecific binding sites, and improve the solubility of compounds with poor chemical properties (Francis, 2010). One caveat of including BSA in induction medium is that it can lower the concentration of free drug. Although inducer depletion and binding have previously been accounted for in induction predictions (Zhang et al., 2014; Chang et al., 2016), to date, no comprehensive study has been conducted to systematically investigate the impact of binding and depletion on induction predictions across multiple inducers and prediction methods. In the current evaluation, we sought to determine the measured and free concentrations of six clinical inducers and one noninducer of CYP3A4 in hepatocyte culture medium, and determine whether correction for these parameters can improve the accuracy of CYP3A4 induction predictions.
Medium concentrations were measured over the course of a dosing interval to assess the effects of nonspecific binding and metabolism of the seven compounds used in our study (Fig. 1). Parallel studies were conducted to assess the impact of protein binding on medium supplements in our studies (Table 1). After quantifying the perpetrator concentrations in the induction medium, various modeling approaches were used to assess whether correcting for measured and free concentration of perpetrator improve the accuracy and precision of the predictions. To evaluate prediction success, predictions were categorized as false-positive, false-negative, true-positive, or true-negative, and the accuracy and bias were assessed using RMSE and GMFE (Table 2). With respect to categorical predictions, the RIS model was the most reliable, resulting in no false-positive or false-negative predictions. Only two out of seven predictions gave a false-negative prediction when nominal EC50 values were used in each lot of hepatocytes with the R3 and mechanistic static predictions. The percentage of false negatives was reduced when measured EC50 values were used and were further reduced when unbound EC50 values were used. Similarly, the RIS model had the greatest accuracy and least bias, as evidenced by low RMSE and GMFE values, whereas the mechanistic static model had the highest values. After the RIS model, the mechanistic static model resulted in the greatest prediction accuracy. However, predicted induction magnitude using this model was higher for all of the compounds aside from pioglitazone and rosiglitazone (Supplemental Tables 4–6), and rifampicin induction was actually overpredicted. This trend toward overprediction of CYP3A4 induction is likely due to the incorporation of intestinal induction into the mechanistic static model. This suggests that the mechanistic static model may only be advantageous when an inducer also causes reversible and/or time-dependent inhibition. Across all of the models, the accuracy of the predictions was greatest when both binding and medium concentrations were considered.
The observation that measured EC50 values resulted in more accurate predictions is in contrast to findings from Zhang et al. (2014) who measured medium concentrations of 20 compounds at the 24-hour time point on the last day of incubation. For six compounds, measured concentrations of the perpetrator were <20% of the nominal concentrations. For these six compounds, the authors determined the average concentration by taking the average of the nominal and measured 24-hour concentrations. The EC50 values were then corrected by using the estimated average medium concentration. However, correction of the EC50 values for the six compounds did not improve the RMSE and GMFE for any parameter. One possible explanation for this discrepancy is that nonspecific binding was not considered. By estimating the average medium concentration from the average of the nominal and 24-hour concentrations, one assumes that the loss of compound from the medium is due to linear depletion. However, extensive nonspecific binding to the cells or plate could result in an immediate reduction in medium concentration, as was observed for pleconaril in the present study, where only ∼8% remained after a 24-hour incubation period (Table 1). The significant loss of pleconaril in the induction medium was observed at both 4°C and 37°C, with a greater loss observed at 37°C, indicating that the loss of pleconaril may be caused by both metabolism and nonspecific binding (to cell plates and/or hepatocytes). In such a case, the method used by Zhang et al. (2014) would be expected to overestimate the average medium concentration and underestimate the reduction in the EC50, potentially preventing prediction improvements. A second potential reason why the use of calculated average medium concentrations may not have improved predictions in the studies by Zhang et al. (2014) is that medium protein binding was not accounted for. The six compounds with low medium recovery (troglitazone, terbinafine, pleconaril, omeprazole, clotrimazole, and nifedipine) are highly bound in plasma.
In addition to accounting for depletion and binding in the determination of in vitro induction parameters, we hypothesized that estimating Emax and EC50 values based on unbound intracellular concentrations may improve predictions for CYP3A4 inducers that are transporter substrates. Bosentan and rifampicin are both permeability-limited substrates of OATP1B1 and OATP1B3, so the ratio of unbound intracellular concentrations to unbound medium concentrations (Kpuu,in vitro) cannot be assumed to equal 1. Bosentan induction was overpredicted by roughly 2-fold when measured EC50,u and Cmax,u values were used in predictions. We hypothesized that this was due to free cell concentrations exceeding free medium concentrations. As a result, EC50 values based on free medium concentrations would overestimate the true induction potency. In the current study, a concentration-dependent range of Kpuu,in vitro values was observed for rifampicin (0.3–1.5) and bosentan (0.5–7.5) across the inducer concentrations used to fit the Emax,u,cell and EC50,u,cell. Fitting the Emax,u,cell and EC50,u,cell resulted in EC50 values that were 2.6 (bosentan) and 0.6 (rifampicin) times the measured EC50,u. The higher EC50,u,cell estimate was consistent with the hypothesis that the measured EC50,u overestimated bosentan induction potency, and resulted in improved predictions for bosentan when the predicted multiple-dose Kpuu,in vivo (0.6) was used, which accounted for autoinduction of bosentan metabolism. Unlike bosentan, rifampicin predictions were not dramatically affected by corrections for binding, depletion, or intracellular concentrations. The reason for the lack of change for rifampicin predictions is because, in all cases, the in vivo inducer concentration used in the predictions greatly exceeded the EC50 (>10 fold), and thus the predicted fold induction was equivalent to 1 + Emax.
To date, numerous methods have been proposed for determining intracellular unbound concentrations of drugs; however, as highlighted in a recent white paper, no systematic evaluation has been conducted to determine which method is the most reliable (Ulvestad et al., 2011; Zhu et al., 2014). Estimation of the fu,cell using cell homogenate has been widely used in recent years (Mateus et al., 2013; Chien et al., 2016; Riccardi et al., 2016). Furthermore, the Kpuu,in vitro values estimated using this method were reported to be in agreement with the fold difference in IC50 estimated in human liver microsomes versus cell lines, providing confidence in the estimated fu,cell (Riccardi et al., 2016). However, a major limitation of this method is that it does not account for sequestration of drug into subcellular organelles (Chu et al., 2013; Kazmi et al., 2013). Because rifampicin and bosentan are acids, pH-driven lysosomal and mitochondrial trapping is not anticipated in the present study but may be a deterrent for using the homogenization approach to determine fu,cell for weak bases (Duvvuri et al., 2004; Ufuk et al., 2015).
Use of static models to predict Kpuu,in vivo (Barton et al., 2013; Varma et al., 2014) also poses limitations for the performance of predictions. Time-dependent changes in metabolism and transport can affect the Kpuu,in vivo estimate, and are not captured by static models. In this study, the Kpuu,in vivo after multiple days of bosentan or rifampicin treatment was estimated by adjusting the CLint,metab so that the CLint,h matched the in vivo CLint,h following multiple doses (Loos et al., 1985; Weber et al., 1999). However, this does not capture the time-dependent changes in Kpuu,in vivo, which could have an impact on induction predictions. Given the limitation of this approach, efforts are ongoing in our laboratory to assess the impact of the Kpuu estimates using dynamic mechanistic models rather than the static models.
In conclusion, data indicate that quantitating NCE levels in induction medium by correcting for specific binding to medium proteins, nonspecific binding, and measured medium concentrations (Cave) can improve the accuracy and precision of CYP3A4 induction predictions. Further work needs to be conducted to understand the impact of free intracellular concentrations (Kpuu) of NCEs on predictions when compounds are known to be substrates of uptake transporters and inducers of CYP3A4.
Authorship Contributors
Participated in research design: Sun, Chothe, Sager, Tsao, Moore, Laitinen, Hariparsad.
Conducted experiments: Sun, Chothe, Sager, Tsao, Moore, Laitinen.
Performed data analysis: Sun, Chothe, Sager, Tsao, Moore, Laitinen.
Wrote or contributed to the writing of the manuscript: Sun, Chothe, Sager, Tsao, Moore, Laitinen, Hariparsad.
Footnotes
- Received February 15, 2017.
- Accepted March 21, 2017.
↵
 This article has supplemental material available at dmd.aspetjournals.org.

Abbreviations
- AUC
- area under the curve
- AUCR
- area under the curve ratio
- BSA
- bovine serum albumin
- CDP
- XXX
- DDI
- drug-drug interaction
- GAPDH
- glyceraldehyde-3-phosphate dehydrogenase
- GMFE
- geometric mean fold error
- MSM
- mechanistic static model
- NCE
- new chemical entity
- RED
- rapid equilibrium dialysis
- RIS
- relative induction score
- RMSE
- root mean square error
- TDI
- time-dependent inhibition
- Copyright © 2017 by The American Society for Pharmacology and Experimental Therapeutics


