


Abstract
(S)-5, 6-Difluoro-4-cyclopropylethynyl-4-trifluoromethyl-3, 4-dihydro- 2-(1H)-quinazolinone (DPC 963), a specific non-nucleoside inhibitor of human immunodeficiency virus-1 reverse transcriptase, is primarily metabolized in humans to the glucuronide conjugate of 8-OH DPC 963 (M8). Electrospray ionization-liquid chromatography/mass spectrometry analyses of urine from subjects dosed with DPC 963 also revealed the presence of other minor metabolites including glucuronide conjugate of 6-OH DPC 963 (M7). An oxidative defluorination pathway involving a putative p-benzoquinone imine capable of being reduced to the hydroquinone (M7) is postulated. The formation of the benzoquinone imine [detected as a glutathione (GSH) adduct, M5] was primarily carried out by CYP3A4, whereas M8 was formed mainly by the polymorphic CYP2B6. The kinetic studies with human liver microsomes showed that the apparentKm and Vmax values for the formation of M5 were 65.8 μM and 25.6 pmol/min/mg of protein, respectively. The formation of M8 showed Km andVmax values of 15.1 μM and 22.9 pmol/min/mg of protein, respectively. The microsomal studies also revealed the occurrence of a possible oxirene intermediate that was trapped as GSH adducts M3 and M4. It was demonstrated, for the first time, that CYP3A4 was capable of directly oxidizing the triple bond of the cyclopropyl ethynyl group to an unstable oxirene. The apparentKm and Vmax values for the formation of an oxirene (detected as the GSH adduct M3) were 1.9 mM and 10.2 pmol/min/mg of protein, respectively. These results suggest that CYP2B6 has a higher affinity than CYP3A4 toward DPC 963. This consequently leads to greater levels of CYP2B6-catalyzed product, M8, than CYP3A4-mediated bioactivation of DPC 963 to benzoquinone imine or oxirene intermediates.
The effective treatment of HIV1 infection and acquired immunodeficiency syndrome is still difficult despite tremendous advances in our understanding of the pathogenesis of the disease and the arrival of potent drug aimed at different, critical targets in the life cycle of the virus. Clearly, optimal treatment involves multiple drug therapy designed to decrease the viral burden as low as possible. (S)-5,6-Difluoro-4-cyclopropylethynyl-4-trifluoromethyl-3,4-dihydro-2(1H)-quinazolinone (DPC 963) is a potent non-nucleoside inhibitor of the HIV-1 reverse transcriptase, and has been evaluated in clinic for the treatment of HIV infection. To more fully understand the disposition of this agent, the in vivo and in vitro metabolism of DPC 963 was studied in humans.
The metabolic disposition of DPC 963 has been described in rats (Chen et al., 1999, 2002). The various metabolic pathways leading to diconjugates (M1, M2), glutathione conjugates (M3-M6), defluorinated metabolite (M7), a ring-hydroxylated metabolite (M8), glucuronide conjugates (M9 and M10), and a sulfate conjugate (M11) are shown in SchemeFS1. The major metabolite was found to be the glucuronide conjugate (M9) of 8-OH DPC 963 (Scheme FS1) consistent with previous findings from close structural analogs, efavirenz and DPC 961 (Mutlib et al., 1999, 2000). The structures of these metabolites suggested the existence of multiple metabolic pathways, some of which led to potentially reactive metabolic intermediates. One of the pathways described included an oxidative defluorination mediated by cytochrome P450 to a putativep-benzoquinone imine intermediate, which underwent either a two-electron reduction to the hydroquinone (M7) or conjugation with GSH to produce two regio-isomeric adducts (M5 and M6, Scheme FS1). It was also demonstrated that rat P450 3A was capable of oxidizing the triple bond of the cyclopropyl ethynyl group to an unstable oxirene intermediate that subsequently rearranged to an α, β-unsaturated cyclobutenyl ketone species, which was trapped as GSH adducts (M3 andM4, Scheme FS1).
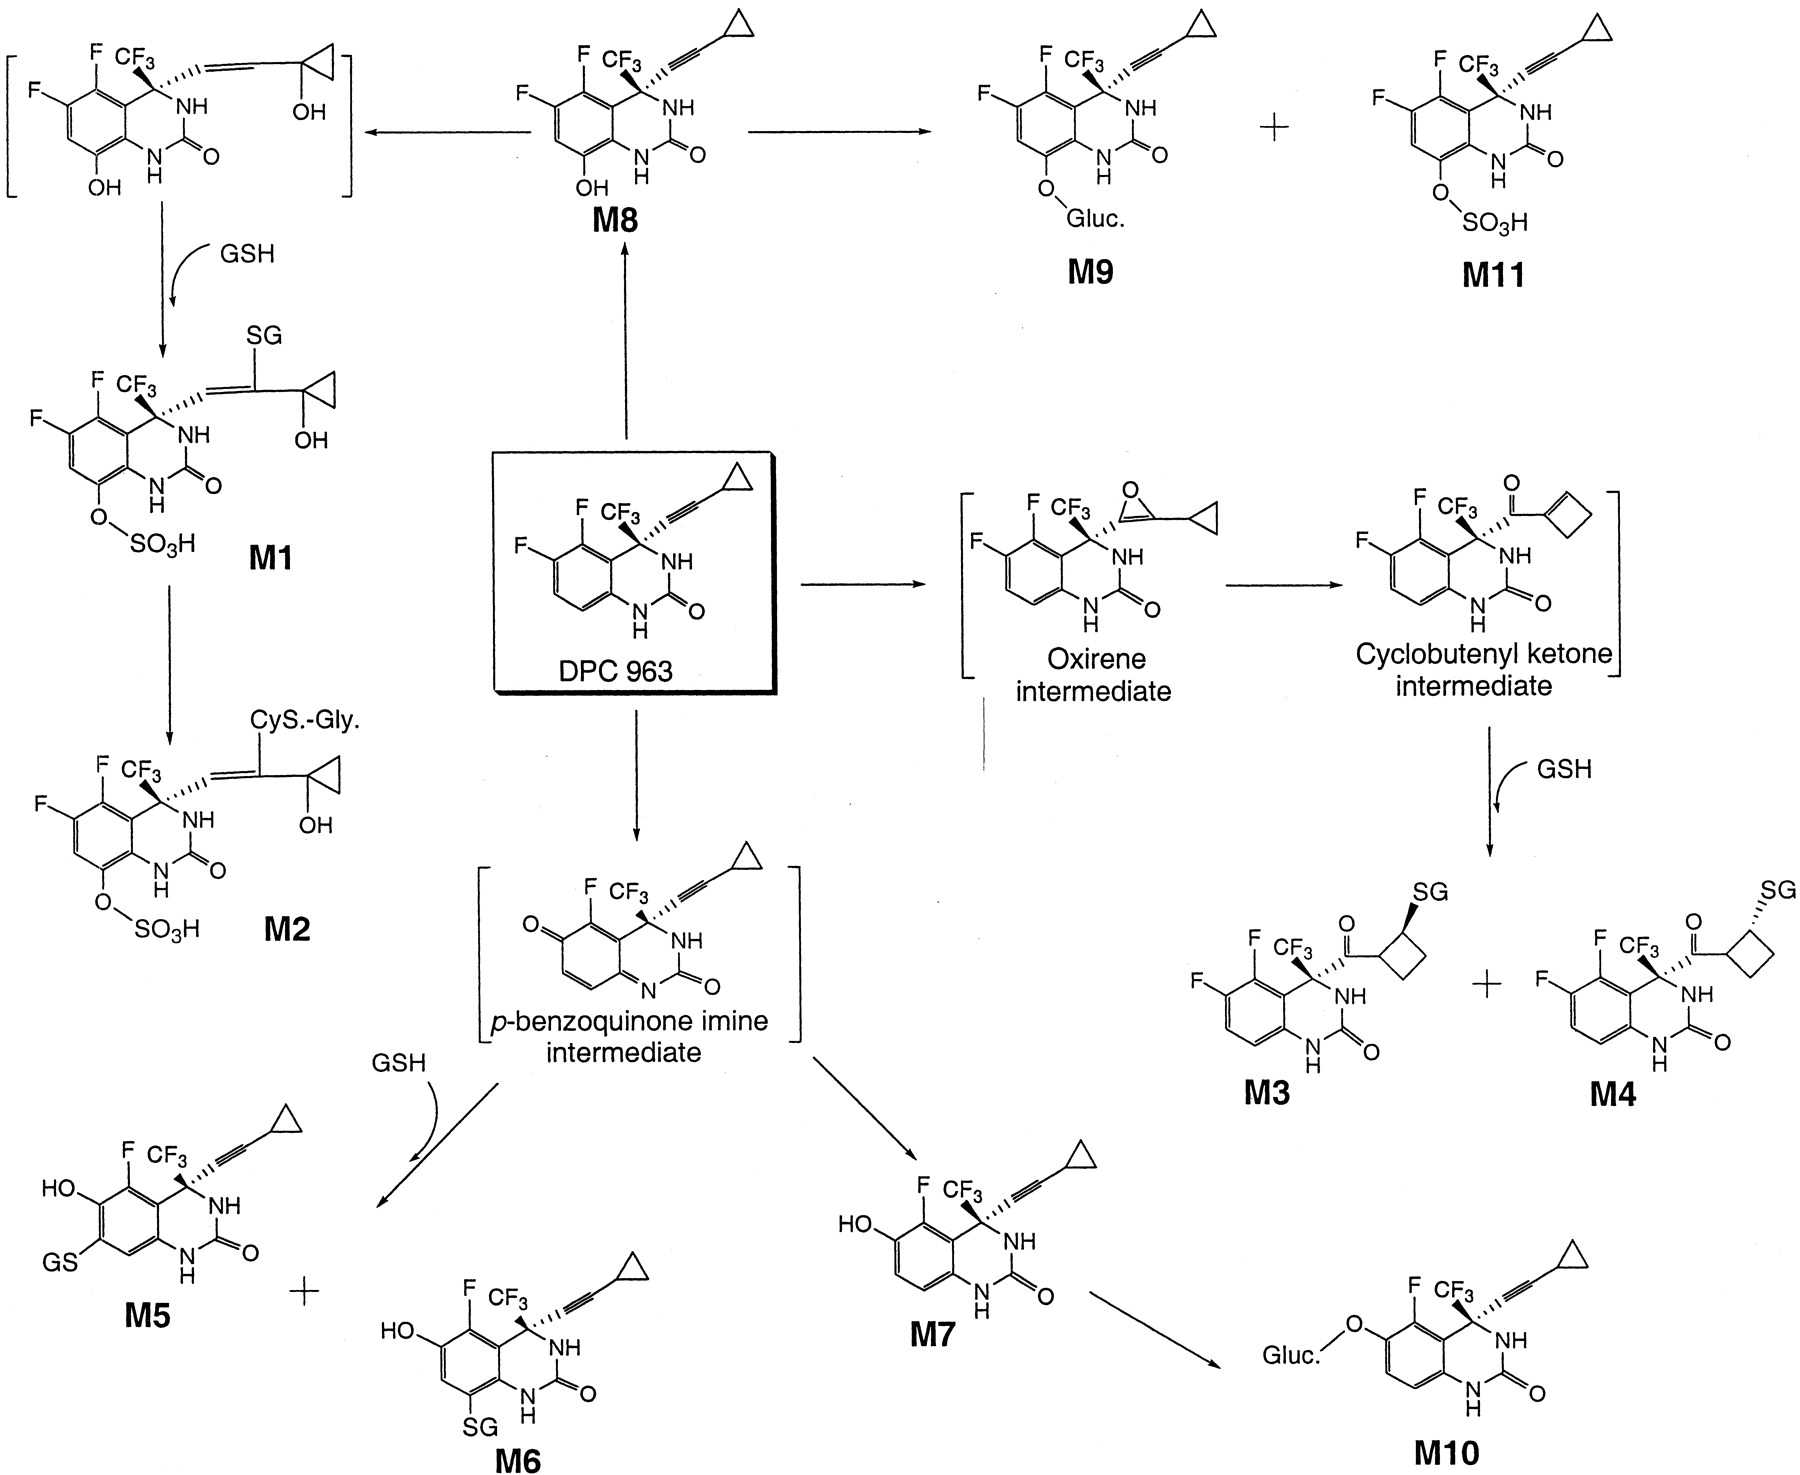
Proposed metabolic pathways of DPC 963 in rats.
The disposition of DPC 963 was investigated in humans to compare with the metabolic pathways previously described in rats. Preliminary metabolic profiles of human and rat urine suggested that there was a potential species differences in the metabolism of DPC 963, since GSH-related conjugates (e.g., cysteine or N-acetyl cysteine adducts) derived from benzoquinone imine or cyclobutenyl ketone intermediate were not found in human urine. It was of considerable interest to us to further investigate the metabolism of DPC 963 in vitro using human liver microsomes, especially to see if such reactive intermediates were also formed. Furthermore since the GSH-derived adducts were not found in human urine or plasma, the relative significance of the various metabolic routes including ring hydroxylation and bioactivation pathways was investigated. The enzyme kinetics for the formation of the major metabolite M8 and potentially reactive metabolites (trapped as GSH adducts, M3and M5) were determined and compared.
We also aimed to identify the human P450 enzyme(s) responsible for the metabolic activation and major metabolic pathway of DPC 963 using various in vitro techniques. To confirm the isozymes responsible for forming the reactive intermediates, microsomal incubations were performed employing antibodies or selective chemical inhibitors directed against specific P450s. The results were confirmed by carrying out incubations with various human cDNA-expressed P450 isozymes. Measurement of the contribution of individual P450 isozymes involved in the metabolism of drugs can have important implications for interindividual variability because some P450 isozymes are expressed in widely variable amounts due to environmental or genetic factors. In addition, such knowledge can provide a better understanding of the potential of metabolic drug-drug interactions and their effects on the efficacy and toxicity.
Materials and Methods
Chemicals and Supplies.
DPC 963 was synthesized as described previously (Corbett and Ko, 1998). Metabolites (M3-M6) were isolated and characterized as previously (Chen et al., 2002). MetaboliteM9 was isolated and characterized from rat bile, and the generation of M8 was carried out by β-glucuronidase-catalyzed hydrolysis of M9 (see below). The purity of the M3, M5, and M8 was established by liquid chromatograph/mass spectrometry (LC/MS) and NMR to be greater than 95%, prior to use as standards for quantitation. The internal standards, 8-OH efavirenz (Pierce et al., 1988) andS-benzyl glutathione conjugate (Mutlib et al., 2002), were synthesized and characterized spectroscopically before being used for quantitative assays. Waters Symmetry C18 columns (2.1 × 150 mm, 5 μm) were obtained from Waters Corporation (Milford, MA). Luna phenyl-hexyl columns (2.0 × 50 mm, 5 μm) were purchased from Phenomenex (Torrance, CA). Human liver microsomes (pooled from 10 individuals), human supersomes expressing different P450 isoenzymes (1A2, 2A6, 2B6, 2C8, 2C9, 2C19, 2D6, and 3A4) and preimmune IgG, and monospecific polyclonal antibody against P450 1A2, 2A6, 2B6, 2C8/9/19, 3A4 were obtained from BD Gentest Corp. (Woburn, MA). The chemical inhibitors for human P450s including orphenadrine (2B6), sulfaphenazole (2C9), and troleandomycin (3A4) were obtained from Aldrich Chemical Co. (Milwaukee, WI) whereas furafylline (1A2) was purchased from Sigma/RBI (Natick, MA). Ketoconozole (3A4) was obtained from ICN Pharmaceuticals Biochemicals Division (Aurora, OH). All solvents and reagents were of the highest grade commercially available.
Synthesis (Enzymatic) of Metabolite M8.
The glucuronide conjugate (M9, Scheme FS1) was isolated from the bile of rats by employing a previously described method (Chen et al., 2002). Briefly, the glucuronide conjugate (M9) was extracted from the bile samples using C18 solid phase extraction cartridges. The extracted sample was further purified on a Symmetry C18 HPLC column (3.9 × 150 mm) using a mixture of acetonitrile/0.05% trifluoroacetic acid as the mobile phase. The percentage of acetonitrile was increased from 10 to 70 in 18 min, which was delivered at a flow rate of 1.0 ml/min. The peak containing M9, which was confirmed by LC/MS analyses, was collected from several injections, pooled, and dried under vacuum to give the white powder (∼7 mg). The sample was analyzed by LC/MS/MS and shown to have [M − H]− atm/z 507 with characteristic fragment ions atm/z 175 (glucuronic acid) and 331 (− glucuronic acid). 1H LC/NMR: δ 0.85 (4H, m, cyclopropyl-CH2), 1.25 (1H, m, cyclopropyl-CH), 3.52–3.65 (3H, m, glucuronic acid 2′,3′,4′-H), 4.05 (1H, d, glucuronic acid 5′-H), 4.84 (1H, d, glucuronic acid 1′-H), 7.28 (1H, dd, aromatic-H).
The isolated M9 was dissolved in 1 ml of potassium phosphate buffer (0.1 M, pH 6.5) containing β-glucuronidase (1000 units). The mixture was incubated at 37°C. After 3 h, the reaction mixture was purified by HPLC using a Symmetry C18 column (3.9 × 150 mm). The column was eluted with a mixture of acetonitrile/0.05% trifluoroacetic acid (40/60, v/v) delivered at a flow rate of 1.0 ml/min. The peak corresponding to M8 was collected and analyzed by LC/MS. The fractions containing M8were pooled and dried under vacuum to give approximately 4 mg of the compound ([M − H]− at m/z331).
Liquid Chromatography/High Field NMR.
All the spectra were obtained using a Bruker Avance 600 MHz NMR spectrometer (Bruker, Karlsruhe, Germany) equipped with a1H/13C LC/NMR flow-probe with a cell volume of 120 μl. Suppression of the residual water and acetonitrile signals was carried out using the WET solvent suppression method in all the LC/NMR experiments (Smallcombe et al., 1995). Proton chemical shifts were referenced to acetonitrile at δ 2.0 ppm. Signal multiplicities are reported as follows: s (singlet), d (doublet), t (triplet), q (quartet), dd (double of doublets), and m (multiplet). An HP1100 LC system (Agilent Technologies, Wilmington, DE) was used with a variable wavelength UV detector set at 240 nm. A C18 HPLC column (Waters Symmetry, 3.9 × 150 mm, 5 μm) was used to separate DPC 963 metabolites. A gradient from 25% acetonitrile-d3 to 80% acetonitrile-d3 over 20 min at a flow rate of 0.8 ml/min was employed during LC/NMR analysis. The aqueous component of the mobile phase consisted of deuterated water. Both solvents contained 0.05% trifluoroacetic acid. The characterization of M9 was performed by 1D-NMR as well as by total correlated spectroscopy 2-dimensional NMR.
LC/MS.
LC/MS was carried out by coupling an HPLC system to a triple-stage quadrupole mass spectrometer (PE-Sciex API 300, Toronto, Ontario). HPLC was performed using an HP1100 binary pump coupled in sequence to an HP1100 autosampler and to a column. The HPLC effluent was introduced into the source using a turbo ionspray interface held at 450°C. The electrospray needle was maintained at 4200 to 5000 V with the declustering potential set at 30 to 40 V. Ultrapure nitrogen was used as the nebulizer gas set at 40 psi. The turbo ionspray gas flow rate was 6 l/min. The mass spectrometer was operated either in the positive or negative ion modes to achieve optimum sensitivity for metabolites. MS/MS analysis was carried out using nitrogen as the collision gas. The collision energy was kept at 30 to 40 eV. The output signal from the mass spectrometer was interfaced to a computer operating Analyst 1.1 software (PE-Sciex) for data collection, peak integration, and analysis.
To characterize GSH adducts in the incubation mixture, the mass spectrometer was operated in the positive ion mode with a scan range of 100 to 800 Da for both full scans and MS/MS analysis. To obtain the full profile of metabolites present in the urine of DPC 963-dosed subjects, the mass spectrometer was operated in the positive ion mode as well as in the negative ion mode. The metabolites were separated on a Waters Symmetry C18 column (2.1 × 150 mm, 5 μm) by a gradient solvent system consisting of acetonitrile and 10 mM ammonium formate (pH 4.1). The percentage of acetonitrile was increased from 20 to 80% over 18 min with the solvent flow rate set at 0.4 ml/min. After 18 min, the column was washed with 80% acetonitrile for 2 min before re-equilibrating with the initial mobile phase. Aliquots (20–50 μl) of raw urine or reconstituted samples were injected onto the column.
Quantitation of Metabolites by LC/MS.
To quantitate the metabolites (M3, M5, andM8) present in the incubation mixtures, the mass spectrometer was operated in the multiple reaction monitoring (MRM) mode with a dwell time of 200 msec. The transitions monitored during the MRM analysis included M3, m/z 640.1 → 333.0; M5, m/z 620.1 → 345.2; M8,m/z 331.3 → 261.1; 8-OH efavirenz m/z 330.1 → 257.9; S-benzyl GSH conjugate m/z 398.1 → 252.1. The MRM analysis was conducted in such a way that the first 7.5 min of acquisition was carried out in the positive ion mode forM3, M5, and the internal standard (benzyl GSH conjugate). The polarity of the mass spectrometer was changed at 7.6 min to the negative ion mode to quantitate M8 using the internal standard (8-OH efavirenz). After 12 min, the column was re-equilibrated with the initial mobile phase for 4 min before the next injection. The peak-area ratios of analytes to the internal standards were used for the construction of calibration curves. Because of the limited quantity of metabolites available, the production of each metabolite present in the P450 characterization experiments (see below) was obtained by the peak areas measured by LC/MS operated in the selected ion monitoring mode (SIM). The mass spectrometer was operated in a two-period mode similar to the method described above; the positively charged pseudomolecular ions ([M + H]+) of M3/M4 andM5/M6 at m/z 640 and 620, respectively, were acquired from 0 to 7.5 min, and then the negatively charged pseudomolecular ion ([M − H]−) of M8 at m/z 331 was acquired between 7.6 and 12 min. The ions were monitored using the first quadrupole. For both MRM and SIM acquisitions, the metabolites were eluted on a Luna phenyl-hexyl column (2.0 × 50 mm) by a gradient solvent system consisting of a mixture of acetonitrile/methanol (1:1 v/v) and 1 mM ammonium formate (pH 4.1). The percentage of organic was increased linearly from 10 to 50% over 7 min followed by a linear ramp to 90% in 3 min. The column was brought back to the initial conditions within the next 2 min. The solvent flow rate was set at 0.4 ml/min. Under this condition, M3, M4, M5, andM6 were well separated from each other. The column was equilibrated with the initial conditions for 4 min before next injection. Aliquots (10–30 μl) of reconstituted samples were injected onto the column.
Standard Solutions.
Separate standard solutions of M3, M5, andM8 were prepared using acetonitrile/methanol/1 mM ammonium formate buffer (pH 4.1) (5:5:90, v/v) in volumetric flasks to give concentrations of 1 mg/ml each. The stock solutions were diluted in series with the solvent system to prepare solutions of known concentrations (10, 25, 40, 100, 200, 400, and 800 ng/ml) ofM3, M5, and M8 for quantitative studies. A working internal standard solution of 500 ng/ml was used during the entire assay. The stock solutions were kept refrigerated and discarded after one month. The working standards were prepared fresh daily.
Linearity, Specificity and Calibration Standards.
Linearity of the calibration curves for each metabolite was assessed over a concentration range of 10 to 800 ng/ml. Control samples in microsomes were spiked to give concentrations of 10, 25, 40, 100, 200, 400, and 800 ng/ml of M3, M5, and M8. Internal standards were added to each sample prior to the extraction. The linearity of each standard curve was confirmed by plotting the ratios of the metabolite to internal standard peak areas versus metabolite concentrations. The specificity of the assay was checked by analyzing a number of blank microsomal extracts for interferences prior to quantitating metabolites. A set of seven calibration standards in duplicate was analyzed with each run. A weighted (1/x) linear least-squares regression of the concentrations and measured peak area ratios was used to construct the calibration curves.
Analysis of Human Urine.
Pooled urine samples collected on day 10 (0–24 h) were obtained from eight subjects given oral doses of DPC 963 (200 mg daily for 10 days). The urine samples were kept at −20°C until assayed. After thawing at room temperature, the urine samples were mixed well and centrifuged. Aliquots (20–50 μl) of supernatants were directly injected onto the column and analyzed by LC/MS to obtain the metabolite profile.
Identification of GSH Conjugates Produced in Human Liver Microsomes.
Microsomal incubations were carried out using the following protocol: human liver microsomes (4 mg), ±NADPH (2 mM), GSH (5 mM), MgCl2 (3 mM), DPC 963 (1 mM), with the final volume adjusted to 1.0 ml with 0.1M phosphate buffer (pH 7.4). The reaction was run for 30 min and terminated by the addition of 2 ml of ice-cold acetonitrile. The samples were vortexed and centrifuged. The supernatant was separated and dried under nitrogen. The dried extracts were reconstituted in 200 μl of the HPLC mobile phase and aliquots analyzed by LC/MS operated in full scan and MS/MS modes. Metabolic activation of DPC 963 was demonstrated by LC/MS detection of the respective GSH adducts (M3-M6) present in the incubation extracts. These adducts were confirmed by comparing the LC/MS retention times and mass spectral data (MS/MS) with characterized metabolites isolated from in vivo rat studies (Chen et al., 2002).
Characterization of the P450 Responsible for the Formation of M3-M6 and M8.
To investigate the P450 enzymes responsible for the formation ofM8 and benzoquinone imine and oxirene intermediates, which were trapped as GSH adducts M3-M6, the in vitro formation of the respective metabolites was studied using selective chemical inhibitors and commercially available antibodies against the human P450 isozymes. To further characterize the role of P450 isozyme(s) involved in a particular reaction, incubations of DPC 963 with cDNA-expressed human P450 enzymes either in the presence or absence of GSH were carried out. The production of each metabolite present in the incubation extracts was monitored by peak areas measured by LC/MS operated in the selected ion monitoring mode.
1) Inhibitory Studies with Antibodies.
Incubations were performed in triplicate consisting of human liver microsomes (0.2 mg), anti-human P450 enzyme polyclonal antiserum or anti-human P450 antibody (20 μl), MgCl2 (3 mM), NADPH (1 mM), DPC 963 (50 μM), and 0.1 M phosphate buffer (pH 7.4) in the absence or presence of GSH (2 mM) in a final volume of 0.5 ml. The volume of 20 μl of anti-human P450 antibody was chosen based on the recommendations of the manufacturer (BD Gentest Corp.). Microsomes were preincubated with individual antibodies for 30 min at room temperature, followed by the addition of other components. The incubations were carried out for 30 min at 37°C, after which the reaction was terminated by addition of 1 ml of ice-cold acetonitrile. The samples were extracted, reconstituted, and analyzed by LC/MS SIM.
2) Inhibitory Studies with Chemical Inhibitiors.
Inhibition of the formation of M3-M8 was assessed by well characterized chemical inhibitors of P450s (Newton et al., 1994). The incubations, done in triplicate, consisted of microsomes (0.2 mg), NADPH (1 mM), MgCl2 (3 mM), ±GSH (2 mM), and various chemical inhibitors used at two concentrations. The stock solutions of the chemical inhibitors as well as DPC 963 were prepared in methanol. The final methanol concentration in each incubation was below 1.0%. The following selective inhibitors were examined for their effect: furafylline (10 and 50 μM), orphenadrine (250 and 500 μM), sulfaphenazole (10 and 50 μM), troleandomycin (1 and 10 μM), and ketoconazole (1 and 5 μM). Furafylline, orphenadrine, and troleandomycin were preincubated for 20 min with microsomes MgCl2 and NADPH in the absence or presence of GSH before adding DPC 963 (50 μM). The volume of incubation was adjusted to 0.5 ml with 0.1 M phosphate buffer (pH 7.4). The incubations were carried out for 30 min at 37°C. Sulfaphenazole, or ketoconazole, was coincubated with microsomes, DPC 963 (50 μM), and NADPH in the absence or presence of GSH (2 mM) for 30 min at 37°C. The volume of incubation was adjusted to 0.5 ml with 0.1 M phosphate buffer (pH 7.4). To terminate the reaction, 1 ml of ice-cold acetonitrile was added to the incubation mixtures. The samples were extracted, reconstituted, and analyzed by LC/MS SIM.
3) cDNA-Expressed P450 Supersome Incubations.
To confirm which human isozyme was responsible for the formation ofM3-M8, incubations (in triplicate) were carried out with commercially available human P450 supersomes including 1A2, 2A6, 2B6, 2C8, 2C9, 2C19, 2D6, and 3A4. Each of these supersomes consisted of the cytochrome P450, the P450 reductase, and cytochromeb5. The incubation mixtures consisted of the supersomes (10 pmol of P450), NADPH (1 mM), ± GSH (2 mM), DPC 963 (50 μM), MgCl2 (3 mM), and 0.1 M phosphate buffer. The final volume of incubation was adjusted to 0.5 ml. The mixtures were incubated for 30 min at 37°C, after which the reactions were terminated by addition of 1 ml of ice-cold acetonitrile. The samples were vortexed and centrifuged at 1600g for 10 min. The supernatant was separated and dried under nitrogen. The dried extracts were reconstituted in the HPLC mobile phase and aliquots analyzed by LC/MS SIM.
Kinetic Studies.
In preliminary experiments, the incubation time and the amount of microsomal protein with regard to metabolite formation were determined to establish conditions of reaction linearity. It was shown that the production of all three metabolites (M3, M5, andM8) was linear up to 30 min and with microsomal protein concentration of less than 0.5 mg/ml. The formation of M3,M5, and M8 in the pooled human liver microsomes was determined at substrate concentrations ranging from 5 to 5000 μM. Incubations (in triplicate) were performed using the following protocol: 0.2 mg microsomal protein, ±2 mM GSH, 3 mM Mg2Cl2, 1 mM NADPH in a final volume adjusted to 0.5 ml with 0.1 M phosphate buffer (pH 7.4). Control experiments using the incubation medium without NADPH were run in parallel. The reaction was carried out for 30 min at 37°C and terminated by the addition of 1 ml of ice-cold acetonitrile containing the internal standards. The samples were vortexed, centrifuged, and the supernatant removed and dried under nitrogen. The dried extracts were reconstituted in the HPLC mobile phase and aliquots analyzed by LC/MS. The concentrations of each metabolite obtained at each substrate level were calculated from standard curves prepared in the range 10 to 800 ng/ml for each metabolite.
Data Analysis.
All results obtained from the enzyme kinetic and P450 identification studies are presented as the mean ± S.D. The kinetic parameters (Km,Vmax) were determined by nonlinear regression analysis based on the Michaelis-Menten equation using the WinNonlin software (Pharsight Corp., Mountain View, CA). The statistical difference was tested with an unpaired t test and judged significant if p < 0.05.
Results
Characterization of Glucuronide Conjugates of M7 and M8 in Human Urine.
As shown in Fig. 1, the most abundant metabolite present in human urine, based on LC/MS total ion current and LC/UV chromatogram (data not shown), was identified as the glucuronide conjugate of mono-hydroxylated DPC 963. LC/MS/MS analyses of this metabolite exhibited a characteristic loss of a glucuronic acid group (176 amu) from the parent ion ([M − H]−at m/z 507). The mass difference (331 versus 315) between the aglycone of this metabolite and DPC 963 suggested the addition of one oxygen atom. This glucuronide conjugate was confirmed asM9 by comparing its LC/MS retention time and MS/MS spectral data with characterized metabolite isolated from rat bile (seeMaterials and Methods). In addition to the major metabolite, MS/MS analyses of a minor metabolite with the retention time at 7.4 min (Fig. 1) showed a characteristic loss of a glucuronic acid moiety (176 amu) from the parent ion ([M − H]− atm/z 489). The 2 amu in mass difference (315 − 313 = 2) between DPC 963 and the aglycone of this metabolite indicated that an oxygen atom had replaced one of the fluorine. Confirmation of this metabolite as a glucuronide conjugate of M7 was carried out by comparing its LC/MS retention time and MS/MS spectral data with previously characterized metabolite standard (Chen et al., 2002).

LC/MS total ion current of urine (day 10, 0–24 h) from a human subject given 200 mg of DPC 963 for 10 consecutive days.
Characterization of GSH Adducts (M3-M6) Derived from Cyclobutenyl Ketone and Benzoquinone Imine Intermediates Produced by Human Liver Microsomes.
Metabolites M3-M6, previously isolated from rat bile, were characterized by LC/MS and NMR (Chen et al., 2002). These metabolites were also produced by human liver microsomes fortified with GSH. Metabolites M3 and M4 (diastereoisomers) showed the pseudomolecular ion ([M + H]+) atm/z 640 whereas metabolites M5 and M6(regio-isomers) produced ([M + H]+) atm/z 620. The MS/MS spectra of these conjugates produced by human liver microsomes are shown in Figs.2 and 3, respectively. The MS/MS fragmentations of these GSH adducts produced characteristic ion fragments that were used for quantitative studies. However, because of similar mass spectral fragmentations, the isomers had to be chromatographically resolved from each other. The identities of metabolites M3-M6 present in human liver microsomes were confirmed by comparing the LC/MS retention time and MS/MS spectral data with the previously characterized metabolites isolated from rat bile (Chen et al., 2002).

MS/MS spectra of the GSH adductsM3 and M4, both with ([M + H]+ at m/z 640), found in human liver microsomes.

MS/MS spectra of the GSH adductsM5 and M6, both with ([M + H]+ at m/z 620), found in human liver microsomes.
Characterization of the Human P450 Responsible for the Formation of M3 - M8.
In vitro studies using the anti-human P450 antibodies, selective chemical inhibitors, and cDNA-expressed enzymes were employed to identify the human P450 enzyme(s) responsible for the formation of GSH adducts M3-M6 and phenol metabolitesM7 and M8. When the anti-human P450 3A4 antibody was incubated with microsomes, the production of M3 andM5 was decreased by 75 and 78% (Fig.4), respectively, as compared with the control incubation performed with preimmune IgG. The formation ofM7 was reduced by 60% as well (data not shown). In contrast, studies carried out with the antibody against P450 1A2, 2A6, and 2B6 showed little or no effect on the formation of M3,M5, and M7, except the anti-human P450 2C antibody, which showed about 25 to 30% inhibition on the formation ofM3 and M5 (Fig. 4) as well as M7 (data not shown). A similar level of inhibition (data not shown) on the formation of M4 and M6 by the anti-human P450 3A4 or 2C antibody was also observed. When the anti-human P450 3A4 and 2C antibodies were added together to the incubation, this resulted in a maximal inhibition (>95%) on the production of M3 andM5 (Fig. 4) as well as M7 (data not shown). Incubation of microsomes in the presence of troleandomycin (10 μM) resulted in marked inhibition on M3-M6 andM7 by 80 and 60%, respectively, whereas ketoconzole (1 μM) caused 68 to 85% inhibition on the formation ofM3-M7. On the other hand, the inhibitors for other P450 enzymes [furafylline (50 μM), orphenadrine (250 μM), and sulfaphenazole (50 μM)] had no effect on the production ofM3-M7 at concentrations previously shown to produce significant inhibition of P450 activities (Newton et al., 1994). Furthermore, the studies using cDNA-expressed human P450 enzymes demonstrated a marked difference in the formation ofM3-M7 (see Fig. 4 for M3 andM5). It was clearly demonstrated that the human CYP3A4 was a dominant enzyme in producing the defluorinated metabolite (M7) as well as electrophilic intermediates that reacted with GSH to form the adducts M3-M6. This confirmed the significant role of P450 3A4 in producing reactive metabolic intermediates including benzoquinone imine and possible oxirene.
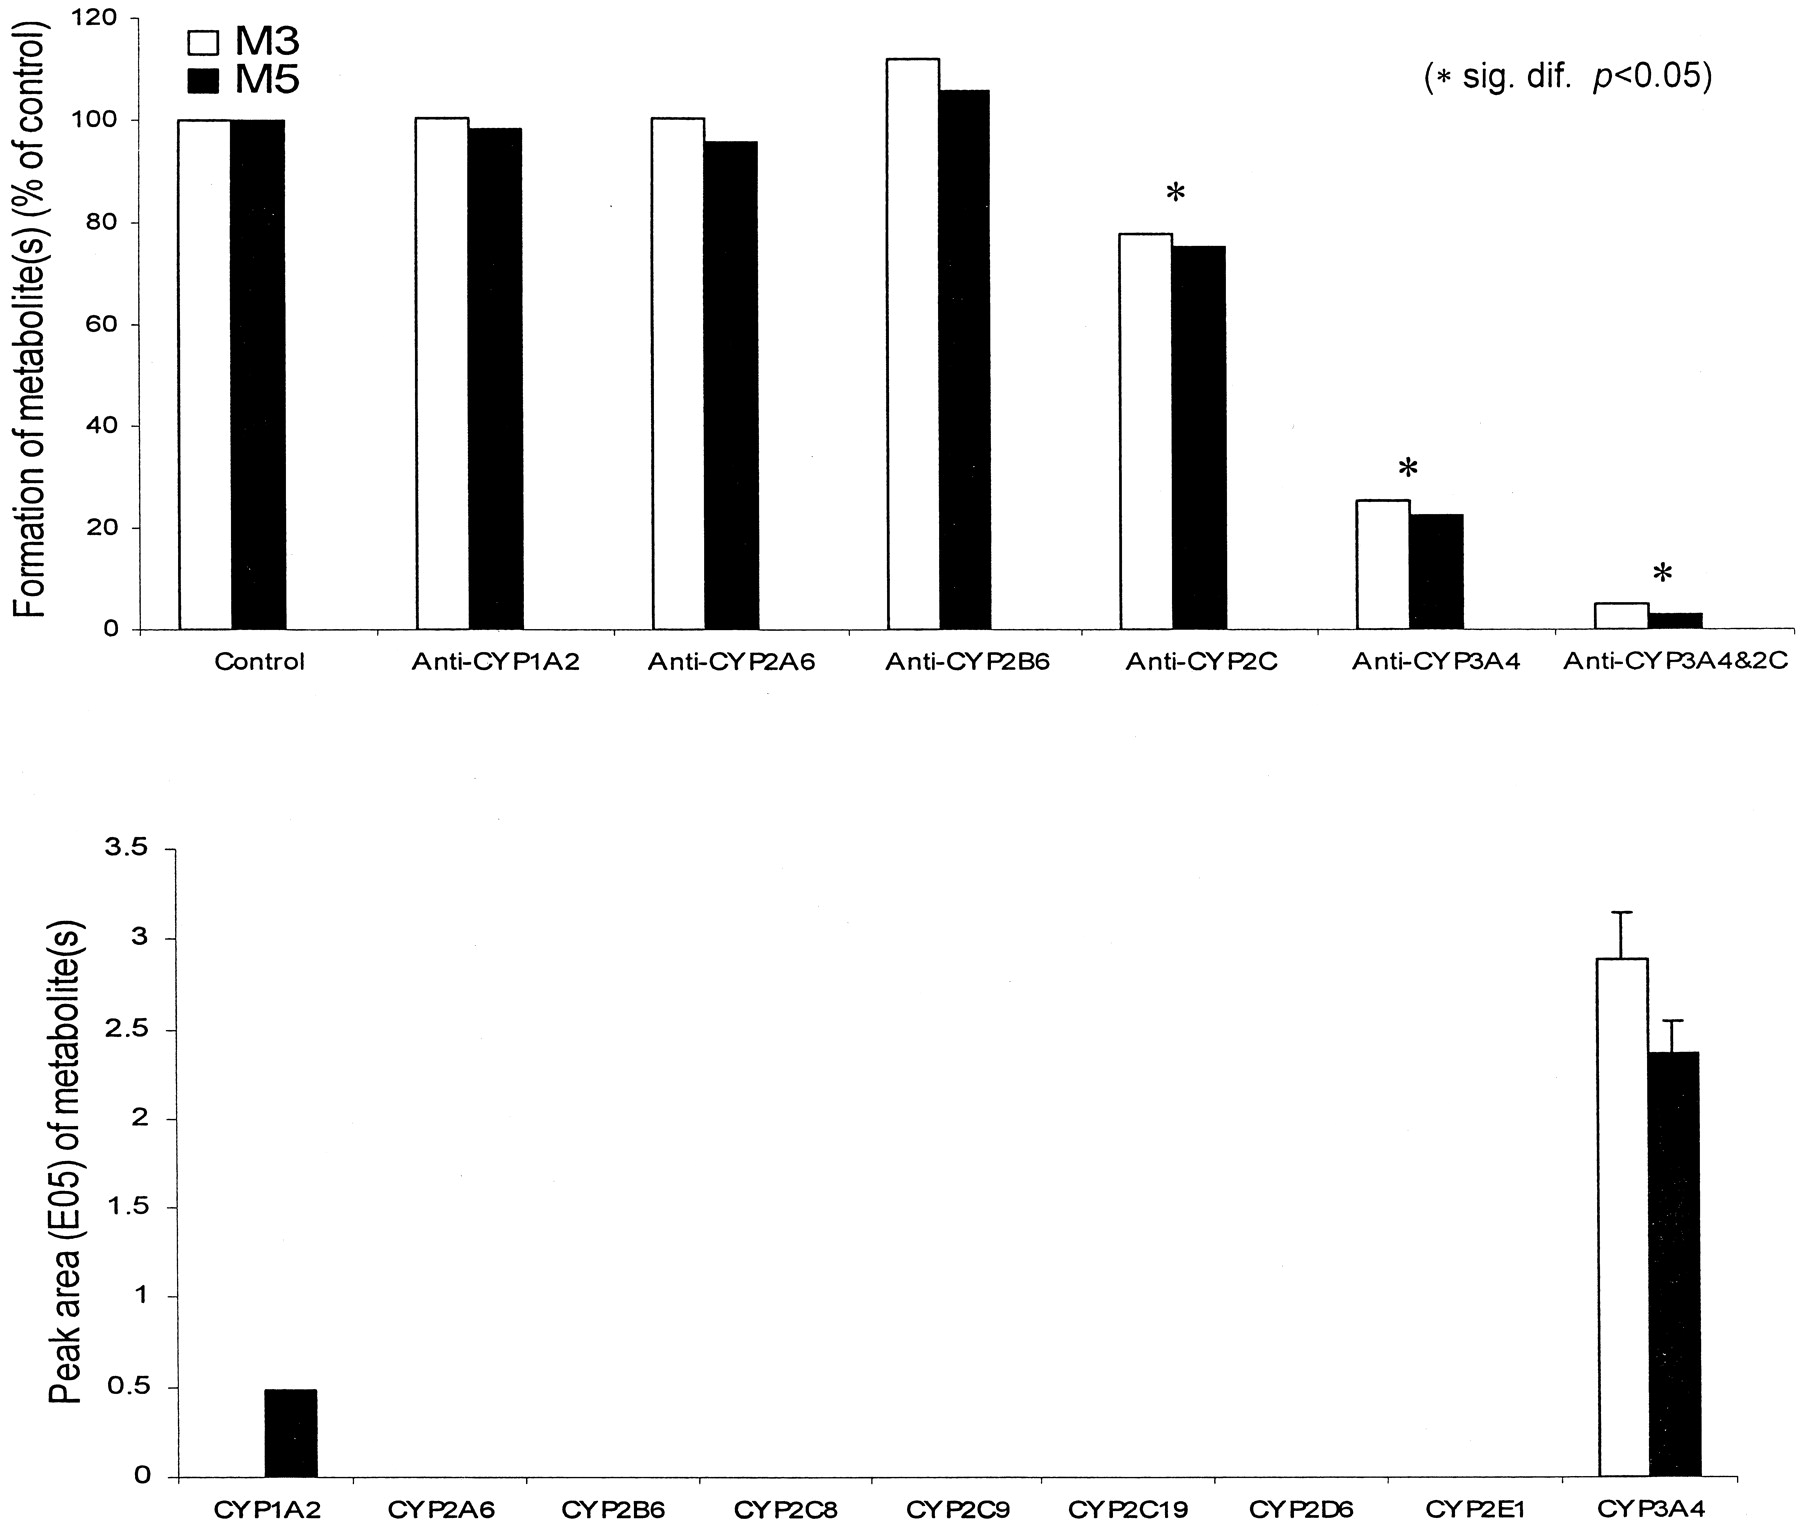
Formation of M3 andM5 in human liver microsomes in the presence of anti-P450 antibody (top) and with human cDNA-expressed P450 enzymes (bottom).
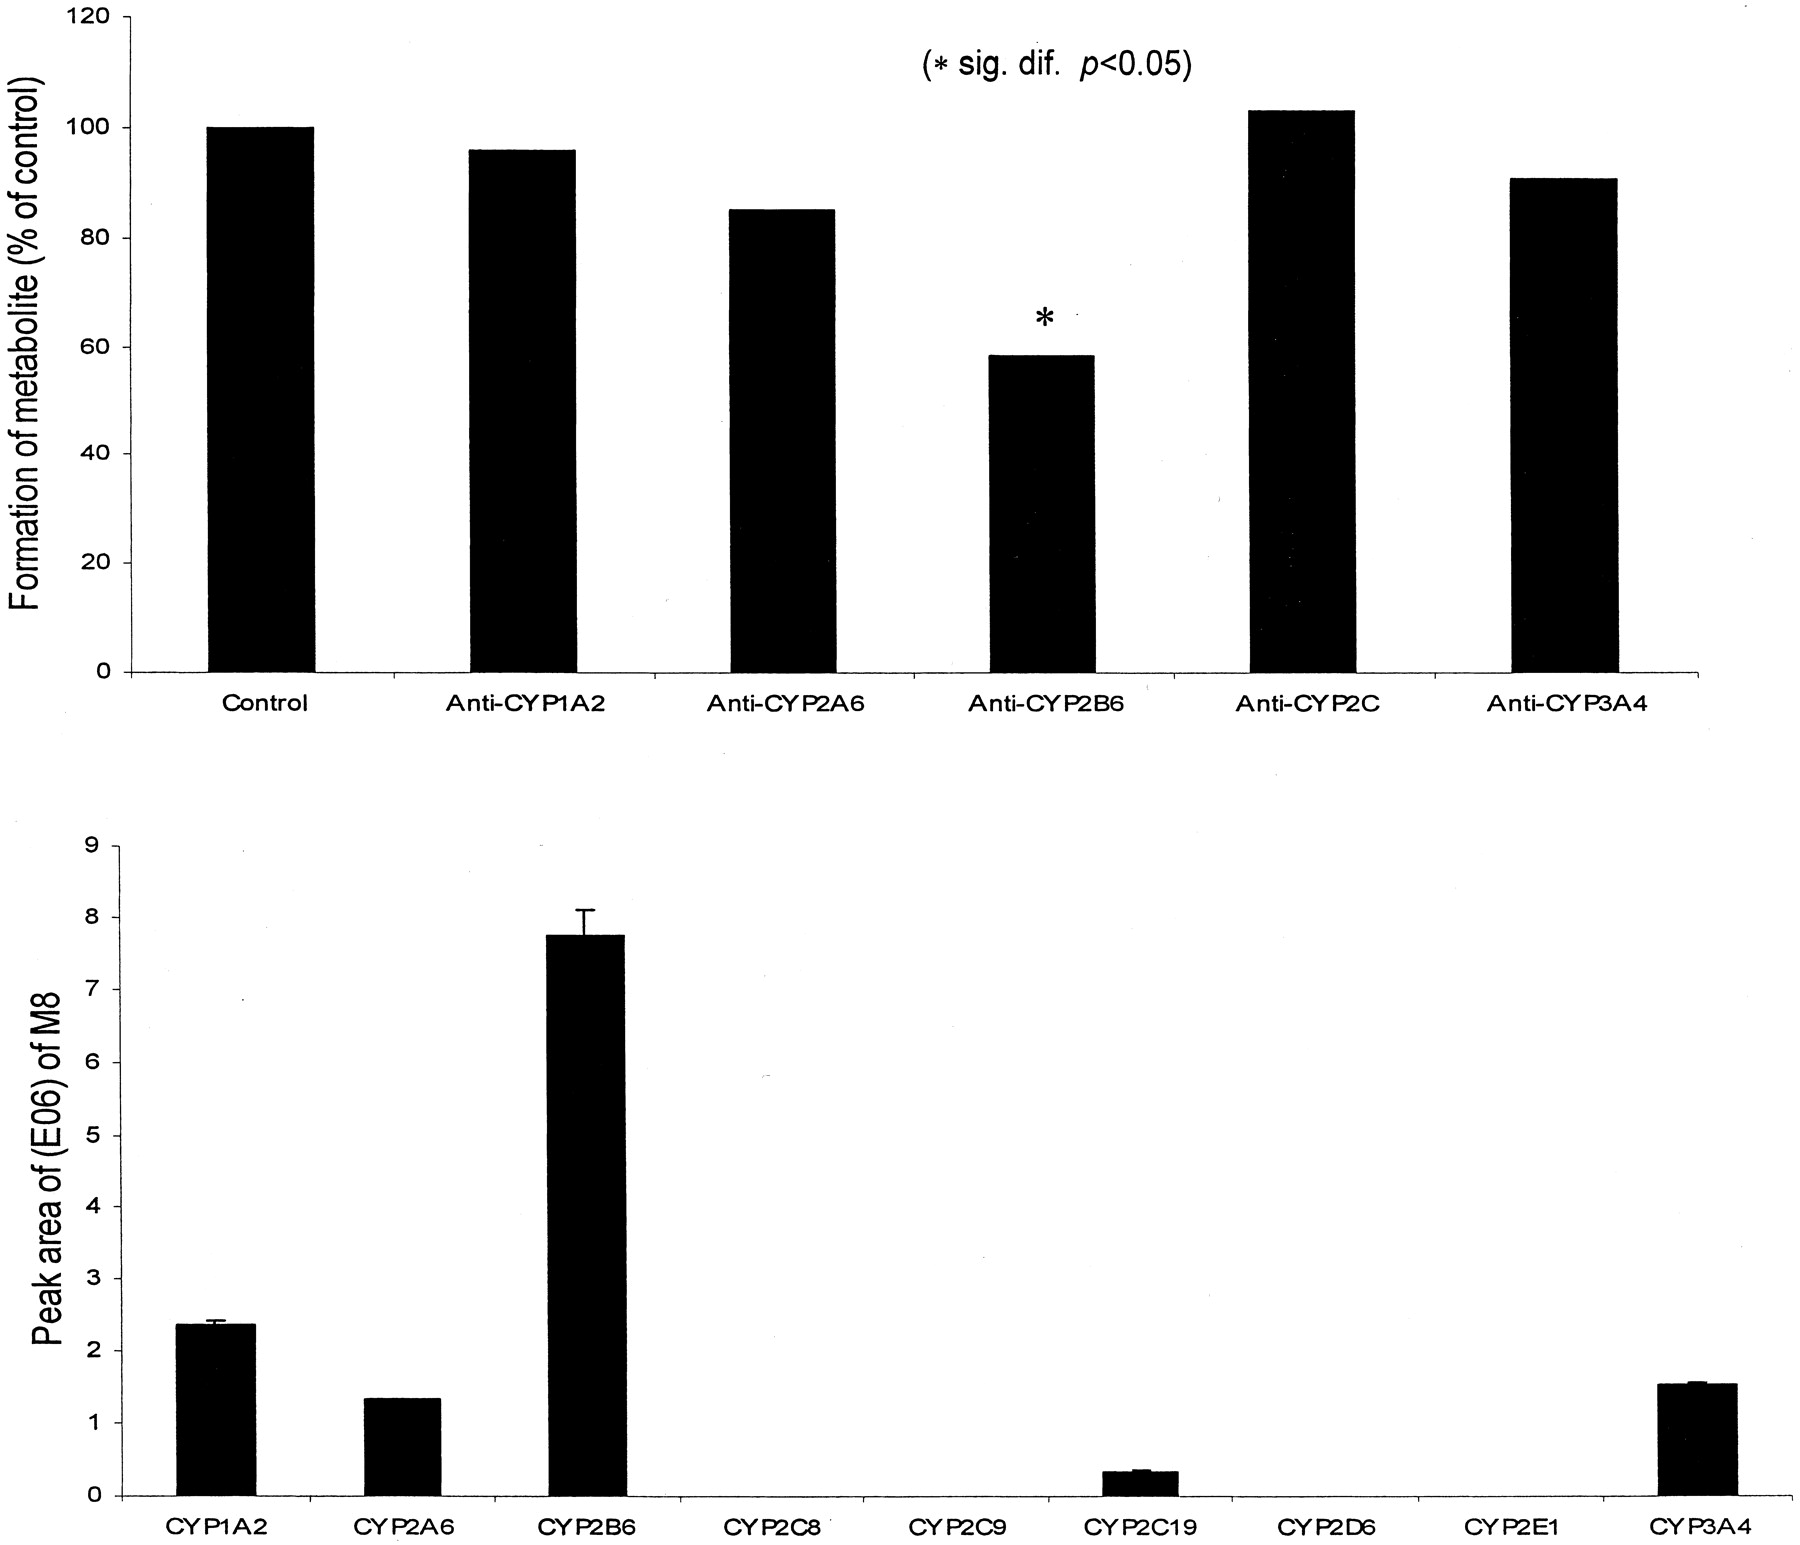
The anti-human P450 2B6 antibody inhibited production of M8by 42% (Fig. 5) as compared with the preimmune IgG control. Studies carried out with the antibody against P450 1A2, 2A6, 2C, and 3A4 showed little or no effect on the formation of M8. Incubation of microsomes in the presence of orphenadrine (250 μM) resulted in inhibition (57%) on the formation of M8, supporting the role of CYP2B6. It has been reported that orphenadrine is specific P450 2B enzyme inhibitor in rat liver (Reidy et al., 1989). Recently, inhibition of CYP2B6 by orphenadrine has been reported (Stevens et al., 1997; Granvil et al., 1999;Yanagihara et al., 2001). In addition, ketoconzole (5 μM) showed a certain degree of inhibition (30%), suggesting the possible involvement of CYP3A4 in forming M8. In contrast, the inhibitors for other P450 enzymes [furafylline (P450 1A2, 50 μM), sulfaphenazole (P450 2C9, 50 μM), and troleandomycin (P450 3A4, 50 μM) had no effect on the production of M8 at concentrations previously shown to produce significant inhibition of marker P450 activities (Newton et al., 1994). The studies using cDNA-expressed human P450 enzymes demonstrated a marked difference in the formation of M8. It was found that much greater quantities of M8 were produced by CYP2B6 (Fig. 5), although lesser quantities of M8 were produced by CYP 1A2, 2A6, and 3A4. These results clearly suggested the significant role of CYP2B6 in forming M8.

Formation of M8 in human liver microsomes in the presence of anti-P450 (top) antibody and with human cDNA-expressed P450 enzymes (bottom).
Kinetic Parameters of DPC 963 Metabolism in Human Liver Microsomes.
Pooled human liver microsomes were chosen for kinetic studies to characterize the formation of the major metabolite M8 and GSH adducts M3 and M5. Because of the limited quantities of M4 and M6, the kinetics of these adducts were not studied. Incubation conditions were established such that the formation of metabolites was linear with respect to the amount of microsomal protein and incubation time. DPC 963 at concentrations ranging from 0 to 5000 μM was incubated with a fixed amount of microsomal protein. The rate of formation at each concentration was calculated as picomole per minute per milligram microsomal protein. Apparent enzyme kinetic constants (Km,Vmax), which were estimated by nonlinear regression analysis, are presented in Table1. The intrinsic clearance was determined by dividing Vmax byKm. The rank order ofKm with respect to metabolite formation is M8 < M5 ≪ M3. Inclusion of GSH had no effect on the kinetics of formation ofM8. The conversion of DPC 963 to M8 occurred to a greater extent than the conversion to M3 and M5, by virtue of both a lower Km value and higher Vmax value. The intrinsic clearance value for the conversion of DPC 963 to M8 was approximately four- and three-hundred-fold higher than the value obtained for M5 and M3, respectively.
Kinetic parameters for the formation of DPC 963 metabolites (M3, M5, and M8) in human liver microsomes
Discussion
DPC 963 was found to be extensively metabolized by humans administered multiple oral doses of DPC 963, as evidenced by the trace levels of the compound in urine samples. The major metabolite present in urine was identified as the glucuronide conjugate of 8-OH DPC 963 (M8, Fig. 1). Interestingly, small quantities of glucuronide conjugate of 6-OH DPC 963 (M7, Fig. 1) were present in urine as well. The identification of M7 suggested the occurrence of an oxidative defluorination pathway in vivo. DPC 963 contains two fluorines on the aromatic ring. One of the aims of having two fluorine atoms on the aromatic ring was to seek some degree of metabolic stability by decreasing the reactivity of the pi electrons (i.e., decreases the energy level of the highest occupied molecular orbital in the aromatic ring). This subsequently leads to deactivation of the aromatic system toward P450-mediated metabolism such as hydroxylation and hence leading to a potentially metabolically stable compound. However, substitution with fluorine, under certain circumstances, can predispose a compound to a potential P450-mediated oxidative defluorination reaction. There is ample literature precedence for P450–mediated defluorination (Rietjens et al., 1990; Rietjens and Vervoort, 1991; den Besten et al., 1993), whereby fluorine is lost easily as the fluoride ion in both displacement and elimination reactions from a compound.
To further understand the metabolism of DPC 963, especially with regards to the role of P450 in forming M7, in vitro studies using human liver microsomes were carried out. It was found that, in addition to M7 and M8, four GSH adductsM3-M6 (Scheme FS2) were formed when glutathione was added to the incubation mixture. Characterization of these adducts pointed to the existence of at least two divergent bioactivating metabolic pathways. It appears that the oxidation of the triple bond in DPC 963 took place to form an unstable oxirene metabolic intermediate, which appeared to be responsible for the production of two isomeric M3 and M4. Such a formation of an oxirene intermediate has been postulated and reported for the metabolism of DPC 963 in the rat (Chen et al., 2002) and with a close analog, DPC 961 (Mutlib et al., 2000). As shown in Scheme FS2, it is postulated that an initial oxidation of the triple bond, catalyzed by cytochrome P450 3A4, results in the formation a putative oxirene intermediate, which undergoes rapid rearrangement with the adjacent cyclopropyl ring to form a reactive cyclobutenyl ketone intermediate. It was also found that the addition of GSH to the reactive intermediate took place nonenzymatically since both adducts were formed with cDNA-expressed enzymes that apparently did not have any glutathione transferase activities, indicating the “soft” electrophilic property of the cyclobutenyl ketone intermediate. As discussed previously (Mutlib et al., 2000; Chen et al., 2002), the postulated occurrence of oxirene as an intermediate during chemical and enzymatic oxidation of alkynes has been previously reported. However, there was no direct evidence for the existence of such oxirene mainly due to the high reactivity of these intermediates. By introducing a cyclopropyl substituent, which has unique chemistry and has been widely used to probe enzymatic mechanisms (Suckling, 1988), and by using13C analog, the transient formation of the oxirene intermediate was demonstrated via 13C-NMR studies (Mutlib et al., 2000). In the present study, we demonstrated for the first time that human P450 3A4 is capable of forming an oxirene intermediate, as evidenced by the presence of GSH conjugates,M3 and M4.

Proposed metabolic pathways of DPC 963 in human liver microsomes.
In addition to M3 and M4, analyses of human microsomal incubations showed the presence of GSH adducts M5and M6 (Scheme FS2). These GSH adducts were characterized as being ring-substituted regio-isomers with only one fluorine remaining at aromatic C5 position. The fluorine at aromatic C6 was replaced by a hydroxyl group. It appears that the defluorination of DPC 963 took place preferentially at aromatic C6 position, perhaps due to the presence of cyclourea, an electron donating substituent in thepara position to the fluorine at C6. These observations were consistent with those found from in vivo metabolism in rats as well as in vitro studies of DPC 963 using rat liver microsomes (Chen et al., 2002). Therefore, a putative p-benzoquinone imine intermediate produced via P450-mediated oxidative defluorination of DPC 963 is postulated to be responsible for the formation ofM5-M7. The formation of M7 can possibly be attributed to the reduction of the quinoneimine by two electrons donated from NADPH via P450 reductase. Since P450 can effectively transfer electrons from its reductase to many substrates with high enough oxidation potentials (Hanzlik, 1981; Goeptar et al., 1992; Zbaida et al., 1994), it is not unreasonable to expect that the P450 reaction intermediate (benzoquinone imine) might also accept electrons in this fashion. When it is present, GSH adds to this intermediate via Michael addition, giving rise to two regio-isomeric adducts M5 and M6. The addition of GSH to the incubation mixture leads to a competition between the adduct formation (via Michael addition) and reduction of benzoquinone imine. It was noted that the presence of GSH showed significant effects on the rate of M7 production, decreasing it by approximately 50% as compared with the control whereby GSH was omitted. It was further demonstrated that M7 was converted to M5 andM6 when it was incubated with microsomes in the presence of GSH, suggesting the common metabolic intermediate (quinoneimine) and the process of redox cycling. The postulated mechanisms of DPC 963 defluorination involving a benzoquinone imine intermediate have been described in detail elsewhere (Chen et al., 2002). Interestingly, in human urine, the presence of glucuronide conjugate ofM7 and the absence of M5 and M6 or its degradants might be explained by rapid reduction of benzoquinone imine intermediate formed via the oxidative defluorination. This reduction could have been catalyzed by NAD(P)H-P450 reductase or other reducing equivalents. The reduced product, hydroquinone (M7), is subsequently subjected to the high capacity conjugation with the glucuronic acid, leading to glucuronide conjugate of M7, metabolite M10. Perhaps this reaction pathway is kinetically favorable in vivo, and combined with low accessibility of GSH to the site where the oxidative defluorination occurs, may also partially explain the lack of GSH-related adducts in vivo. Alternatively, the GSH conjugates M5 and M6 may have been eliminated in faces via biliary excretion, and hence were not detected.
The results from in vitro studies demonstrated that CYP3A4, the most abundant P450 isozyme in human liver, plays an important role in forming the reactive benzoquinone imine and cyclobutenyl ketone intermediates. On the other hand, the results from similar approaches demonstrated that CYP2B6 was the principle enzyme catalyzing the formation of M8, the precursor to major glucuronide metabolite (M9) found in vivo. It is known that the expression level of CYP2B6 in human liver varies considerably (Code et al., 1997) and alleles that cause enzymes with altered activity have been described for CYP2B6. At present however, there are no data available on the involvement of CYP2B6 in DPC 963 metabolism in vivo. Because of the high extent of interindividual variability with CYP2B6 and the metabolic activation of DPC 963 to reactive intermediates by the nonpolymorphic CYP3A4, the potential of drug-drug interaction and adverse effects in the clinic exists.
Consequently, the enzyme kinetics, which are important in determining the processes (metabolic reaction and activation) leading to the detoxification and toxicities, were studied in human liver microsomes to investigate the relative significance of each metabolic pathway. The results showed that the apparent Kmvalue for the formation of M8 was lower (∼15 μM) than that for the formation of M5 (∼66 μM), although the rate for the formation (Vmax) ofM5 or M8 was similar. The apparentKm value for the formation ofM3 was far greater (∼1.9 mM) than that for the formation of either M5 or M8. The turnover rate (CLint) of M8 is greater (∼4-fold) than that of M5 and much greater (∼300-fold) than that ofM3. Therefore, at the projected therapeutic concentrations (∼5 μM), the formation of M8 would be the dominant metabolic pathway. This is consistent with the in vivo finding in which it was shown that the glucuronide conjugate of M8 was the major metabolite present in human urine (Fig. 1).
The occurrences of an oxidative defluorination of DPC 963 in vivo and in vitro were demonstrated by identifying the respective metabolites (M5– M7). The chemical mechanism of defluorination mediated specifically by human CYP3A4 enzymes is postulated to involve the formation of a chemically reactivep-benzoquinone imine intermediate, which undergoes reduction to yield M7 or conjugation with GSH to give M5and M6. In addition, it was demonstrated in vitro that human CYP3A4 was able to directly oxidize the triple bond of DPC 963, resulting in an intermediate that was capable of 1,4-Michael addition with GSH to produce stereosiomeric M3 and M4. The enzyme kinetics studied in human liver microsomes suggest that the enzyme(s) with a higher affinity is responsible for the aromatic ring hydroxylation leading to M8, the major metabolite in vivo (as a glucuronide conjugate) and in vitro, whereas the enzyme(s) with a lower affinity accounted for the bioactivation pathways (oxidative defluorination as well as oxirene formation). Such differences in enzyme kinetics for different metabolic pathways (detoxification and toxification) may explain the absence of any apparent toxicities even if reactive metabolic intermediates are produced from a compound. However, if the kinetics of detoxification pathway is altered (such as by polymorphic expression of an enzyme), an individual may be predisposed to potential toxicity by reactive metabolites produced by an alternate metabolic pathway.
Footnotes
- Abbreviations used are::
- HIV
- human immunodeficiency virus
- DPC 963
- (S)-5,6-difluoro-4-cyclopropylethynyl-4-trifluoromethyl-3,4-dihydro-2(1H)-quinazolinone
- P450
- cytochrome P450
- GSH
- glutathione
- LC/MS
- liquid chromatograph/mass spectrometry
- HPLC
- high performance liquid chromatography
- MS/MS
- tandem mass spectrometry
- MRM
- multiple reaction monitoring
- SIM
- selected ion monitoring mode
- Received July 31, 2002.
- Accepted October 10, 2002.
- The American Society for Pharmacology and Experimental Therapeutics


