


Abstract
Pituitary adenylate cyclase-activating polypeptide (PACAP) is a hormone belonging to the glucagon superfamily of hormones. These hormones are known to play important roles in metabolism and growth. PACAP is a neuropeptide that causes accumulation of cAMP in a number of tissues and affects the secretion of other hormones, vasodilation, neural and immune functions, as well as the cell cycle. To determine whether PACAP is essential for survival and to evaluate its function(s), we have generated mice lacking the PACAP gene via homologous recombination. We found that most PACAP null mice died in the second postnatal week in a wasted state with microvesicular fat accumulation in liver, skeletal muscle, and heart. Gas chromatography-mass spectrometry showed that fatty acid β-oxidation in liver mitochondria of PACAP−/− mice was not blocked based on the distribution of 3-hydroxy-fatty acids (C6–16) in the plasma. Instead, increased metabolic flux through the β-oxidation pathway was suggested by the presence of ketosis. Also, serum triglycerides and cholesterol were significantly higher (2- to 3-fold) in PACAP null mice than littermates. In the fed state, both serum insulin and blood glucose were normal in 5-d-old null mice compared with their littermates. In contrast, fasted PACAP null pups had a significant increase in insulin, but a decrease in blood glucose compared with littermates. Glycogen in the liver was reduced. These results suggest PACAP is a critical hormonal regulator of lipid and carbohydrate metabolism.
PITUITARY ADENYLATE cyclase-activating polypeptide (PACAP) is the most highly conserved member of the glucagon superfamily (1), a group of hormones that are located primarily in the brain and gut with an important role in growth and metabolism. PACAP is found in two forms, PACAP-27 (2) and PACAP-38 (3); the latter is a C-terminally extended form of PACAP-27. Both forms are able to stimulate cAMP accumulation in many tissues. PACAP has been reported to release a number of hormones from different endocrine glands. In the pancreas, PACAP releases both insulin (4–9) and glucagon (10). In the adrenal gland, PACAP releases catecholamines (4) and, depending on the species, glucocorticoids (11–13). In the pituitary gland, the release of several hormones is enhanced, which makes PACAP distinct from most other neuropeptide-releasing factors at physiological levels (14). In other functions PACAP has been shown to be a vasodilator (1), to regulate the cell cycle in tissue culture (15, 16), and to have immunoregulatory properties (4, 17, 18). Brain development is thought to be affected by PACAP, and early expression of the genes for both PACAP and its specific receptor (PAC1-R) occurs at embryonic day 9.5 in mice (19). However, it is not clear whether the physiological effects of PACAP are a coordinated response to one specific stimulus or to many different types of stimuli. Whether all of the above effects are relevant in vivo remains to be shown.
The single gene encoding PACAP in mice is a suitable candidate for targeted deletion. In contrast, complete deletion of the receptors would be more difficult because at least three genes encode the receptors for PACAP, and two of the receptor types are shared with another hormone. The three receptor types are a subset of the G-coupled seven-transmembrane family (20). One receptor is a PACAP-specific receptor (PAC1-R) with eight isoforms. Alternative splicing in the N-terminal region results in one isoform (21); splicing in the third intracellular loop with insertion of different cassettes results in an additional five isoforms (22), and changes in transmembrane regions 2 or 4 result in two more isoforms (23). The other two types of receptors (VPAC1-R and VPAC2-R) are shared between PACAP and VIP (24). VIP, like PACAP, is also a member of the glucagon superfamily, and the two peptides have some overlap of function. Thus, to separate the functions of PACAP and VIP, it is important to disrupt the single-copy PACAP gene. A recent study reported that deletion of one PACAP receptor type (PACAP-specific) resulted in glucose insensitivity (25).
The question that we address in this study is whether PACAP is essential for survival and which functions can be ascribed only to PACAP. In evolution, PACAP’s importance is shown by its high degree of conservation (26–28): across 600 million years of evolution, PACAP-27 has remained 96% identical to human PACAP (29). By use of gene targeting to generate mice lacking the PACAP gene, we analyze the physiological role of PACAP in an in vivo mammalian model. To determine the underlying mechanism for the striking phenotype observed in PACAP null mice, we have used 1) gas chromatography-mass spectrometry to examine fatty acidβ -oxidation in liver mitochondria; 2) histology of a number of tissues to examine morphology and intracellular lipid accumulation; 3) electron microscopy to study liver mitochondria and lipid accumulation; 4) biochemical techniques to measure the serum levels of triglycerides, FFA, cholesterol, ketone bodies, glucose, and liver glycogen; and 5) RIAs to measure insulin and corticosterone.
RESULTS AND DISCUSSION
Our interest in generating a mouse that is devoid of PACAP was to determine whether PACAP is critical to development and/or function of the neural, endocrine, and peripheral organ systems. Also, the PACAP−/− mice are useful to tease apart overlapping functions for PACAP and VIP, which are both pleiotropic and share a network of target sites. This unusual situation stems from the sharing of two receptors by PACAP and VIP (24). In addition, PACAP uses a specific seven-transmembrane receptor (22). The other question is whether the responses initiated by PACAP are triggered by a specific physiological event(s) as occurs for many hormones. For example, high blood glucose is important for insulin release; high blood calcium for calcitonin release; and excitement or stress for adrenalin release.
Generation of PACAP−/− Mice
A targeted disruption of PACAP was generated through homologous recombination in embryonic stem (ES) cells (Fig. 1, A and B). The PACAP knockout mouse lines were generated from two Cre recombinant clones, which were derived from one homologously recombined ES cell clone. PCR for mRNA and Western blot for protein were used to show that PACAP was not expressed in the brain of the PACAP−/− mice (Fig. 1, C and D). Genotyping of 270 offspring from heterozygous crosses showed the expected mendelian ratio of 1:2:1 (21% wild type, 52% heterozygotes, and 27% homozygotes), indicating that PACAP−/− mice did not die in utero. PACAP null mice appeared normal at birth with no obvious signs of neuropathology or overt developmental abnormalities. In the second postnatal week, most PACAP−/− mice died. In the first group of homozygotes (n = 73) the pups died or were used for the collection of serum samples after they became moribund. In the second group of homozygotes (n = 86), 9% lived. A C57/Bl6 backcrossed line (eight backcrosses) of PACAP null mice has been generated, and these PACAP null mice exhibit the same phenotype as the original genetically mixed PACAP null mice. This evidence supports the conclusion that the PACAP null mouse is free of nonlinked mutations.
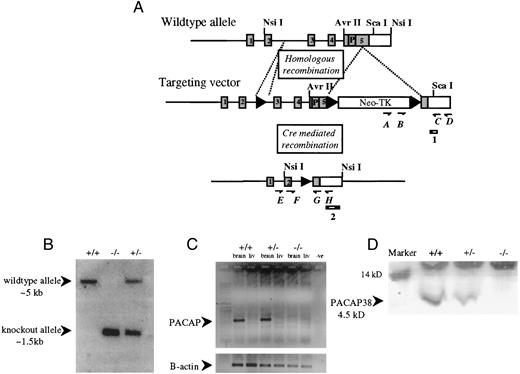
Targeted Disruption of Mouse PACAP Gene A, Organization of the mouse PACAP gene and the cre-loxP targeting vector used for disruption. Coding exons are represented by shaded rectangles, lox sites by arrowheads, and the selection region containing neomycin resistance and the thymidine kinase gene by open rectangles. The primers used in PCR are depicted by arrows. Cut sites (vertical lines) and probes (diagonal lines in rectangles) used for Southern blots are shown. B, Southern blot analysis of PACAP+/+, PACAP+/−, and PACAP−/− mouse genomic DNA cut with NsiI and hybridized with probe 2. The 1.5-kb fragment corresponds to the mutant allele. C, PACAP mRNA expression in brain and liver tissue of PACAP+/+, PACAP+/−, and PACAP−/− mice. PACAP+/+ and PACAP+/− mice express PACAP mRNA in brain tissue but PACAP−/− mice do not, confirming that PACAP−/− mice do not express PACAP mRNA. D, Western blot analysis of protein isolated from the brain of PACAP+/+, PACAP+/−, and PACAP−/− mice using a rabbit anti-PACAP38 polyclonal antiserum.
Two Distinct Modes of Death (Sudden or Wasting) in PACAP−/− Mice
Homozygous mice were born the same size as heterozygous and wild-type littermates, and the three genotypes remained matched in weight for several days. Thereafter, a few of the PACAP−/− pups died suddenly without losing weight, whereas most died after several days in which they failed to gain weight and finally lost weight (Fig. 2, a and b). Although PACAP is a releaser of GH (14), the rapid weight loss in the PACAP null mice suggests that wasting rather than lack of GH is involved. Also, it is known that GH deficiency does not obviously affect growth until 2 wk of age in mice (30), although it would be difficult to assess the role of GH in the PACAP null mice because of lethality. No significant difference in weight or longevity was noted by 35 d of age in the PACAP+/− or PACAP+/+ mice (Fig. 2b), which were weaned at 19 d. All pups continued to nurse and had milk in their stomachs at or near the time of death.
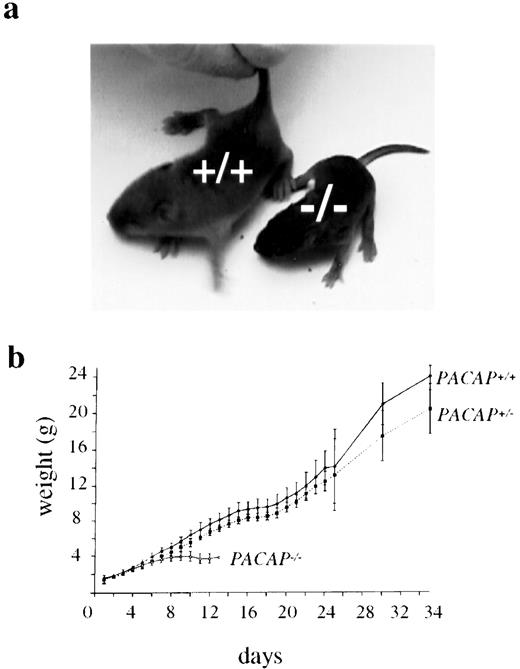
Weight Differences Among Genotypes a, Difference between PACAP+/+ and wasted PACAP−/− littermates at postnatal day 10. b, Mean weights of PACAP+/+ (n = 3), PACAP+/− (n = 11), and PACAP−/− (n = 9) mice from two litters.
Although most PACAP null mice died a slow wasting death, a few mice demonstrated sudden death before wasting. Literature on PACAP’s role in the cardiovascular system suggests the PACAP null mice might present with hypertension and decreased cardiac contractility due to a lack of PACAP-mediated vasorelaxation (31) and cardiac positive inotropic effect (32). Histological examination of Oil Red O-stained heart muscle sections showed intracellular lipid accumulation in the cardiac cells of PACAP null mice (Fig. 3a). Lipid accumulation in cardiac cells has been shown in animal models of diabetes and human diabetics and may contribute to the cardiomyopathy associated with diabetes mellitus (33, 34). In addition, null mice had elevated levels of serum FFA compared with wild-type littermates (Fig. 4B). These findings, along with the observed sudden death, are suggestive of a cardiovascular event.
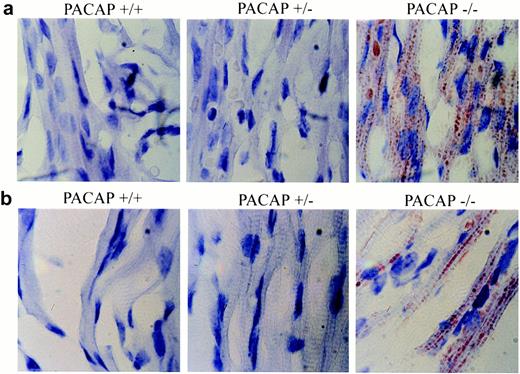
Heart Tissue and Skeletal Muscle Stained with Oil Red O a, Microvesicular fat in the PACAP−/− heart cells. b, Microvesicular fat in PACAP−/− skeletal muscle cells. Fat was not observed in PACAP+/+ or PACAP+/− heart or muscle cells.
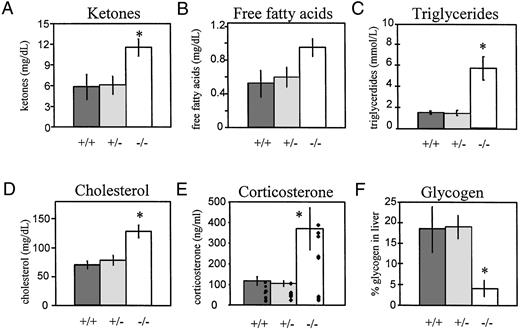
Measurement of Serum or Liver Components for PACAP−/− Mice in Relation to Heterozygous and Wild-Type Littermates Error bars represent sem; * indicates a significant difference (P < 0.05) between the values obtained from the PACAP−/− mice and both the PACAP+/− and PACAP+/+ mice (Tukey-Kramer Multiple Comparison Test). A, Level of β-hydroxybutyrate (a ketone body) in the serum of PACAP+/+ (n = 11), PACAP+/− (n = 13), and PACAP−/− (n= 16) mice. B, Level of FFA in the serum of PACAP+/+ (n = 4), PACAP+/− (n = 4), and PACAP−/− (n = 4) mice. C, Serum triglycerides in PACAP+/+ (n = 4), PACAP+/− (n = 5), and PACAP−/− (n = 5) mice. D, Level of cholesterol in the serum of PACAP+/+ (n = 11), PACAP+/− (n = 12), and PACAP−/− (n= 16) mice. E, Serum corticosterone concentration in PACAP+/+ (n = 9), PACAP+/− (n = 10), and PACAP−/− (n = 9) mice. The histogram shows the average corticosterone concentration for each genotype, while the scatter plot shows individual corticosterone levels. F, Percentage of glycogen in the livers of PACAP+/+ (n = 4), PACAP+/− (n = 4), and PACAP−/− (n = 4) mice.
Carbohydrate Metabolism in PACAP−/− Mice
PACAP is known to stimulate insulin release in a glucose-dependent manner (4–9). Thus, hyperglycemia might be predicted in the PACAP null mice due to reduced insulin levels. However, our PACAP−/− mice do not show high blood glucose (Fig. 5A). When fasted, PACAP null mice had significantly lower blood glucose compared with littermates. In the fed state, blood glucose levels of PACAP null mice were no different than littermates. Significantly reduced levels of glycogen in the liver (Fig. 4F) of PACAP null mice were measured at day 7, suggesting either an increased demand for glucose or an impairment of glycogen synthesis and/or gluconeogenesis. Similar to our findings, mice lacking the PACAP-specific receptor (with intact VIP-shared receptors) had normal blood glucose levels (25), although a reduction in glucose tolerance and insulin secretion were reported after glucose was administered by either an iv or gastric route. In the present experiment, the concentration of insulin was measured in serum of fed and fasted wild-type, heterozygous, and null mice at postnatal day 5 (Fig. 5B). In wild-type mice insulin concentration increased in the fed compared with the fasted state as expected. In the fed state insulin levels of PACAP null mice were not significantly different from levels seen in wild-type and heterozygous mice. However, insulin serum concentration was significantly elevated in fasted PACAP null mice compared with littermate controls. Because the 5-d-old mice pups have a small blood volume, only one serum sample of less than 100 μl could be obtained from an individual by cardiac puncture. Therefore, continuous assessment of insulin and glucose levels in a single mouse could not be performed. Instead, groups of mice at several early postnatal ages need to be sampled to develop a pattern of insulin concentration throughout their short lives. Nevertheless, these initial data indicate abnormal insulin regulation in the PACAP null mice, suggesting insulin resistance or elevated insulin in response to lipid abnormalities in these null mice compared with littermates (Fig. 4, B, C, and D).
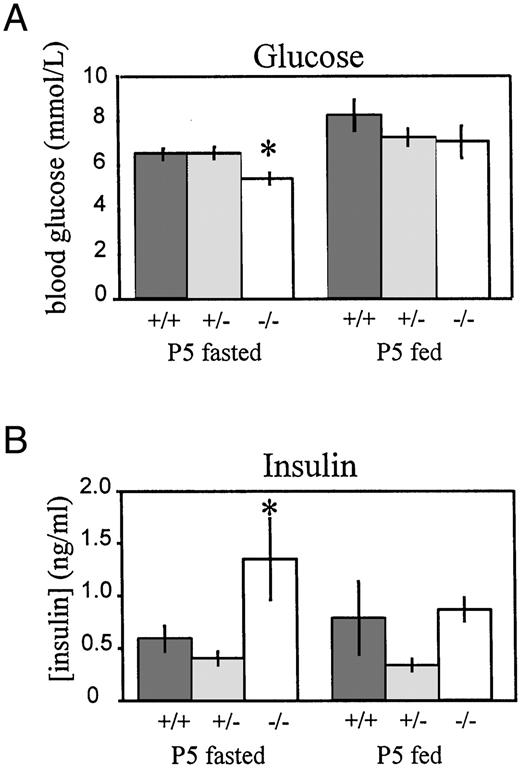
Measurement of Blood Glucose and Serum Insulin in PACAP−/− Mice in Relation to Heterozygous and Wild-Type Littermates Error bars represent sem; * indicates a significant difference (P < 0.05) between the values obtained from the PACAP−/− mice and both the PACAP+/− and PACAP+/+ mice (Tukey-Kramer Multiple Comparison Test). A, Blood glucose levels in postnatal day 5 (P5) fasted PACAP+/+(n = 10), PACAP+/− (n = 10) and PACAP−/− (n = 10) mice and fed PACAP+/+(n = 8), PACAP+/− (n = 15) and PACAP−/− (n = 6) mice. B, Levels of serum insulin in postnatal day 5 (P5) fasted PACAP+/+(n = 19), PACAP+/− (n = 20), and PACAP−/− (n = 17) mice and fed PACAP+/+(n = 10), PACAP+/− (n = 10), and PACAP−/− (n= 10) mice.
Altered Lipid Metabolism in Liver, Heart, Skeletal Muscle, and Adipose Tissue of PACAP−/− Mice
Necropsies, performed at 6–8 d of age or at death, revealed that the livers of PACAP−/− mice were buff colored. Histological examination of 15 tissues showed that at least four were affected. Hepatic microvesicular steatosis was present (Fig. 6, iii). The lipid accumulation was confirmed by Oil Red O staining (Fig. 6, v) and by electron microscopy (data not shown). In addition, both heart (Fig. 3a) and skeletal muscle (Fig. 3b) showed intracellular fat accumulation in Oil Red O-stained sections. Subcutaneous white fat deposits were depleted totally in wasted PACAP−/− mice at the time of death.
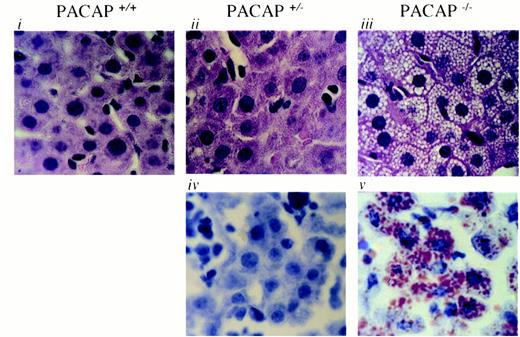
Morphology of Hepatocytes from PACAP+/+, PACAP+/−, and PACAP−/− Mice Microvesicular fat in the hepatocytes of PACAP−/− mice (iii), but not in the PACAP+/+ and PACAP+/− hepatocytes (i and ii). Fat is shown in PACAP−/− hepatocytes by Oil Red O staining of frozen sections (v), but is not shown in PACAP+/− mice (iv).
One possible cause of microvesicular fat accumulation in liver cells is a defect in hepatic fat metabolism associated with mitochondrial dysfunction (35, 36). To determine whether the mitochondria were involved, electron micrographs of the livers were examined. However, mitochondria of PACAP−/− mice appeared to be morphologically normal (data not shown). To evaluate whether the fatty acid β-oxidation pathway in mitochondria was defective, a blood sample from each genotype was analyzed for 3-hydroxy-fatty acids (C6 to C16) by gas chromatography-mass spectrometry (GC-MS) (37). The similar distribution of 3-hydroxy-fatty acids for the different chain lengths among the mice genotypes suggested that an enzymatic defect in fatty acidβ -oxidation was not present in the PACAP null mice (Table 1).
Total 3-OH-Fatty Acids (μmol/liter) in Blood of Mice Measured by Gas Chromatography-Mass Spectrometry
| Genotype of mouse | 3-OH-C6 | 3-OH-C8 | 3-OH-C10 | 3-OH-C12 | 3-OH-C14 | 3-OH-C16 |
|---|---|---|---|---|---|---|
| +/+ | 4.1 | 2.6 | 0.6 | 0.6 | 0.5 | 1.1 |
| +/− | 3.7 | 3.0 | 0.8 | 0.6 | 0.3 | 0.7 |
| −/− | 5.6 | 2.5 | 0.8 | 0.6 | 0.6 | 1.2 |
| Genotype of mouse | 3-OH-C6 | 3-OH-C8 | 3-OH-C10 | 3-OH-C12 | 3-OH-C14 | 3-OH-C16 |
|---|---|---|---|---|---|---|
| +/+ | 4.1 | 2.6 | 0.6 | 0.6 | 0.5 | 1.1 |
| +/− | 3.7 | 3.0 | 0.8 | 0.6 | 0.3 | 0.7 |
| −/− | 5.6 | 2.5 | 0.8 | 0.6 | 0.6 | 1.2 |
Adrenal Function in the PACAP−/− Mice
The wasted appearance of the PACAP null mice resembles Addison’s disease, whereby glucocorticoids are not produced from a lack of ACTH or due to adrenal cortex destruction. To assess adrenal cortical function in the PACAP null mice, we performed histology of the adrenal gland and measured levels of corticosterone in pups at postnatal day 7. Hematoxylin/eosin staining did not reveal any difference in morphology of the adrenal glands of the three genotypes. Serum for the steroid measurement was collected at the same time each day, and animals were handled in the same manner to avoid variations in corticosterone levels. Results indicate PACAP null mice have significantly elevated levels of corticosterone compared with littermates (Fig. 4E). A scatter plot of the data shows two distinct populations within the PACAP null mice in relation to corticosterone production (Fig. 4E). Some mice have normal corticosterone levels, whereas others have extremely high levels, suggesting a change in corticosterone production as the pups progress toward death. These data indicate that the PACAP null mice are able to produce and release corticosterone from the adrenal cortex and the phenotype observed can not be attributed to lack of this steroid.
Elevated Triglycerides, Cholesterol, FFA, and Ketone Bodies in PACAP−/− Mice
Significantly elevated serum levels of triglycerides (Fig. 4C) and cholesterol (Fig. 4D) were present in PACAP−/− mice compared with the other genotypes. This result suggests that the liver is capable of synthesizing and releasing very low density lipoprotein (VLDL) particles into the blood. At the same time FFA in the serum of the PACAP null mice were significantly higher than those of wild-type mice (but not significantly higher than heterozygotes) suggesting an increased mobilization of fatty acids from adipose tissue in the null mice (Fig. 4B).
Despite the abnormal fat storage in the hepatocytes, entry of fatty acids into the mitochondria was unlikely to be reduced because ketosis was present in the PACAP null mice (Fig. 4A). This suggests that metabolic flux in the mitochondria was increased, in turn resulting in the formation of ketone bodies that are released into the blood. These findings, along with the GC-MS data from above, indicate that the defect seen in the PACAP null mice is not necessarily attributable to hepatic dysfunction. Instead, the liver, skeletal muscle, and heart may simply be responding to an increased mobilization of fatty acids from adipose tissue in PACAP null mice. The stimuli and precise site(s) of action of PACAP in this process remain to be defined. One hypothesis is that the activity of lipoprotein lipase and/or hormone-sensitive lipase are affected by the absence of PACAP and may be responsible for the metabolic dysfunction seen in the PACAP null mice. An alternate hypothesis is that PACAP null mice are incapable of using or obtaining intracellular glucose, and the mobilized FFA compensate as an energy source inside the cells.
This is the first report that PACAP has a role in lipid metabolism. The early death after birth associated with wasting and the accumulation of fat in the liver, heart and skeletal muscle were striking results that were not predictable from previous literature. Our data show that PACAP may be a critical regulator of lipid and/or carbohydrate metabolism.
MATERIALS AND METHODS
Gene Targeting
A clone containing 18 kb of the PACAP gene was isolated from a 129SvJ mouse genomic library (Stratagene, La Jolla, CA), restriction mapped, and sequenced. A Cre-loxP targeting vector was constructed (38, 39) containing approximately 10 kb of 5′-flanking, 1 kb of 3′-flanking, and a 5-kb region to be deleted (Fig. 1A). Linearized vector was electroporated into R1 embryonic stem (ES) cells (40), which were growing in log phase. Cell clones that had incorporated the construct were obtained by G418 (180 μg/ml) selection. Clones containing homologous recombination events were identified by PCR and confirmed by Southern blot. These homologously recombined clones were identified from more than 1,000 clones screened, but only one clone contained the entire targeting vector inserted correctly, as shown by Southern blot. Using electroporation, we transiently transfected the ES cell clone with a vector (pEGFP-Cre) expressing Cre recombinase. Four days after transfection, recombined ES cells were obtained using gancyclovir (1 μm) selection. Clones that had undergone type I recombination (PACAP gene deleted, Fig. 1A) were identified by PCR and confirmed by Southern blot. ES cells heterozygous for the PACAP deletion were expanded and microinjected into C57/Bl6 blastocysts. Germline transmission of the PACAP deletion was achieved from two male chimeras. Heterozygous littermates were crossed to produce mice homozygous for the PACAP deletion. Mice were genotyped using a PCR strategy that was confirmed by Southern blot (Fig. 1B). The mice used in this study were housed and handled in compliance with the guidelines of the University of Victoria’s Animal Care Committee and with the University of British Columbia’s Animal Ethics Committee.
Detection of mRNA in Brain and Liver Tissue
Liver and brain tissues were collected from PACAP+/+, PACAP+/−, and PACAP−/− mice and frozen immediately in liquid nitrogen. Tissue was ground using a chilled mortar and pestle. RNA was isolated using TRIzol (Life Technologies, Inc., Gaithersburg, MD). mRNA (5 μg) was reverse transcribed with Superscript II reverse transcriptase (Life Technologies, Inc.) using oligo-dT. The cDNA generated from the above reaction was added to a 50 μl reaction containing 2.5 U Taq polymerase (Life Technologies, Inc.), 1× Taq buffer (Life Technologies, Inc.), 2.5 mm MgCl2, 200 mm deoxynucleoside triphosphates, and 20 pmol of primer E (ATGTGTAGCGGAGCAAGGCTGG) and primer G (GAACACGAGTGATGACTGGTCAGTC). PCR was carried out under the following conditions: denaturation at 94 C for 30 sec; annealing at 61 C for 30 sec; extension at 72 C for 45 sec for 33 cycles and a long extension of 7 min. Products produced by the PCR reaction were separated on a 1.5% agarose gel and visualized by ethidium bromide staining.
Western Blot
Protein was extracted from PACAP+/+, PACAP+/−, and PACAP−/− mice using NP-40 lysis buffer with protease inhibitors. Protein (100 μg) was run through a 16.5% Tris-tricine gel (Bio-Rad Laboratories, Inc., Hercules, CA, catalog no. 161-1107). The protein was transferred onto a PVDF membrane (Bio-Rad Laboratories, Inc.) and blocked overnight at 4 C in Tris-buffered saline with Tween 20 (TBST) and 5% BSA. The membrane was then probed with rabbit anti-PACAP38 (Peninsula Laboratories, Inc., Belmont, CA, catalog no. IHC8920), diluted 1:2000 in TBST with 1% BSA overnight at 4 C, washed three times with TBST and incubated with secondary goat antirabbit antibody (DAKO Corp., Carpinteria, CA) diluted 1:10,000 in TBST with 1% BSA for 45 min at room temperature. The blot was washed four times with TBST detected by enhanced chemiluminescence (Amersham Pharmacia Biotech, Buckinghamshire, UK, catalog no. RPN2106) and exposed to film.
Light Microscopy
Tissues (brain, heart, lung, thymus, stomach, liver, pancreas, spleen, intestine, kidney, adrenal gland, skin, skeletal muscle, and bone) from PACAP+/+, PACAP+/−, and PACAP−/− mice were collected and fixed in 4% paraformaldehyde in PBS. Routine processing, paraffin embedding, and sectioning (10 μm) were performed. All sections were stained with hematoxylin and eosin. Frozen sections of liver, heart, and skeletal muscle were stained with Oil Red O to identify the presence of lipids.
Electron Microscopy
Livers of wasted PACAP−/− mice and littermates (PACAP+/+ and PACAP+/−) were fixed with a 2.5% glutaraldehyde primary fixative by cardiac perfusion. The tissue was rinsed with phosphate buffer and postfixed in osmium tetroxide for 1 h at 4 C. The sections were rinsed in ddH20, and then dehydrated in an ethanol series and embedded in epon. Ultrathin sections were cut, collected on grids, and stained with lead citrate. Sections were examined using an H-7000 transmission electron microscope (Hitachi, Naka City, Japan).
Measurement of Serum and Liver Components
Serum was collected from anesthetized mice by cardiac puncture. Serum β- hydroxybutyrate (ketone body) was measured using Sigma (St. Louis, MO) kit no. 310-A. Fatty acids were measured with a kit from Roche Diagnostics (Indianapolis, IN, no. 1 383 175). Serum triglycerides were measured at the Vancouver General Hospital core laboratory facility. Also measured were serum cholesterol (Sigma kit no. 352–20), blood glucose (Elite glucometer, Bayer Corp., Toronto, Ontario, Canada), and liver glycogen (Sigma kit STA-20). Serum corticosterone concentration was measured in duplicate by RIA (Double Antibody Corticosterone 125I RIA kit no. 07–120102, ICN, Orangeburg, NY) as was serum insulin concentration (Sensitive Rat Insulin RIA kit, no. SRI-13K, Linco Research, Inc.). In the measurement of insulin, serum was collected from both fed and fasted mice. Fed mice were allowed to nurse ad libitum before serum collection, whereas fasted mice were removed from their mothers and did not feed for 4 h before serum collection. Statistical analysis was done with the Tukey-Kramer Multiple Comparison Test. Level of significance was P< 0.05. In the insulin RIA, several samples (7 of 86) contained very low levels of insulin and were undetected by the assay. For statistical purposes a conservative value of 0.02 ng/ml, the lowest detectable concentration for Linco’s Sensitive Rat Insulin RIA Kit, was assigned to these samples.
Acknowledgments
We thank Drs. Michael Bennett and Patricia Jones for the GC-MS data, Anita Borowski for invaluable help with the ES cells and blastocyst injections, and Joanne Fox for the gift of pEGFP-Cre vector. We thank Drs. Scott Pownall, John McRory, and David Parker for advice during the early stages of gene isolation or vector preparation and Dr. Grant Mitchell for helpful discussions.
This work was supported by the British Columbia Health Research Foundation and Medical Research Council of Canada.
These authors contributed equally to this work.
Present address: Department of Biochemistry and Molecular Biology, Heritage Medical Research Building, University of Calgary, Calgary, Alberta, Canada T2N 4N1.
Abbreviations:
- ES cell,
Embryonic stem cell;
- GC-MS,
gas chromatography-mass spectrophotometry;
- PACAP,
pituitary adenylate cyclase-activating polypeptide;
- TBST,
Tris-buffered saline with Tween 20.
