


Abstract
Plasma pyridoxic acid (PDA) and homovanillic acid (HVA) were recently identified as novel endogenous biomarkers of organic anion transporter (OAT) 1/3 function in monkeys. Consequently, this clinical study assessed the dynamic changes and utility of plasma PDA and HVA as an initial evaluation of OAT1/3 inhibition in early-phase drug development. The study was designed as a single-dose randomized, three-phase, crossover study; 14 Indian healthy volunteers received probenecid (PROB) (1000 mg orally) alone, furosemide (FSM) (40 mg orally) alone, or FSM 1 hour after receiving PROB (40 and 1000 mg orally) on days 1, 8, and 15, respectively. PDA and HVA plasma concentrations remained stable over time in the prestudy and FSM groups. Administration of PROB significantly increased the area under the plasma concentration-time curve (AUC) of PDA by 3.1-fold (dosed alone; P < 0.05), and 3.2-fold (coadministered with FSM; P < 0.01), compared with the prestudy and FSM groups, respectively. The corresponding increase in HVA AUC was 1.8-fold (P > 0.05) and 2.1-fold (P < 0.05), respectively. The increases in PDA AUC are similar to those in FSM AUC, whereas those of HVA are smaller (3.1–3.2 and 1.8–2.1 vs. 3.3, respectively). PDA and HVA renal clearance (CLR) values were decreased by PROB to smaller extents compared with FSM (0.35–0.37 and 0.67–0.73 vs. 0.23, respectively). These data demonstrate that plasma PDA is a promising endogenous biomarker for OAT1/3 function and that its plasma exposure responds in a similar fashion to FSM upon OAT1/3 inhibition by PROB. The magnitude and variability of response in PDA AUC and CLR values between subjects is more favorable relative to HVA.
Introduction
The kidney excretes a large variety of endogenous and exogenous compounds from the circulation as it is a principal elimination organ. A large fraction of the excretion is accomplished via multiple carrier transport systems contained in the renal proximal tubule cells. For many of these substances, tubular secretion includes initial basolateral uptake from the blood into proximal tubule cells and subsequent apical efflux into the urine (Morrissey et al., 2013; Nigam et al., 2015; Ivanyuk et al., 2017). For many organic anions, the basolateral uptake mediated by organic anion transporter (OAT) 1 and OAT3 is considered to be the rate-limiting step in renal tubular secretion (Watanabe et al., 2011; Mathialagan et al., 2017). Moreover, drug-drug interactions (DDIs) via OAT1/3 is a commonly encountered phenomenon and has been implicated in leading to enhanced or adverse drug reactions. For example, probenecid (PROB) markedly diminishes OAT1- and OAT3-mediated tubular secretion, resulting in clinically decreased renal secretion and consequently increased systemic exposures of a number of anionic drugs including furosemide (FSM) (Chennavasin et al., 1979; Smith et al., 1980; Vree et al., 1995), cefaclor (Welling et al., 1979), cefonicid (Pitkin et al., 1981), ciprofloxacin (Jaehde et al., 1995), dicloxacillin (Beringer et al., 2008), and famotidine (Inotsume et al., 1990). This property was used as a means to prolong the duration of action of penicillin during World War II (Gibaldi and Schwartz, 1968). Furthermore, several endogenous uremic toxins, such as hippuric acid, indoxyl sulfate, and p-cresol sulfate, are substrates and inhibitors of OAT1 and/or OAT3 (Hsueh et al., 2016; Kong et al., 2017; Wu et al., 2017).
Despite in vitro inhibition assays being generally good predictors of clinical OAT1/3 DDI, the mechanistic static models recommended by regulatory authorities into which in vitro data are incorporated are conservative by design, erring on the side of caution in DDI prediction with a high false-positive rate. Monitoring circulating endogenous biomarker levels in early-phase clinical trials is an attractive and cost-effective means of assessing transporter-mediated DDI potential (Chu et al., 2017; Mariappan et al., 2017; Muller et al., 2018; Rodrigues et al., 2018). A lack of change in systemic exposures of sensitive and selective endogenous probes may avoid costly clinical DDI studies prompted by false-positive predictions. This is particularly valuable for new molecular entities for which in vitro assays have shown borderline transporter-mediated DDI. Significant increases in plasma concentrations of endogenous biomarkers may lead to dedicated clinical DDI studies with drug probes. On the other hand, if drug-endogenous biomarker interactions can be reliably extrapolated to DDIs, such endogenous biomarkers could replace drug probes to define the likelihood of DDIs and minimize adverse events. In a recently issued draft Guidance for Industry about Drug-Drug Interaction Studies (October 2017), the use of serum/plasma creatinine level as an early index of organic cation transporter (OCT) 2, multidrug and toxin extrusion protein (MATE) 1 and MATE2K inhibition is recommended.
For both cost and logistical reasons, the ideal biomarker for OAT1/3 activity would be plasma based. Plasma is more convenient and is collected in most clinical studies for drug exposure measurement. For both drug and endogenous substrates that are mainly eliminated via OAT1- and OAT3-mediated renal tubule secretion, the declined activity of blood-facing OAT1/3 by an investigational drug increases the plasma concentrations of not only the substrate drug but also the endogenous probe. However, despite the benefits of circulating endogenous biomarkers, clinical plasma markers of OAT1 and OAT3 have not been identified.
In a recent study, we have suggested pyridoxic acid (PDA) and homovanillic acid (HVA) as endogenous candidate biomarkers of Oat1 and Oat3 function in cynomolgus monkeys (Shen et al., 2018). Pretreatment in monkeys with PROB dosed intravenously (40 mg/kg) either alone or in combination with FSM resulted in approximately 2-fold to 3-fold increases in the area under the plasma drug concentration-time curve (AUC). Further experiments using transporter-overexpressing cell models confirmed that PDA and HVA are substrates for human OAT1 and OAT3, as well as OAT2 (HVA), but they are not substrates for other major human renal and hepatic drug transporters, including OCT2, MATE1, MATE2K, organic anion transporting polypeptide (OATP) 1B1, OATP1B3, and NTCP (sodium-taurocholate cotransporting polypeptide) (Shen et al., 2018). Despite the promising results in preclinical animal and in vitro models, clear clinical evidence for these biomarkers is lacking.
Therefore, the aim of this study was to evaluate the systemic and renal disposition of PDA and HVA in a clinical DDI study between FSM and PROB to assess their utility as OAT1 and OAT3 functional biomarkers.
Materials and Methods
PROB tablets (Bencid; 500-mg tablets) were manufactured by Geno Pharmaceuticals Limited (Goa, India). FSM tablets (Lasix; 40-mg tablets) were manufactured by Sanofi India Limited (Mumbai, India). Reference standards PROB, FSM, and diclofenac sodium [internal standard (IS)] were purchased from Sigma-Aldrich (St. Louis, MO). PDA was purchased from Sigma-Aldrich, and HVA was purchased from Acros Organics (Geel, Belgium). Enalapril-D5 (IS) was obtained from CDN Isotopes (Pointe-Claire, QC, Canada). All other reagents and solvents used for liquid chromatography-tandem mass spectrometry (LC-MS/MS) were of high performance liquid chromatography (HPLC) grade, unless specified and were purchased from Sigma-Aldrich (Bangalore, India).
Subject Selection.
Healthy male volunteers between 18 and 45 years of age with normal body mass index (18.50–24.99 kg/m2), a minimum weight of 50 kg, and no clinically relevant conditions identified from the medical history, physical examination, electrocardiography, or chest X-ray were eligible for inclusion. Volunteers were excluded if any clinically relevant laboratory abnormalities were identified in clinical chemistry tests (including tests of hepatic and renal biochemistry), hematology tests, or urinalysis or if values for total bilirubin, alanine aminotransferase, aspartate aminotransferase, or alkaline phosphatase were outside the normal reference ranges at the start of the trial. Subjects were prohibited from taking supplements containing vitamin B6 during the course of the study because PDA is a metabolite of vitamin B6.
Clinical Study Design.
This was an open-label, three-treatment, three-period, single-dose crossover study in 14 healthy, male, Indian, adult subjects under fasting conditions. The study protocol and the informed consent were reviewed and approved by an independent ethics committee. The study was conducted in accordance with relevant Syngene Clinical Development standard operating procedures, International Council for Harmonization “Guidance on Good Clinical Practice,” (http://www.ich.org/fileadmin/Public_Web_Site/ICH_Products/Guidelines/Efficacy/E6/E6_R2__Addendum_Step2.pdf), Declaration of Helsinki (http://irb.sinica.edu.tw/doc/regulation/DECLARATION%20OF%20HELSINKI%20(2013).pdf), Central Drugs Standard Control Organization guidelines (http://www.cdsco.nic.in/writereaddata/cdsco-guidanceforindustry.pdf), Indian Council of Medical Research guidelines (https://www.icmr.nic.in/sites/default/files/guidelines/ethical_guidelines_0.pdf), and other applicable regulatory requirements. The clinical part of the study was conducted at one clinical site (Human Pharmacology Unit, Syngene International Limited Clinical Development, Electronics City, Bangalore, India). Subjects agreed to refrain from the use of any medicines for 14 days preceding the study. Each subject provided written informed consent prior to initiation of study procedures.
The trial consisted of three periods separated by a 7-day washout period between periods. Volunteers received 1000-mg PROB tablets (Bencid; Geno Pharmaceuticals Limited), 40-mg FSM tablets (Lasix; Sanofi India Limited), and 1000-mg PROB tablets plus 40-mg FSM tablets in periods 1, 2, and 3, respectively. In period 3, FSM tablet was administered 1 hour after the administration of PROB tablets. In each period, investigational products were administered orally with 240 ml of water after an overnight fast of at least 10 hours. A standardized meal was provided 4 hours postdose. In period 3, food was provided 4 hours after FSM dosing. Water was provided ad libitum except for 1 hour before and 1 hour after dose administration. In each period of the study, 12 blood samples were collected at predose and at 0.5, 1.0, 1.5, 2.0, 2.5, 3.0, 4.0, 6.0, 8.0, 12.0, and 24.0 hours postdose. In period 3, postdose samples were collected after FSM dose administration. Subjects were housed in the clinical facility 36 hours prior to dosing in period 1. Blood samples were collected at −24.0, −23.5, −23.0, −22.5, −22.0, −21.5, −21.0, −20.0, −18.0, −16.0, −12.0, and 0.0 hours (predose) to obtain the baseline readings of PDA and HVA in the absence of drug. Samples were collected into tubes containing dipotassium EDTA anticoagulant and centrifuged (2600g at 4°C for 10 minutes). Plasma was separated into two aliquots, which were stored at −70 ± 10°C until analysis.
On day −1 in period 1, predose urine samples were collected at −24 to −16, −16 to −8, and −8 to 0 hours to quantify endogenous compounds. On other days, urine samples were collected during 0–8, 8–16, and 16–24 hours postdose. The volume of urine in each interval was recorded. An aliquot of the urine sample (20 ml) was transferred into polypropylene tubes and stored at −70 ± 10°C until analysis.
Safety and tolerability were assessed with clinical evaluations, which included a physical examination and laboratory assessments. Adverse event monitoring in the form of clinical examination, a check of vital signs, and a subject well-being questionnaire was performed during the study.
Determination of PROB, FSM, PDA, and HVA Plasma Protein Binding.
Six independent samples of PROB, FSM, PDA, and HVA were tested in triplicate in a single experiment at a final concentration of 10 µM. Prior to assay execution, matrix sample plates were prepared by adding 50 µl of the human plasma to odd wells and 50 µl of assay buffer to even wells of each 96-well matrix plate. Matrix plates were then used to prepare assay samples, as described below, to normalize sample extraction steps and avoid matrix interference during sample analysis.
In preparation for equilibrium dialysis, rapid equilibrium dialysis (RED) assay plates (8000-Da molecular weight cutoff) (Thermo Fisher Scientific, Waltham, MA) and assay-ready sample plates were prepared. In each RED assay plate, 150 µl of assay buffer (133 mM sodium phosphate buffer, pH 7.4) was added to dialysate (odd) chambers of the plate. Assay-ready sample plates were prepared by first adding 3 µl of each compound [1 mM in 100% dimethylsulfoxide (DMSO)] to even columns of a 96-well polypropylene plate, followed by the addition of 300 µl of undiluted plasma to the same (even) columns. Then, 300 µl of assay buffer was added to the odd columns (empty wells) of assay-ready plates. Thus, assay-ready sample plates contained triplicate samples of PROB, FSM, PDA, or HVA (at 10 µM and 1% DMSO) premixed with appropriate plasma in even columns and with assay buffer in odd columns. After mixing, 200-µl aliquots of each sample were transferred from the assay-ready plates to the Thermo RED assay blocks. RED assay plates were then sealed and incubated with orbital shaking (2500 rpm) for 5 hours at 37°C, in a 10% CO2 atmosphere.
The remaining volume of the assay-ready samples was used to immediately generate time zero reference samples for each chamber by transferring 50-µl aliquots of assay-ready samples into the matrix sample plates (prepared earlier). Thus, samples from buffer columns of assay-ready plates were mixed with an equal volume of plasma, and samples from plasma columns were mixed with an equal volume of assay buffer. The postequilibrium 5-hour samples [time 5-hour buffer (T5h,buffer) and time 5-h plasma (T5h,plasma)] were prepared in a similar manner using the assay samples from the RED assay plate after a 5-hour incubation.
After thorough mixing of each assay sample in a matrix sample plate, 50-µl aliquots of the normalized samples were quickly transferred into 150 µl of acetonitrile containing two analytical ISs for sample extraction. Sample plates were sealed, vortexed, and centrifuged (4000g for 10 minutes), and 45 µl of supernatants were transferred to Axygen 384-well polypropylene plates (Corning, Corning, NY) containing 45 µl of HPLC-grade water for dilution prior to LC-MS/MS analysis.
The free fraction (percentage free) was calculated for each test sample of PROB, FSM, PDA, and HVA as follows:


Quantification of PROB and FSM by LC-MS/MS.
Stock solutions of PROB (2 mM), FSM (2 mM), and diclofenac (2 mM, IS) were prepared in DMSO (Spectrochem Private Limited, Mumbai, India). Further dilutions of PROB and FSM were prepared in DMSO as required. IS diclofenac (100 nM) was prepared in acetonitrile.
Plasma calibration standards for PROB and FSM were prepared from 39 to 20,000 nM by diluting them serially with plasma to obtain 10 standards. Similarly, quality control (QC) samples in plasma for PROB and FSM were prepared at the following three levels: 100 nM (low QC), 4000 nM (middle QC), 16,000 nM (high QC), respectively. QC samples in urine were prepared at two levels (50× low QC and 50× high QC), which were diluted in control plasma by 50-fold.
Sample extractions for PROB and FSM were conducted in 96-well plates using protein precipitation with acetonitrile. In brief, 25 µl of study and QC plasma samples for PROB and FSM measurement was mixed with 200 µl of ice-cold acetonitrile containing 100 nM diclofenac in a hydrophilic Solvinert plate (Millipore Sigma, Billerica, MA). Samples were vortex mixed and centrifuged at 4°C and 4000 rpm for 5 minutes. A 4-µl aliquot was injected onto an LC-MS/MS unit for analysis. In the case of urine samples, samples/QCs in urine were diluted 50× in control plasma, and extractions were performed a manner similar to that described above. Study samples with concentrations above the limit of quantification were appropriately diluted in the control plasma so as to measure the signal within the calibration range.
The liquid chromatography system ACQUITY UPLC consisted of ACQUITY binary solvent manager and ACQUITY sample manager with sample organizer (Waters, Milford, MA). Chromatographic separation was achieved by gradient elution on an Acquity C18 BEH, 1.7 µm, 2.1 × 50 mm column (Waters) maintained at 40°C. The mobile phase was a mixture of 0.1% formic acid in 10 mM ammonium formate (mobile phase A) and 0.1% formic acid in acetonitrile (mobile phase B). The gradient program was set as follows: 10% mobile phase B to 90% mobile phase B in 1.2 minutes, held in 95% mobile phase B for 0.8 minute, 95% mobile phase B to 10% mobile phase B in 0.8 minute, and held in 10% mobile phase B for 0.2 minute. The flow rate was 0.6 ml/min.
Mass spectrometric detection for PROB and FSM were performed on an AB Sciex 4000 QTRAP (Applied Biosystems, Foster City, CA), equipped with an electrospray ionization source. The mass spectrometer was operated in negative ion mode, and multiple reaction monitoring transitions were used for PROB [charge/mass ratio (m/z), 284 > 240] and FSM (m/z, 329.2 > 205) detection. The instrument settings of mass spectrometers were as follows: ion spray voltage, 5.5 kV; temperature, 550°C; for PROB: declustering potential (DP), −94 V; collision energy (CE), −21 V; for FSM: DP, −60 V; CE, −31 V; for diclofenac: DP, −50 V; CE, −16 V. The entrance potential of 10 V, and collision cell exit potential of 15 V were same for all of the analytes. All peak integration and data processing were performed using Analyst version 1.6.2. (Applied Biosystems). Concentrations of PROB and FSM in study samples were determined from the weighted (1/x2) linear calibration curve obtained by plotting area ratios (analyte-to-IS signal) against known concentrations of analyte in calibration standards.
Quantification of PDA and HVA by LC-MS/MS.
Stock solutions of HVA (2.13 mM in water), PDA (9.5 mM in 0.5% NH4OH), and enalapril-D5 (2.62 µM in methanol, IS) were prepared. The calibration standards were obtained via serial dilutions with artificial matrix buffer (0.1% bovine serum albumin in PBS) affording a range from 5.7 to 14,250 nM for HVA and a range from 5.6 to 14,000 nM for PDA. As a QC criteria, the calibration curves were analyzed in triplicate and required a tolerance of 20%.
For sample preparation, 75 µl of sample (plasma, urine, calibration standard), 200 µl of IS (i.e., enalapril-D5) (1000 ng/ml), and 25 µl of matrix buffer were added to 96-well plates for protein precipitation (Impact Protein Precipitation, PN-CEO-7565; Phenomenex, Torrance, CA). Samples were vortex mixed for 1 minute and centrifuged for 3 minutes at 2800 rpm. The eluent was collected in 96-well plates and concentrated to dryness under nitrogen at 50°C. For LC-MS/MS analysis, the samples and calibration standards were reconstituted in 50 µl of aqueous solvent (water/methanol, 98:2), vortexed for 5 minutes at 2000 rpm, and centrifuged for 3 minutes at 2800 rpm. The supernatant was transferred to a 96-well plate and centrifuged again for 3 minutes at 2800 rpm. A 10-µl aliquot was injected into the LC-MS system for analysis. To avoid photolytic degradation of the analytes, the samples were protected from direct light exposure during preparation and analysis.
The liquid chromatography system ACQUITY UPLC consisted of an ACQUITY binary solvent manger and an ACQUITY sample manager with sample organizer (Waters). Chromatographic separation was achieved by gradient elution on an XBridge C18, 3.5 µm, 2.1 × 100 mm column (PN-186003022; Waters) maintained at 50°C. The mobile phase was 0.1% formic acid in water (mobile phase A) and 0.1% formic acid in acetonitrile (mobile phase B). The gradient program was set as follows: 2% mobile phase B to 20% mobile phase B in 3 minutes, 20% mobile phase B to 98% mobile phase B at 4 minutes, hold at 98% mobile phase B for 1 minute, return to 2% mobile phase B in 0.01 minute, and hold for 1 minute for equilibration. The flow rate was 0.5 ml/min.
Mass spectrometric detection for HVA and PDA were performed on an AB Sciex 6500+ System (Applied Biosystems), equipped with an electrospray ionization source. The mass spectrometer was operated in negative ion mode and multiple reaction monitoring transitions were used for detection of HVA (m/z, 181.0 > 122.0), PDA (m/z, 182.1 > 108.0), and enalapril-D5 (m/z, 380.3 > 114.2). The instrument settings of the MS systems were as follows: ion spray voltage, −4.5 kV; temperature, 550°C; for HVA: DP, −40 V; CE, −35 V; for PDA: DP, −40 V; CE, −30 V; for enalapril-D5: DP, −150 V; CE, −35 V ; entrance potential, −10 V; cell exit potential, −10 V for all analytes. All peak integration and data processing were performed using MultiQuant 3.0.2. (Applied Biosystems). Concentrations of HVA and PDA in study samples were determined from the weighted (1/x2) linear calibration curve obtained by plotting the area count against known concentrations of analyte in calibration standards. Because of signal suppression of the IS in plasma and urine when compared with the artificial matrix buffer, the IS was used to monitor the system performance throughout the analyses, but the IS was not used to compute analyte/IS ratios.
Pharmacokinetic and Statistical Analysis.
The pharmacokinetic parameters were obtained by noncompartmental analysis of plasma concentration versus time data (Phoenix WinNonlin software, version 6.4; Certara USA, Inc., Princeton, NJ). The Cmax and time to reach Cmax (Tmax) were recorded directly from experimental observations. The area under the plasma concentration-time curve from zero up to the last observed concentration (AUC0-last) was calculated using the mixed log-linear trapezoidal rule up to the last detectable concentration and extrapolated to infinity (AUC0–∞). Estimations of AUC and the terminal elimination rate constant were made using a minimum of three time points with quantifiable concentrations. Concentrations below the limit of quantitation were considered as zero for calculations. For blood samples collected beyond 2 minutes of scheduled time, the actual time of sample collection was considered for pharmacokinetic calculations.
Renal clearance (CLR), renal extraction ratio, and renal secretion clearance (CLsec) were estimated by the following equations:


where X0-24h is the cumulative amount excreted in the urine during the time interval from zero to 24h, fu is the plasma unbound fraction, and GFR is the glomerular filtration rate in humans (125 ml/min) (Davies and Morris, 1993).
Statistical differences between treatments were determined using a paired two-tailed Student’s t test. (GraphPad Prism version 7; GraphPad Software, Inc., San Diego, CA). A P value of <0.05 was considered to be statistically significant (*P < 0.05, **P < 0.01, and ***P < 0.001).
Results
Study Participants.
A total of 14 healthy South Asian Indian male volunteers with a mean ± S.D. age of 25.6 ± 4.1 years, a mean weight of 62.5 ± 6.6 kg, and a mean body mass index of 22.2 ± 2.1 kg/m2 were enrolled in this study. All subjects completed three phases of the study (Fig. 1). None of the subjects reported taking concomitant medications or dietary substances known to modulate the transport activity of OAT1/3 and the metabolism of PDA and HVA. No adverse events were observed in the study.
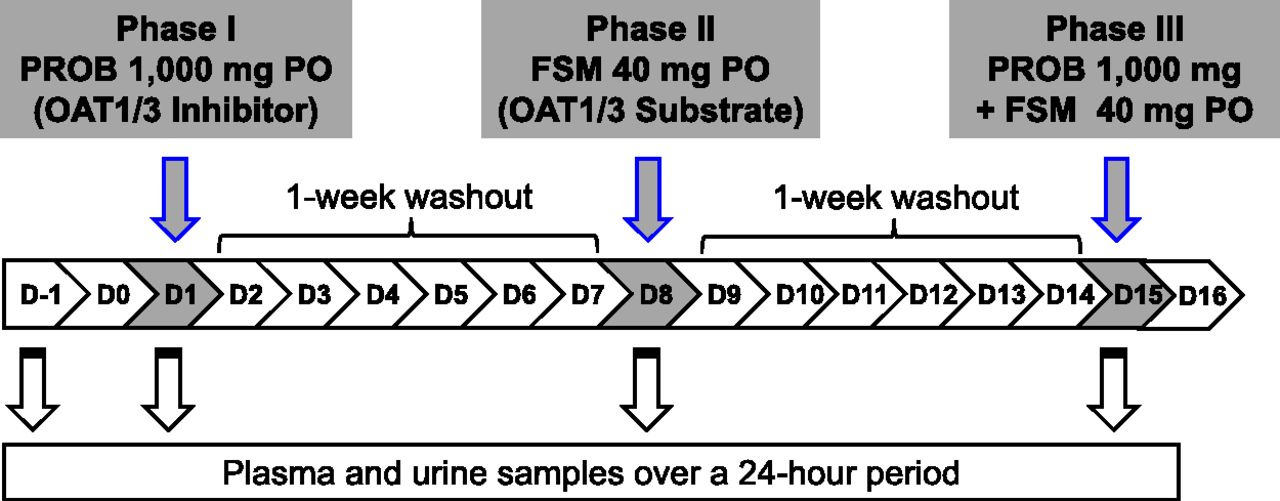
Outline of clinical study to validate PDA and HVA as OAT1/3 endogenous biomarkers. Light gray highlight indicates clinical dosing scheme for oral (PO) PROB (OAT1/3 inhibitor) alone, FSM (OAT1/3 substrate) alone, and with PROB on days 1, 8, and 15, respectively. Blood and urine samples were collected to measure drug and endogenous biomarker levels on days 1, 8, and 15. On day −1 (before the study), blood and urine samples were obtained to measure basal levels of endogenous biomarkers.
Pharmacokinetics of PROB in Humans.
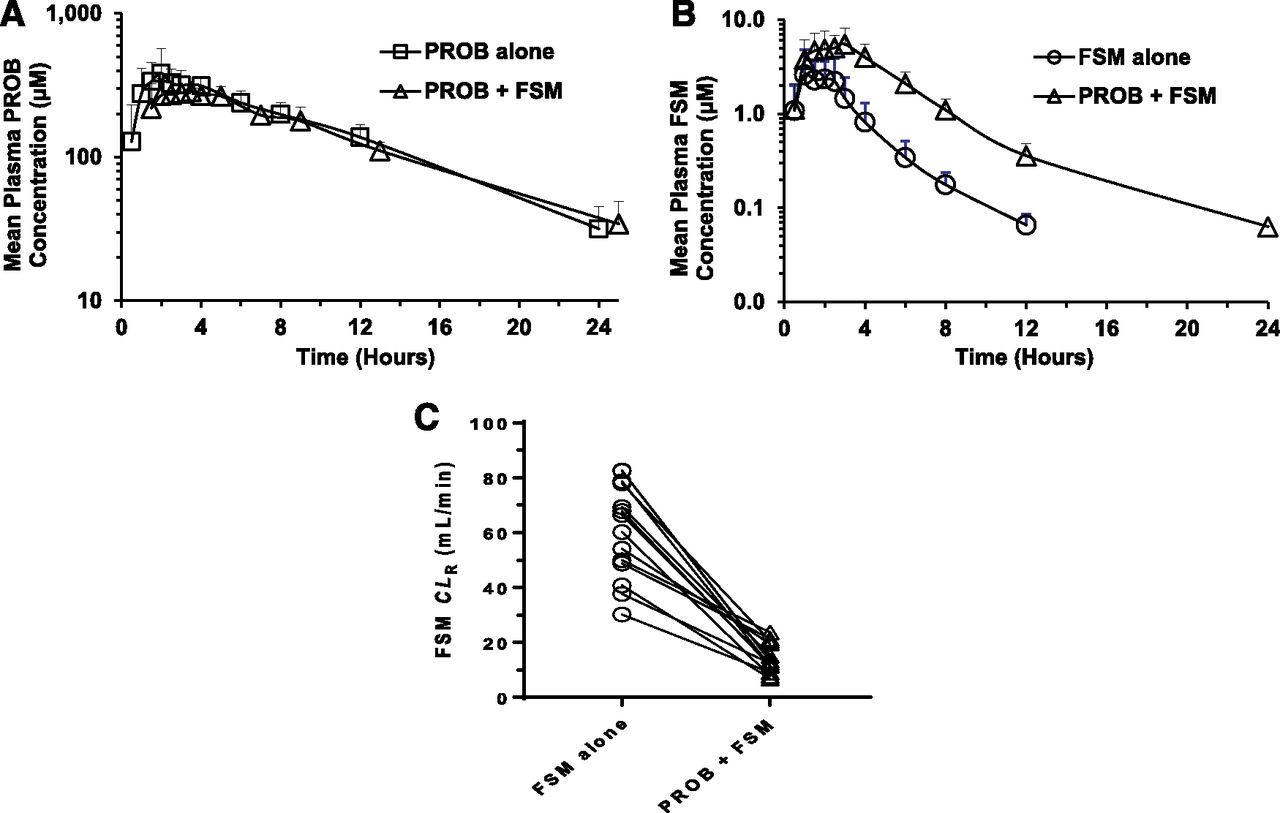
The mean plasma concentration-time profiles of PROB, a well-known inhibitor of OAT1/3, after the administration of PROB alone and with FSM in healthy volunteers are shown in Fig. 2a. There were no statistically significant differences in the pharmacokinetic parameters for PROB, including the following: minimum concentration (Cmin), AUC0-last, and terminal elimination half-life (T1/2) between the two treatments (Table 1). For PROB, human plasma protein binding was experimentally determined to be 93.8% (fu = 0.062) because the values reported there have quite large discrepancies. As a result, the calculated free Cmax values were 27.0 ± 9.7 and 20.2 ± 2.5 µM after the administration of PROB alone and in combination with FSM, respectively. These concentrations exceed the in vitro IC50 values for PROB toward human OAT1 and OAT3 determined by in-house assays (9.0 ± 1.6 and 7.9 ± 1.1 µM, respectively; data not shown). The Cmax of PROB and the Tmax were significantly different between the two treatments even though the difference was small (i.e., within 1.5-fold) (Table 1).

Mean plasma concentration-time profile of PROB (A) and FSM (B) after oral administration of PROB alone (open squares), FSM alone (open circles), and coadministration of PROB and FSM (open triangles) to 14 health volunteers. The data are expressed as the arithmetic mean ± S.D. of 14 healthy volunteers. (C) Individual FSM CLR values after oral administration of FSM alone (open circle) and in combination with FSM (open triangle).
Summary of primary pharmacokinetic parameters for FSM and PROB in 14 healthy volunteers
All study drugs were given orally. PROB was dosed 1 h prior to FSM administration in the coadministration treatment group. Pharmacokinetic parameters were determined as described in Materials and Methods. Data are shown as mean ± S.D. Geometric mean ratio (GMR) is back-transformed from log scale of the ratio of pharmacokinetic parameter in the coadministration treatment group over that in FSM or PROB alone group. The 90% distribution CI of pharmacokinetic parameter is presented under the 90% CI column.
Effects of PROB on Pharmacokinetics of FSM in Humans.
The effect of PROB on the pharmacokinetics of FSM, a probe drug of OAT1/3, was evaluated in both plasma and urine after the administration of FSM alone and in combination with PROB in the healthy volunteers (Fig. 2; Table 1). The oral pretreatment with 1000 mg of PROB increased the mean plasma concentrations of FSM at all times over a 24-hour postdose period (Fig. 2b). As a result, significant increases in AUC0–last and AUC0–∞ were observed (8.7 ± 3.3 vs. 27.5 ± 7.6 and 8.9 ± 3.3 vs. 28.7 ± 7.7 µM/h, respectively; P < 0.001) (Table 1). The geometric mean ratio and 90% confidence intervals (CIs) for both FSM AUC0–last and AUC0–∞ were 3.3 (2.9–3.8). Similarly, PROB significantly increased the Cmax of FSM, although the increase is smaller than that seen in the AUC0–last and AUC0–∞ values [4.1 ± 1.8 vs. 7.1 ± 2.3 µM, P < 0.001; 1.8 (90% CI, 1.5–2.2)]. The FSM human plasma protein binding was experimentally determined to be 97.7% (fu = 0.023). As a result, in agreement, PROB significantly decreased total clearance (CL/F), CLR, and CLsec, values of FSM (254.5 ± 86.8 vs. 74.3 ± 16.8, 60.5 ± 17.3 vs. 14.2 ± 5.2, and 57.6 ± 17.3 vs. 11.3 ± 5.2 ml/min, respectively; P < 0.001). The CLR values of FSM were consistently reduced by PROB for each individual (Fig. 2c). The pretreatment with PROB decreased the apparent volume of distribution of FSM to the same extent as CL/F [0.32 (90% CI, 0.26–0.40) vs. 0.30 (90% CI, 0.26–0.34)], resulting in no effect on the T1/2 of FSM (2.4 ± 0.7 vs. 2.5 ± 0.5 hours; P > 0.05). The Tmax of FSM (1.4 ± 0.7 vs. 1.8 ± 0.8 hours; P > 0.05) was not altered by PROB (Table 1).
Effects of PROB on Plasma Concentrations and CLR of PDA and HVA in Humans.
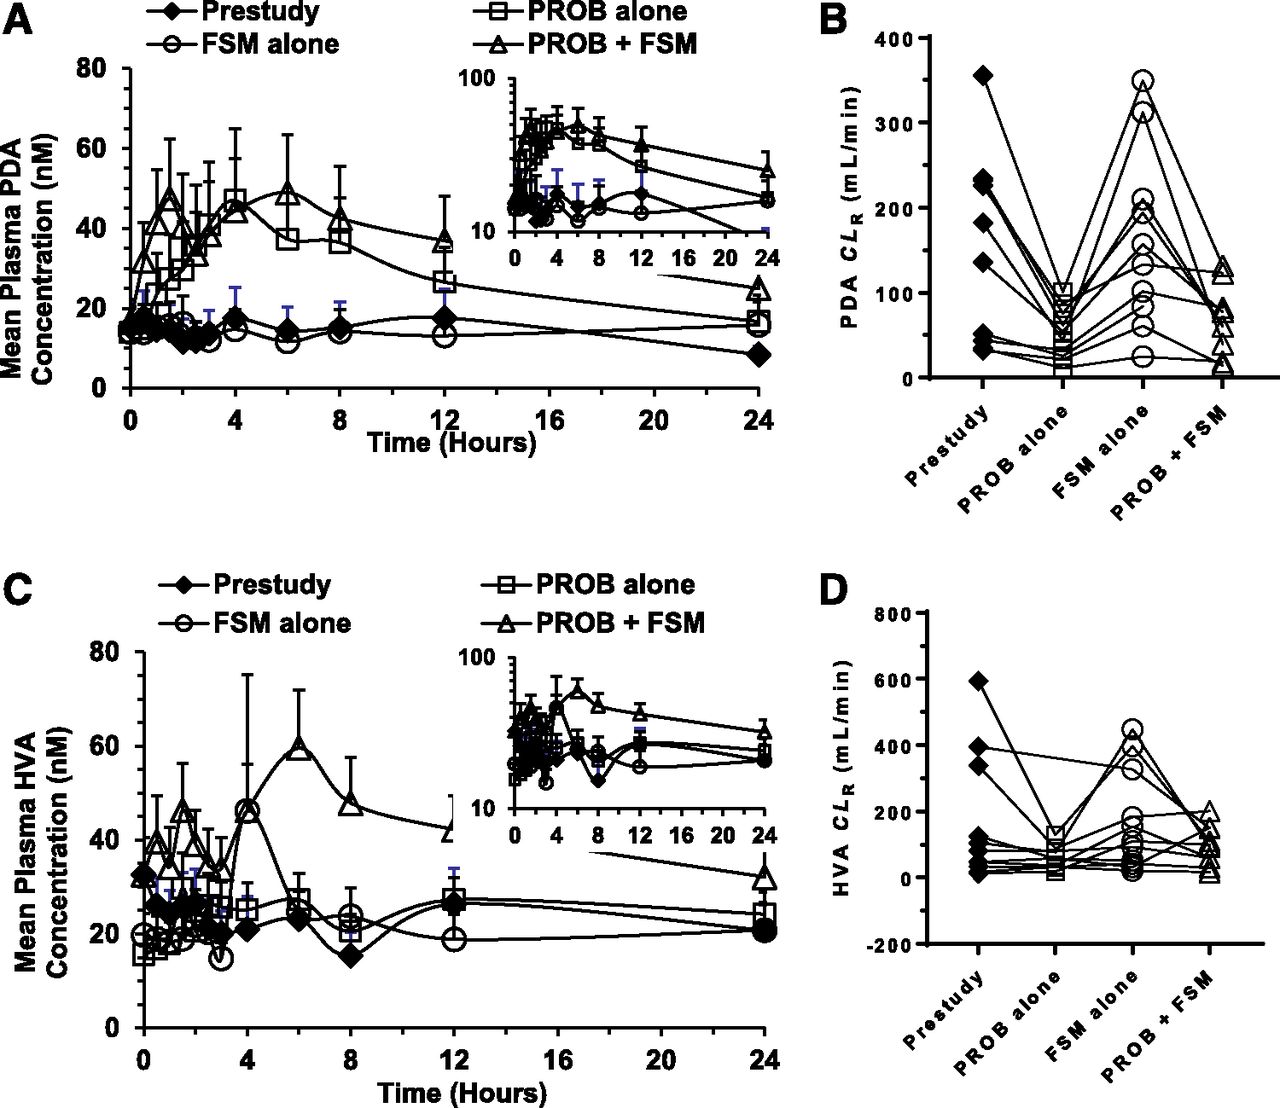
As with FSM, the effects of PROB, a well-established inhibitor of OAT1/3, were evaluated on the pharmacokinetics of PDA and HVA before drug administration (prestudy), and after the administration of FSM alone and PROB alone, and in combination with FSM (Fig. 3; Table 2). PROB administered alone and in combination with FSM caused a significant and consistent increase in the plasma concentration-time profile of PDA (Fig. 3a), which resulted in an increase in AUC of 3.1-fold and 3.2-fold compared with prestudy and therapy with FSM alone, respectively (AUC0–last: 634 ± 823 vs. 251 ± 293 and 829 ± 951 vs. 316 ± 413 nM/h, respectively; P < 0.05). These increases in plasma PDA concentration by PROB treatments were consistent throughout a 24-hour period, although the baseline plasma PDA concentration between subjects varied widely. The plasma PDA concentrations, from 0.5 to 24 hours after the dose of PROB, were greater than those of the prestudy or FSM-alone groups, and the concentrations peaked at approximately 4 hours, returning to baseline within 24 hours after PROB administration. As a result, PROB significantly increased the Cmax values of PDA by 3.1-fold to 3.4-fold (50.5 ± 62.7 vs. 18.1 ± 24.9 and 55.4 ± 55.8 vs. 19.6 ± 24.4 nM, respectively; P < 0.01). The human plasma protein binding of PDA was experimentally determined to be 90.8% (fu = 0.092). In agreement with the increases in systemic exposure of PDA, the CLR and CLsec values of PDA were decreased by PROB pretreatments to 31%–40% of their baseline values (Table 2).

Mean plasma concentration-time profile and individual CLR values of PDA (A and B) and HVA (C and D) before administration (prestudy; close diamonds) and after oral administration of PROB alone (open squares), FSM alone (open circles), and in combination with PROB (open triangles) to 14 health volunteers. The data are expressed as the arithmetic mean ± S.D. of 14 subjects. Inset depicts the same data on a semilogarithmic scale.
Summary of primary pharmacokinetic parameters for PDA and HVA in 14 healthy volunteers
All study drugs were given orally. PROB was dosed 1 h prior to FSM administration in the coadministration treatment group. Pharmacokinetic parameters were determined as described in Materials and Methods. Data are shown as the mean ± S.D. The fu of HVA was not determined because the bioanalytical method could not achieve adequate sensitivity. As a result, the CLsec value was not calculated.
The plasma concentration-time profile of HVA showed a relatively weak and inconsistent increase after the administration of PROB alone and in combination with FSM, compared with the prestudy and FSM-alone groups (AUC0–last: 505 ± 321 vs. 438 ± 441 and 868 ± 603 vs. 466 ± 480 nM/h, respectively) (Fig. 3c; Table 2). Indeed, the administration of PROB alone did not change AUC0–last and Cmax values significantly (P > 0.05) [1.8 (90% CI, 0.98–2.9) and 1.2 (90% CI, 0.85–1.7), respectively]. In addition, PROB did not influence the CLR of HVA significantly (61.1 ± 33.7 vs. 163 ± 192 and 97.2 ± 58.0 vs. 169 ± 153, ml/min, respectively; P > 0.05). The fu of HVA was not determined because the bioanalytical method could not achieve adequate sensitivity. As a result, the CLsec of HVA was not calculated.
Assessment of Correlation Between Increased Plasma Concentrations of PDA and FSM by PROB.
To further study the potential of plasma PDA concentrations as an index of OAT activity, we correlated the net fold increase in PDA AUC ratio (∆AUCR) with that of FSM after PROB pretreatment in this study. Figure 4a showed the presence of a significant and positive correlation between PDA and FSM ∆AUCR using linear regression (r2 = 0.60; P < 0.01).

(A) Relationship between net fold ∆AUCR values of PDA and FSM after the administration of PROB. The line represents linear least-squares regression of the data. (B) Plasma concentrations of PDA over a 24-hour period on day −1 (prestudy) in 14 healthy volunteers. (C) Plasma concentrations of PDA just prior to a dose (t = 0 hour) on days −1, 1, 8, and 15 in 14 healthy volunteers. (D and E) Effect of PROB on plasma PDA concentrations in subject 5 and subject 10, subjects with widely different basal PDA levels. (F) Relationship between the AUC0–last values and fold changes in AUCR of PDA after the administration of PROB.
To determine the extent of interindividual and intraindividual variability of plasma PDA concentration-time profiles, the plasma PDA concentrations over a 24-hour period on day −1 (prestudy) and at 0 hour (basal level) on days −1, 1, 8, and 15 in 14 healthy volunteers were studied (Fig. 4, b and c). There were significant differences in the prestudy PDA concentrations between subjects (P = 0.037), with maximal difference approximately 33-fold (Fig. 4b). However, there were no significant within-subject differences in PDA concentrations at various time points over a 24-hour period on day −1 (P = 0.227) (Fig. 4b). In addition, as shown in Fig. 4c, the basal plasma concentrations (t = 0 hour) of PDA over a 17-day period were not significantly different between different days for each subject (P = 0.493). Because the intraindividual variability of PDA basal plasma concentrations is low, we recommend that the prestudy concentration of PDA for each subject serve as the control subject for the assessment of OAT1/3 activity. For example, despite very different basal PDA levels between subject 5 and subject 10, both subjects showed approximately 2-fold to 4-fold higher AUC0–last values of PDA compared with the control subjects (Fig. 4, d and e). Furthermore, no significant correlation was observed between the basal PDA levels and PDA AUCR after the administration of PROB in all subjects.
Discussion
We have previously shown that the endogenous PDA and HVA are substrates for human OAT1 and OAT3, and experiments in cynomolgus monkeys treated with PROB, a strong inhibitor of OAT1/3 transporters, suggested that PDA and HVA might have potential as plasma-based endogenous biomarkers for OAT1/3 transporter activity (Shen et al., 2018). The current study was conducted to assess the suitability of PDA and HVA as clinical plasma-based OAT1 and OAT3 endogenous biomarkers by characterizing the pharmacokinetics of PDA and HVA in plasma and urine with and without coadministration of PROB and comparison with the accepted probe substrate for OAT function, FSM (Fig. 1). There is limited clinical information on PDA levels, but some information is available on how PDA levels are related to aspects of kidney function. Transporter-mediated renal tubular secretion was demonstrated because the CLR of PDA was approximately twice the creatinine clearance in healthy women (Coburn et al., 2002). Also, plasma PDA concentrations were markedly increased in patients with chronic kidney disease and kidney failure (Allman et al., 1992; Busch et al., 2010).
The major novel findings of this investigation are that PROB inhibits OAT1- and OAT3-mediated transport of FSM, HVA, and PDA in vivo, resulting in a significant and consistent increase in the AUC values of these exogenous or endogenous probes in healthy volunteers. Similar to a cynomolgus monkey OAT1/3 DDI study (Shen et al., 2018), the administration with PROB alone (1000 mg) increased the AUC0–last values of PDA and HVA in 14 healthy volunteers by 3.1-fold and 1.8-fold, respectively, compared with prestudy levels (Fig. 3; Table 2). In agreement, the administration of PROB in combination with FSM increased the AUC0–last values of PDA and HVA by 3.2-fold and 2.1-fold, respectively, compared with FSM alone. Similar increases were observed for FSM, a sensitive clinical OAT1/3 probe substrate, with the coadministration of PROB causing increases in the Cmax and AUC0–last values of FSM by 1.8-fold and 3.3-fold, respectively, in the same subjects (Fig. 2; Table 1). The increases in the AUC of coadministered FSM reported in other clinical studies were 2.7-fold to 3.6-fold (Chennavasin et al., 1979; Smith et al., 1980; Vree et al., 1995). These results demonstrate, to the best of our knowledge, the first evidence of an endogenous substrate where plasma concentrations respond in a sensitive and consistent fashion to the strong OAT1/3 inhibition by PROB. Of the two candidate biomarkers examined, the increases in PDA levels by PROB treatments were more pronounced than those of HVA (Fig. 3, a and c) and reached a level of significance not achieved by HVA (P = 0.031 and 0.008 vs. P = 0.421 and 0.020). In addition, the variation in the plasma concentration of PDA was smaller than that of HVA. Therefore, PDA is a more appropriate clinical plasma-based endogenous probe than HVA. According to the US Food and Drug Administration DDI draft guidance, adefovir (OAT1), ganciclovir (OAT1), and benzylpenicillin (OAT3) are recommended as in vivo substrate drugs for clinical DDI studies and/or drug labeling. It is worth noting that 750 and 1500 mg PROB pretreatments increased the AUCs of adefovir and benzylpenicillin to a similar extent compared with PDA (AUCR, 1.8–3.3 vs. 3.1–3.2) (Maeda et al., 2014).
To date, reports have identified several potential functional biomarkers of OAT1 and OAT3, which include 6β-hydroxycortisol (6βHC) (Imamura et al., 2014), taurine, and glycochenodeoxycholate sulfate (GCDCA-S) (Tsuruya et al., 2016). However, PROB did not significantly increase the plasma concentrations of these endogenous compounds, although the OAT1/3 inhibitor significantly decreased the CLR values of the three compounds. The inhibition toward OAT1/3 by PROB would be expected to result in an increase in plasma concentrations of the endogenous biomarkers if OAT1/3-mediated renal tubular secretion is a major elimination pathway for these compounds. Additionally, 6βHC and GCDCA-S are not selective substrates for human OATs since they are also substrates for MATE1/2K (6βHC) and OATP1B1 (GCDCA-S). Additionally, 6βHC is formed by CYP3A4, which will add to the potential for complex DDIs (Imamura et al., 2014; Tsuruya et al., 2016; Takehara et al., 2017). In contrast, PDA was demonstrated to be a specific substrate for OAT1/3 by using in vitro phenotyping experiments (Shen et al., 2018). PDA is a substrate for human OAT1 and OAT3 with Michaelis-Menten constant (Km) values that correspond to the substrate concentration at which the uptake rate is half of maximum rate of 33.0 ± 5.3 and 52.1 ± 15.3 µM, respectively. It is not a substrate for other major renal and hepatic drug transporters, including OCT2, MATE1, MATE2K, OATP1B1, and OATP1B3 (Shen et al., 2018). PDA may be a substrate for luminal transporters multidrug resistance-associated protein (MRP) 2 and MRP4, and the inhibition of MRP2- and MRP4-mediated renal secretion from renal tubule cells in urine may result in the increase of systemic exposure of PDA. Additionally, caution must be used in interpreting the results of an increase in PDA plasma level in view of the report that PDA is the end product of vitamin B6 metabolism (Ink and Henderson, 1984; Merrill and Henderson, 1990), and PDA is formed from pyridoxal by the action of aldehyde oxidase (Schwartz and Kjeldgaard, 1951) or by the action of an NAD-dependent aldehyde dehydrogenase (Stanulovic et al., 1976). It is possible that PROB or any new chemical entity may inhibit the enzymes involved in PDA synthesis in the intestine and liver and complicate the analysis of OAT function. Further, the intraindividual difference in basal plasma PDA concentrations may be partially due to the difference in formation from pyridoxal between subjects. It is important to note that a new chemical entity may selectively inhibit OAT1 or OAT3. Because of the lack of information on the relative contribution of OAT1 and OAT3 to the renal uptake of PDA, PDA may underestimate the impact of clinical DDI caused by the specific inhibition of OAT1 or OAT3. Therefore, there is a need to identify and verify a selective endogenous biomarker for OAT1 or OAT3 to fill the gaps.
Renal elimination is the major elimination pathway for FSM and the mean fraction of unchanged drug excreted in the urine is 0.64 (Benet, 1979). In line with the increases in PDA systemic exposure, PROB significantly reduced CLR and CLsec values of PDA by 2.5-fold to 3.2-fold in healthy volunteers, even though the magnitude of CLR and CLsec reduction are smaller than those of FSM (2.5-fold to 3.2-fold vs. 4.3-fold to 5.3-fold) (Tables 1 and 2). We estimated that the mean active renal tubular secretion clearance of PDA in the prestudy group was 215 ± 268 ml/min (PDA fu = 0.092), which accounts for the majority of PDA CLR (227 ± 268 ml/min). The mean peak PDA plasma concentrations ranged from 18.1 to 55.4 nM in the study, which are well below the Km values for OAT1- and OAT3-mediated PDA transport (33.0–52.1 µM) (Shen et al., 2018). Therefore, saturation of the transporter-mediated uptake of PDA from the blood into renal proximal tubule cells is unlikely at the PDA concentrations observed in this clinical study. Given the fact that the unbound fraction of PROB is 0.062, the mean PROB unbound peak and trough concentration ranges were estimated to be 20.2–27.0 and 2.1–2.2 µM, respectively. PROB is a potent inhibitor of OAT1 and OAT3 compared with other drug transporters (Shen et al., 2018). Although the geometric mean IC50 values of PROB for OAT1 and OAT3 are 8.2 and 5.8 µM, respectively, those for OCT2, MATE1, OATP1B1, OATP1B3, and P-glycoprotein are >300, >25, 179, 130, and >1000 µM, respectively (Shen et al., 2018). Taken together, it is likely that the CLR of PDA is decreased because of the selective inhibition of OAT1/3 by PROB.
To further explore the utility of PDA as an endogenous biomarker of OAT1/3, we assessed the correlation between increased AUCs of PDA and FSM by PROB. The magnitude of PROB-induced increases of PDA AUC positively correlated between PDA and FSM (r2 = 0.60; P < 0.05) (Fig. 4a), suggesting that individuals who had a relatively large increase in PDA AUC also had a relatively large increase in FSM AUC and vice versa. Despite the limited number of subjects, this result showing a positive correlation between drug and endogenous biomarker in a DDI setting makes the PDA results even more meaningful and increases the potential for quantitative translation. As shown in Fig. 4b, for each volunteer the basal plasma PDA levels were studied over a 17-day period and the concentrations were found to be stable throughout the experiment, although interindividual variability is large. In addition, the degree of intraindividual variability of PDA plasma concentrations over a 24-hour period before drug administration (prestudy) is low. Therefore, for each subject, the predose level can serve as his or her own control for the assessment of OAT1/3 activity. However, it is worth noting that the plasma PDA concentration is affected by many factors including dietary supply, disease, and metabolic interconversion. For example, supplementation with pyridoxine has been shown to increase the plasma PDA concentration by approximately 50-fold in humans (Ciorba, 2013). Additionally, the plasma PDA concentration was altered by several fold in patients with renal impairment and cirrhosis (Henderson et al., 1986; Merrill and Henderson, 1987; Coburn et al., 2002). Factors leading to variability in baseline PDA levels will require additional study to determine whether they would impact the PDA response. Changes in plasma PDA concentration were measured in male subjects in this study. There is a limited literature that examines the difference between males and females in plasma PDA level. The sex-dependent change in plasma PDA concentration could be a factor relevant to the utility of PDA as endogenous biomarker of OAT1/3 inhibition in females.
In summary, comparative investigation of the response of both a drug and a candidate endogenous compound in a clinical DDI study demonstrated the quantitative translational value of PDA as a clinical blood-based endogenous probe of OAT1 and OAT3 activity. These promising results will require further evaluation to explore factors such as basal plasma PDA concentration stability, impact of disease, and sex. Despite these caveats, our results demonstrate that endogenous plasma PDA levels have great potential as a useful maker of OAT1/3 activity.
Acknowledgments
We thank Susan Lubin and Dr. Ming Zheng for reviewing the clinical study protocol.
Authorship Contributions
Participated in research design: Shen, Holenarsipur, Mariappan, Gan, Shipkova, Marathe, and Humphreys.
Conducted experiments: Cantone, Rajanna, Singh Gautam, and Zhang.
Contributed new reagents or analytic tools: Shen, Drexler, Cantone, Shipkova, and Humphreys.
Performed data analysis: Shen, Holenarsipur, Zhang, Marathe, and Humphreys.
Wrote or contributed to the writing of the manuscript: Shen, Holenarsipur, Drexler, Marathe, and Humphreys.
Footnotes
- Received August 3, 2018.
- Accepted October 23, 2018.
Abbreviations
- AUC
- area under the plasma concentration-time curve
- AUC0-∞
- area under the plasma concentration-time curve from time 0 extrapolated to infinity
- AUC0-last
- area under the plasma concentration-time curve from zero up to the last observed concentration
- AUCR
- area under the plasma concentration-time curve ratio
- CE
- collision energy
- CI
- confidence interval
- CL/F
- total clearance
- CLR
- renal clearance
- CLsec
- renal secretion clearance
- Cmin
- minimum concentration
- DDI
- drug-drug interaction
- DMSO
- dimethylsulfoxide
- DP
- declustering potential
- FSM
- furosemide
- fu
- plasma unbound fraction
- GCDCA-S
- glycochenodeoxycholate sulfate
- HPLC
- high-performance liquid chromatography
- HVA
- homovanillic acid
- IS
- internal standard
- Km
- Michaelis-Menten constant
- LC-MS/MS
- liquid chromatography-tandem mass spectrometry
- m/z
- charge/mass ratio
- MATE
- multidrug and toxin extrusion protein
- MRP
- multidrug resistance-associated protein
- OAT
- organic anion transporter
- OATP
- organic anion transporting polypeptide
- OCT
- organic cation transporter
- PDA
- pyridoxic acid
- PROB
- probenecid
- RED
- rapid equilibrium dialysis
- 6βHC
- 6β-hydroxycortisol
- T1/2
- terminal elimination half-life
- Tmax
- time to reach Cmax
- Copyright © 2018 by The American Society for Pharmacology and Experimental Therapeutics


