


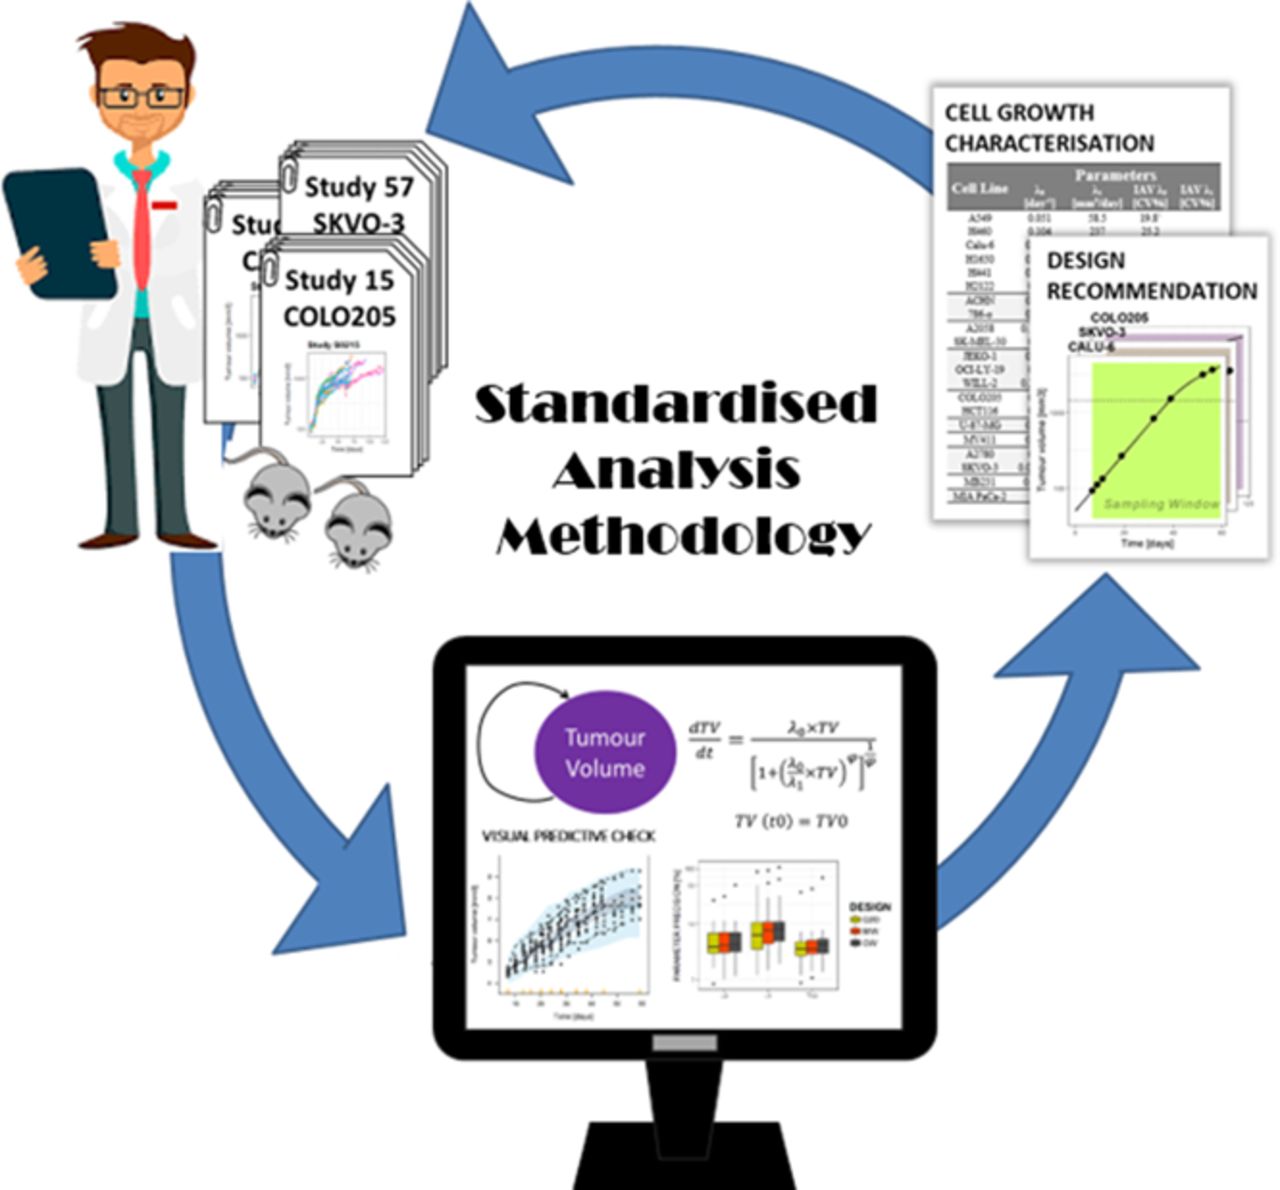
Visual Overview

Abstract
Xenograft mice are largely used to evaluate the efficacy of oncological drugs during preclinical phases of drug discovery and development. Mathematical models provide a useful tool to quantitatively characterize tumor growth dynamics and also optimize upcoming experiments. To the best of our knowledge, this is the first report where unperturbed growth of a large set of tumor cell lines (n = 28) has been systematically analyzed using a previously proposed model of nonlinear mixed effects (NLME). Exponential growth was identified as the governing mechanism in the majority of the cell lines, with constant rate values ranging from 0.0204 to 0.203 day−1. No common patterns could be observed across tumor types, highlighting the importance of combining information from different cell lines when evaluating drug activity. Overall, typical model parameters were precisely estimated using designs in which tumor size measurements were taken every 2 days. Moreover, reducing the number of measurements to twice per week, or even once per week for cell lines with low growth rates, showed little impact on parameter precision. However, a sample size of at least 50 mice is needed to accurately characterize parameter variability (i.e., relative S.E. values below 50%). This work illustrates the feasibility of systematically applying NLME models to characterize tumor growth in drug discovery and development, and constitutes a valuable source of data to optimize experimental designs by providing an a priori sampling window and minimizing the number of samples required.
Introduction
Drug discovery and development costs have been rising over the past years without translating into a larger number of drugs approved by the regulatory agencies (see the Pharmaceutical Research and Manufacturers of America 2016 profile; http://phrma-docs.phrma.org/sites/default/files/pdf/biopharmaceutical-industry-profile.pdf). This is especially relevant in the oncology area, where the attrition rates are among the highest (Hay et al., 2014). One approach to reducing these alarming numbers is to look for strategies to better predict clinical trial outcomes using early preclinical information (Zhang et al., 2006).
Xenograft and syngeneic models are widely used in drug development to evaluate the antitumor effects of oncological compounds and guide the selection and development of drug candidates (Sausville and Burger, 2006; Ocana et al., 2010). In these experiments, compounds exhibiting promising in vitro properties are tested on xenograft mouse experiments, typically across a small handful of different tumor cell lines. Success is then measured in terms of achieved tumor regression/cure in the treatment group compared with the control group.
Many experimental variables such as cell line aggressiveness, tumor size at dosing time, dose intensity, and dose frequency can significantly affect the evolution of tumor size over time, and consequently the outcome of these experiments in terms of observed shrinkage. Making an adequate choice of design can lead to more informative studies, with the additional benefit of reducing the number of animals, samples, or repetitions needed, and consequently reducing experimental costs, as recently illustrated by Lestini et al. (2016). However, pharmacokinetics, pharmacodynamics, and disease progression properties of the systems are rarely taken into account when designing xenograft experiments (Simeoni et al., 2013).
In this regard, semimechanistic pharmacokinetics/pharmacodynamic analysis could constitute a powerful tool to integrate information from multiple experiments, and obtain design-independent model parameters that would then enable the in silico exploration and optimization of potentially relevant scenarios. Nonlinear mixed effects (NLME) modeling represents a suitable methodology in this context to quantitatively describe not only the typical pharmacokinetics/pharmacodynamic profile but also to identify and quantify the different sources of variability (i.e., across animals and experiments), thus allowing for better data description and understanding.
To characterize tumor size data from xenograft mice experiments, a model that considers two different processes in the natural course of tumor progression (exponential and linear) (Simeoni et al., 2004) is commonly used. This model describes tumor growth dynamics in the absence or presence of anticancer treatment and enables the computation of a threshold concentration, such that if drug steady-state concentrations above that threshold are reached, the model will predict tumor shrinkage and eventually eradication. Indeed, Rocchetti et al. (2007) demonstrated a good correlation between the threshold concentration and the active dose used in clinic for several marketed drugs, thus suggesting its potential for scaling efficacy from animal to man, further supporting the use of this preclinical model. To the best of our knowledge, the NMLE methodology has been seldom used in pharmacokinetics/pharmacodynamic analyses of mice xenograft data, and when used most of the studies focused on a limited number of cell lines or tumor types only (Bueno et al., 2008; Parra-Guillen et al., 2013; Tate et al., 2014, 2016).
In this setting, the overall goal of our work was to illustrate how NLME modeling and optimal design theory can be systematically applied during the preclinical evaluation of new drug candidates to maximize the information that can be extracted from xenograft experiments and enable its subsequent use in the design of future protocols. An accurate description of the tumor dynamics in the absence of drug is a key step before characterizing tumor growth inhibition drug effects. Therefore, unperturbed tumor growth data from a large set of tumor cell lines representing several cancer types was initially selected in this work with the following goals in mind: 1) to characterize tumor growth dynamics in the absence of active treatment; 2) to evaluate the impact of study design and number of animals on the precision of parameter estimates; and 3) to assess the potential benefit of optimizing the sampling time points.
Materials and Methods
Experimental Data
Data were used from several experiments in which tumor volume (TV) measurements had been obtained from control mice. A total of 28 cell lines from 10 different tumor types were available for the analysis (see Table 1 for an overview of the experimental data). Briefly, tumor cells were subcutaneously inoculated into athymic nude mice, weighing a mean of 23 g (16–32 g). Tumor size was measured with a caliper at regular times, and TV was computed assuming the tumor has an ovoid form: (l x w2)/2 (Pierrillas et al., 2016), where l is the length and w the width of the tumor in millimeters (l > w). Mice were sacrificed when the measured TV exceeded a prespecified upper limit. All animal experiments were approved by the Eli Lilly and Company Institutional Animal Care and Use Committee.
Summary of the experimental data available for each of the tumor cell lines
The Tmax value represents the latest sampling time available in the experiment; the Tmin value represents the time at which the tumor could start to be measured.
Unperturbed Tumor Growth Modeling
The model first proposed by Simeoni et al. (2004) was used to characterize the unperturbed tumor growth dynamics in all cell lines evaluated. Briefly, the model describes an initial exponential increase in TV followed by linear growth, assuming no spontaneous tumor cell death and homogenous tumor cell behavior: (1)where TV is the tumor volume at any time after cell inoculation; and λ0 and λ1 are the zero- and first-order rate constants characterizing the exponential and linear growth kinetics, respectively. The transition from exponential to linear growth occurs when the TV reaches the value of the tumor volume threshold (TVth), which can be expressed as λ1/λ0. The shape factor (ψ) is fixed to the value of 20, ensuring a rapid transition between the two different growth rates once the TV reaches the TVth. The initial condition of the system is given by the initial tumor volume (TV0), defined as the TV immediately after tumor cell inoculation.
NLME modeling was used to analyze the data. The first-order conditional estimation method with an interaction algorithm implemented in NONMEM 7.3 (Icon Development Solutions, Ellicott City, MD) was selected. During the analysis, the typical population parameters TV0, λ0, and λ1 were estimated. Interanimal (IAV) and interstudy variability (ISV) were explored using the three estimated typical parameters assuming a lognormal distribution of the individual parameters: (2)where θi is the individual model parameter of mouse i; θpop is the population parameter (i.e., TV0, λ0, or λ1); and ηi is the associated random effect of mouse i obtained from a normal distribution with mean 0 and estimated variance of the interindividual variability (ω2).
The TV data were logarithmically transformed for the analysis, and residual variability (taking into account the discrepancy between individual predictions and observations) was described using an additive error model on the logarithmic scale: (3)where TVi,j represents the TV observations for the ith animal at the jth measurement time; f(θi, tj), corresponds to the predicted TV for mouse ith at time jth resulting from the vector of the ith individual parameters θi related as shown in eq. 1; and ε is the difference between the logarithm of the individual observed and predicted TVs. The set of ε values is independent between them and corresponds to a random variable mean 0 and estimated variance of the residual variability (σ2).
Upper welfare limits for tumor size were not available for all of the different studies, neither were the reasons for dropouts. Therefore, no censoring or dropout model was considered in the analysis.
Model Selection and Evaluation.
Different statistical models (i.e., IAV parameters, ISV parameters, and correlation between individual parameters) were explored and compared in terms of minimum value of the objective function value provided by NONMEM (approximately −2 log likelihood), precision of parameter estimates when obtained, and goodness of fit. A decrease in the objective function value of 3.84 between two nested models was considered significant at the 5% level.
Model performance was evaluated using the simulation-based diagnostics visual predictive checks generated with PsN version 4 (Lindbom et al., 2005) and the Xpose4 R package (Jonsson and Karlsson, 1999). For each cell line, 1000 studies with the same design characteristics as the original experiments were simulated. For each simulated scenario (tumor cell line) and measurement interval (or bin), the 2.5th, 50th, and 97.5th percentiles of the simulated TV values were calculated, and then the 95% confidence intervals of the aforementioned predicted percentiles were obtained and presented graphically together with the 2.5th, 50th, and 97.5th percentiles of the raw data.
Design Evaluation and Optimization
According to the Cramér-Rao inequality, the inverse of the Fisher information matrix is the lower bound of the variance/covariance matrix of any unbiased parameter estimate (Radhakrishna Rao, 1945; Cramér, 1946). Therefore, the S.E. value can be obtained from the square root of the diagonal elements of the inverse of the Fisher information matrix. The optimal design R package POPED (Foracchia et al., 2004) was used to compute parameter precision—i.e., relative standard errors (RSEs) calculated as the ratio between the S.E. values and the parameter estimates obtained for the different studied cell lines—given the selected model, the final set of parameter estimates, and an experimental design.
Parameter precision was evaluated under three distinct sampling schemas: 1) the standard schema of TV measurements taken every 2 days; 2) samples taken twice per week (i.e., two samples per week on days 1 and 4); or 3) once per week (i.e., one sample per week on day 1). For all of the evaluations, the original number of mice per study (ranging from 7 to 287) and the sampling window (see Table 1) were kept unchanged. Note that although the selected criteria commonly refer to the frequency of dose administration, in this context they are used to indicate the frequency at which TV measurements were taken. The RSEs obtained for the different model parameters across cell lines and evaluated sampling designs were analyzed.
In a second step, the sampling times were optimized assuming eight samples in all cases and allowing for only one tumor size sample per day. The study duration and the number of animals were not optimized, i.e., original designs were used. The adaptive random search methods implemented in POPED were used in the optimization step.
Results
Unperturbed Tumor Growth.
The unperturbed tumor growth model proposed by Simeoni et al. (2004) provided a good description of the data for all tumor cell lines, as illustrated in Fig. 1 for the case of lung cancer cell lines and in Supplemental Fig. 1 for the rest of tumor cell lines. Parameter estimates can be found in Table 2. The estimates of the zero-order rate constant [reflecting the linear tumor growth (λ1)] ranged from 2.58 to 464 mm3/day. With respect to λ0, taking into account the exponential growth, and TV0, the corresponding ranges were much smaller, varying from 0.0204 to 0.203 day−1 and 16 to 148 mm3, respectively. Only in the case of MB231 did the estimate for λ0 have to be fixed to a high value of 0.5 day−1, indicating that only linear growth was observed in the measurable range (TVth of 5 mm3).
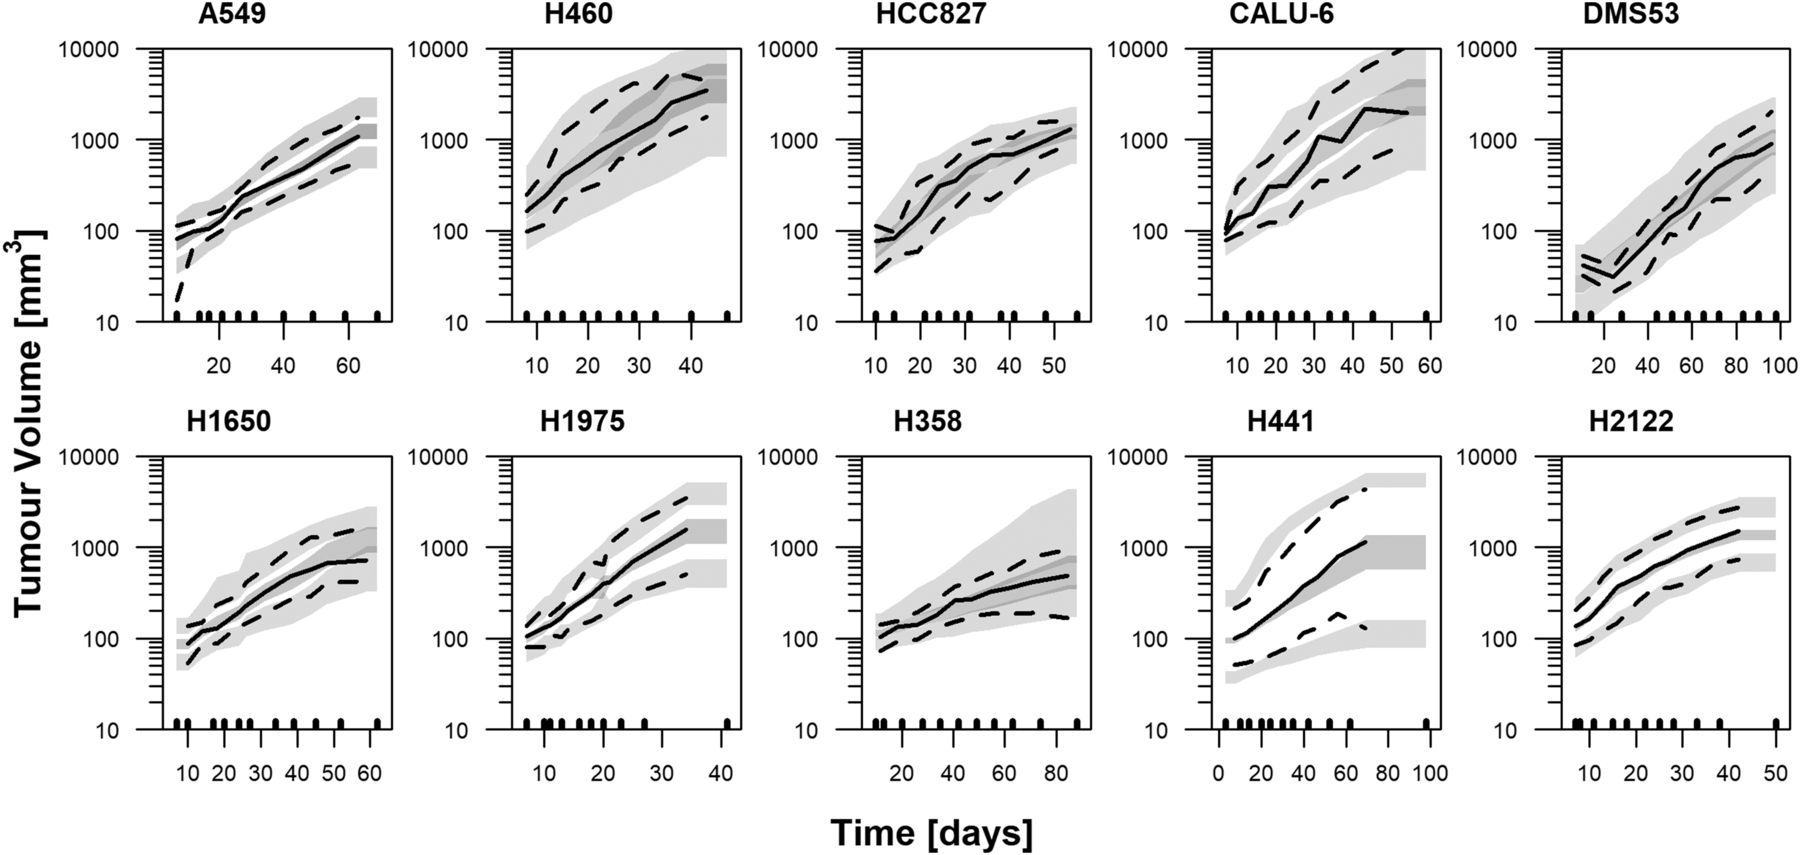
Visual predictive checks of the unperturbed tumor growth model corresponding to lung tumor cell lines. Lines represent the 2.5th (dashed), 50th (solid), and 97.5th (dashed) percentiles of raw data. Gray areas correspond to the 95% confidence interval of the 2.5th, 50th, and 97.5th percentiles computed from 1000 simulated studies. Black lower marks indicate the used binning intervals for plotting.
Model parameter estimates corresponding to all the tumor cell lines analyzed
The model parameters are defined in Materials and Methods.
IAV for the λ0 and/or TV0 parameters was identified in all tumor cell lines, with a low-to-moderate magnitude ranging from 8% to 70% and 12% to 61%, respectively. IAV in the λ1 parameter could be estimated only in 10 out of 28 cell lines, with values ranging from 42% to 88% (Fig. 2A). This is due to the fact that for most of the cell lines little information was available over TVth (marking the shift from exponential to linear growth), thus limiting the identification of IAV variability in λ1. A correlation between individual parameters was explored during the modeling process and found to be significant only for the A549 and MV411 cell lines (Table 2).

(A) Graphical representation of the parameter estimates for the different tumor cells lines categorized by the number of studies available and the associated variability magnitude. (B) Relation between the estimate of the different IAVs and the number of mice included in the analysis of each cell line.
There were no relevant relationships between the magnitude of the different variability parameters and its typical estimate or the experimental size (Fig. 2B). Inclusion of ISV did not show significance for the case of lung and melanoma cell lines, for which a large number of studies were available (P > 0.05).
Design Evaluation and Optimization.
POPED was used to evaluate the adequacy of the original experimental designs to precisely estimate all model parameters. In general, good precision (RSE below 10% in average) was obtained for the typical parameters when samples were measured every 2 days (Fig. 3A; Supplemental Table). The largest imprecision was detected in the linear growth rate (λ1) for those tumors with a large tumor threshold (TVth). On the other hand, larger RSEs were observed for the variability parameters (Fig. 3A). Precision of the IAV parameters was highly dependent on the number of experimental mice (Fig. 4), regardless of the sampling schema evaluated. For a standard experimental size of 8–10 mice, RSEs between 50% and 60% would be observed. This clear trend was not significant for typical parameters and was independent of the value of IAV precision.

(A) Box plot of the relative S.E. (RSE) values for the structural and variability model parameters (parameter definition provided in Materials and Methods) of the different cell lines assuming samples taken every 2 days (Q2D). (B) Box plot representing the predicted precision when evaluating the sampling designs twice per week (BIW), once per week (QW), or the optimized sampling schema (OPT8) with respect to the Q2D reference design. The box represents the interquartile range (IQR) and the whiskers expand up to 1.5 times the IQR range. Dots represent outliers; RUV denotes residual unexplained variability.

Relative S.E. values of the typical (upper panels) or IAV (lower panels) model parameters vs. the number of mice included in the analysis of the different cell lines. BIW, tumor size samples taken twice per week; Q2D, tumor size samples taken every two days; QW, tumor size samples taken every week.
Similarly, the influence of reducing the number of sampling time measurements on parameter precision was evaluated. The twice per week sampling schema (i.e., two samples per week) showed little impact on parameter precision, with a mean absolute loss <5% and a relative loss <25% for all parameters, except for the residual error estimate (i.e., the residual unexplained variability) (Fig. 3B, Supplemental Table 3). Further reducing to one sample per week worsened the precision of the typical parameter estimates, showing mean absolute and relative losses >10%, but also more heterogeneous results (Fig. 3B; Supplemental Table 3) highly dependent on the rate of tumor growth. This loss was less pronounced for the variability parameters, especially for λ0.
Optimizing the sampling times assuming a design of eight samples per study provided results similar to assuming a fixed twice per week schema (Fig. 3B). A wide range of sampling times, depending on the individual cell growth kinetics, was observed (Supplemental Fig. 2). However, in most of the cases clusters of sampling points around the earliest sampling time point, the tumor threshold (TVth, when relevant), and the latest possible collection sampling time were observed, as illustrated for three cell lines in Fig. 5.

TV profiles for three selected cell lines. Lines represent model predictions and dots represent the optimized sampling times.
Discussion
Although there is an on-going discussion regarding the capability of xenograft mouse models to generate meaningful data for human extrapolations, they are frequently used to evaluate the efficacy of anticancer drugs early in discovery and development. To overcome some of the limitations of these approaches, mathematical models have been proposed as a tool to derive meaningful parameters independent of the experimental settings, which can be later used to optimize upcoming experiments or guide dose rationale in humans (Simeoni et al., 2013).
In this work, tumor growth dynamics of several tumor cell lines representing different tumor types were modeled in the absence of drug using the model proposed by Simeoni et al. (2004). This model was selected as a common structure to systematically analyze our data given its flexibility and proven capability to characterize tumor growth data from different xenograft mouse experiments, as supported by its extended literature use. This work adds to previous efforts characterizing tumor growth dynamics with a common model (Wong et al., 2012; Delgado-SanMartin et al., 2015), and represents the first report where NLME modeling and optimal design techniques have been undertaken to quantitatively evaluate a large set of tumor cell lines.
The model proposed by Simeoni et al. (2004) allowed for an adequate description of the unperturbed tumor growth under the different scenarios analyzed. The obtained exponential growth rates (λ0) were in good agreement with published estimates available for some cell lines (Simeoni et al., 2004; Rocchetti et al., 2005, 2007; Haddish-Berhane et al., 2013; Terranova et al., 2013; Tate et al., 2014, 2016). It should be highlighted that in some cases data did not fully support the two mechanisms of tumor growth. In those situations, model structure could have been simplified to consider just linear or exponential growth resulting in little impact on the rest of the parameter estimates, as was done for the case of MB211. The maximum tumor burden allowed or dropout information was not available, and therefore was not included in the analysis. This could have potentially induced some parameter estimation bias, especially for λ1 (Martin et al., 2016; Pierrillas et al., 2016). However, given the large tumor size values observed in our experiments, the large number of mice available for some studies, and the lack of obvious trends or misspecifications observed for the larger tumor size predictions (Fig. 1; Supplemental Fig. 1) we believe that considering the upper welfare limit in the analysis would have had little impact.
Given the availability of several independent experiments for the same cell line, inclusion of ISV in addition to IAV was explored. ISV did not provide further explanation of parameter variability, supporting study reproducibility. Therefore, this work provides valuable information in relation to anticipating the dynamics of tumor growth in xenograft mice and supporting experimental design.
The dynamics of tumor growth in the absence of drug treatment varied widely across the 28 different cell lines. The lower growth rate values were observed for the renal tumor type. However, no additional common patterns could be detected across cell lines for the same type of tumor. Indeed, a large range of tumor growth rate values was observed for lung cancer cell lines. This variability observed across cell lines suggests that information from multiple cell lines obtained during preclinical studies should be integrated to improve extrapolation of results to clinical setting, rather than relying on single cell line experiments. Similar results have been recently illustrated by García-Cremades et al. (2016) for ovarian and pancreatic cancer. A natural extension of this work would be to collect genetic, mutation, and tumor histology information of different cell lines and perform a bioinformatic analysis to identify (if any) common patterns that could account for similarities and differences in growth rates across the different cell types. This information could be potentially used to anticipate growth dynamics of new cell types based on their genetic signature.
An essential aspect when interpreting modeling results is the reliability of the obtained parameter estimates, i.e., large parameter imprecision translates into high uncertainty in model predictions and therefore limited extrapolation capability. In this regard, the experimental design plays an essential role in parameter estimates (al-Banna et al., 1990). Measuring tumor size twice per week allowed for a precise estimation of typical model parameters in all evaluated cell lines, with small precision loss compared with measuring every 2 days. However, further reducing the sampling schema to once per week showed a less consistent impact on precision loss with lower impact on parameter precision in slow growing tumors compared with fast growing tumors. The results from this evaluation design exercise showed that the underlying properties of the cell line can be used to guide experimental design, in terms of sampling intensity and/or size of the experiment.
Among the unperturbed growth model parameters, special attention should be paid to λ0, since this parameter is potentially used to predict the target human exposure of a candidate drug (Rocchetti et al., 2007). Except for MIA PaCa-2 cell line, where linear rather than exponential growth was the predominant mechanism, the RSE of λ0 was always below 20%, regardless of the experimental setting (e.g., number of mice and parameter value) and sampling schema. These observations illustrate the adequacy of the NLME approach to precisely characterize and rank the typical exponential growth rate of the different cell lines. Another important aspect to consider, due to its impact on the confidence interval around the predicted tumor size profiles, is the precision of the estimated variability. The accuracy of the IAV parameters was largely driven by the number of mice rather than the sampling schema or the IAV magnitude, with approximately 50 animals required for RSE <50%. The NLME model represents a suitable approach to achieve such large sample size, since it enables the integration of data from multiple experiments and even control and treatment groups. In addition, the parameters reported in this study could be used as prior information to further reduce the size of control groups.
One step further in the application of optimal design theory is the optimization of the selected sampling times, i.e., identifying those times that, given a model structure and some design constrains, provide the maximum possible information for the estimation of the different model parameters. Optimal design strategies applied to xenograft data have been recently proposed by Lestini et al. (2016). Their results showed how optimal sampling schemas can improve the information obtained from experimental data and highlight the importance of early and late sampling for adequate parameter characterization. Comparable results were obtained in our analysis of control groups, identifying clusters of points at early sampling times (informed about TV0), late sampling times (informed about the linear growth), or TVth (exponential and linear growths) (Fig. 5; Supplemental Fig. 2). Similarities or differences between optimal times across cell types are therefore explained by the similarities or differences in their growth behavior. Nonetheless, evaluation of experimental designs that can be systematically applied under different conditions might be of more relevance than optimizing the sampling times for each of the cell lines, especially given the low cost and time consumption for obtaining tumor size measurements, and the convenience of standard designs in terms of experimental organization.
In conclusion, a common structure based on the model proposed by Simeoni et al. (2004) characterized well the typical and dispersion tendencies of the longitudinal TV data obtained from a wide range of tumor cell lines providing a robust and general platform: 1) to quantify and compare tumor growth, and possibly 2) to design future treatment experiments based on information from treated groups, in vitro data regarding drug potency, and drug pharmacokinetics. Experimental designs measuring tumor size twice weekly, or even once a week for slow growing tumors, are sufficient for accurate characterization of the tumor growth dynamics. However, analyses of pooled experiments to increase the number of mice are required for adequate quantification of variability. The approach presented here can be easily extrapolated also to drug studies, where modeling and simulation together with design optimization is anticipated to have a more relevant role given the greater experimental study alternatives, e.g., dose level, dose intensity, or group size.
Acknowledgments
We thank Andrew Hooker, France Mentré, and Giulia Lestini for the support received in the use of optimal design theory.
Authorship Contributions
Participated in research design: Parra-Guillen, Mangas-Sanjuan, Garcia-Cremades, Troconiz, Mo, Pitou, Iversen, Wallin.
Conducted experiments: Parra-Guillen, Mangas-Sanjuan, Garcia-Cremades, Troconiz, Mo, Pitou, Iversen, Wallin.
Performed data analysis: Parra-Guillen, Mangas-Sanjuan, Garcia-Cremades, Troconiz, Mo, Pitou, Iversen, Wallin.
Wrote or contributed to the writing of the manuscript: Parra-Guillen, Mangas-Sanjuan, Garcia-Cremades, Troconiz, Mo, Pitou, Iversen, Wallin.
Footnotes
- Received February 13, 2018.
- Accepted April 16, 2018.
↵1 Z.P.P.-G. and V.M.-S. contributed equally to this work.
↵2 Current affiliation: Department of Pharmacy and Pharmaceutical Technology and Parasitology, University of Valencia, Valencia, Spain; and Molecular Recognition and Technological Development, Polytechnic University–University of Valencia, Valencia, Spain.
↵3 Current affiliation: Department of Bioengineering and Therapeutic Sciences, University of California, San Francisco, San Francisco, California.
At the time the research was performed, Z.P.P.-G., V.M.-S., M.G.-C., and I.F.T. received research funding from Eli Lilly and Company.
↵
 This article has supplemental material available at jpet.aspetjournals.org.

Abbreviations
- IAV
- interanimal variability
- ISV
- interstudy variability
- NLME
- nonlinear mixed effects
- RSE
- relative standard error
- TV
- tumor volume
- TV0
- initial tumor volume
- TVth
- tumor volume threshold
- Copyright © 2018 by The American Society for Pharmacology and Experimental Therapeutics


