


Abstract
The contribution of gene expression changes to the adverse and therapeutic effects of β2-adrenoceptor agonists in asthma was investigated using human airway epithelial cells as a therapeutically relevant target. Operational model-fitting established that the long-acting β2-adrenoceptor agonists (LABA) indacaterol, salmeterol, formoterol, and picumeterol were full agonists on BEAS-2B cells transfected with a cAMP-response element reporter but differed in efficacy (indacaterol ≥ formoterol > salmeterol ≥ picumeterol). The transcriptomic signature of indacaterol in BEAS-2B cells identified 180, 368, 252, and 10 genes that were differentially expressed (>1.5- to <0.67-fold) after 1-, 2-, 6-, and 18-hour of exposure, respectively. Many upregulated genes (e.g., AREG, BDNF, CCL20, CXCL2, EDN1, IL6, IL15, IL20) encode proteins with proinflammatory activity and are annotated by several, enriched gene ontology (GO) terms, including cellular response to interleukin-1, cytokine activity, and positive regulation of neutrophil chemotaxis. The general enriched GO term extracellular space was also associated with indacaterol-induced genes, and many of those, including CRISPLD2, DMBT1, GAS1, and SOCS3, have putative anti-inflammatory, antibacterial, and/or antiviral activity. Numerous indacaterol-regulated genes were also induced or repressed in BEAS-2B cells and human primary bronchial epithelial cells by the low efficacy LABA salmeterol, indicating that this genomic effect was neither unique to indacaterol nor restricted to the BEAS-2B airway epithelial cell line. Collectively, these data suggest that the consequences of inhaling a β2-adrenoceptor agonist may be complex and involve widespread changes in gene expression. We propose that this genomic effect represents a generally unappreciated mechanism that may contribute to the adverse and therapeutic actions of β2-adrenoceptor agonists in asthma.
Introduction
Inhaled β2-adrenoceptor agonists are a mainstay asthma therapy, providing symptomatic relief by effecting rapid and prolonged airway smooth muscle (ASM) relaxation. Until recently, the cAMP-dependent phosphorylation of substrates that directly inhibit myosin from generating force on actin filaments was believed to explain the improvement in lung function (Giembycz and Raeburn, 1991). However, recent evidence suggests that β2-adrenoceptor agonists can maintain airway caliber by genomic mechanisms. Studies by Holden et al. (2011) revealed that in ASM, long-acting β2-adrenoceptor agonists (LABAs) induced the gene encoding regulator of G protein signaling 2 (RGS2). RGS2 is a GTPase-activating protein that terminates signaling mediated by G protein-coupled receptors (GPCRs) that act through Gq (Heximer, 2004). As many spasmogens (e.g., acetylcholine, histamine, and leukotrienes) act in this way, the expression of RGS2 in ASM may represent a novel mechanism that protects against bronchoconstriction and improves lung function in asthma (Holden et al., 2011). It follows, therefore, that β2-adrenoceptor agonists may upregulate other genes in the lungs that can also impart therapeutic benefit (Moodley et al., 2013; Giembycz and Newton, 2015).
Although β2-adrenoceptor agonists are unquestionably beneficial in asthma, chronic use as a monotherapy is often associated with a loss of disease control and an increased risk of asthma-related mortality (Pearce et al., 1991; Cockcroft and Sears, 2013). This problem first arose in England and Wales in the 1960s (Speizer et al., 1968a) and recurred in New Zealand a decade later (Jackson et al., 1982). Epidemiologic studies indicate that the rise in asthma mortality correlates with the increased use of high-dose, nonselective compounds, such as isoprenaline (Speizer et al., 1968b; Stolley, 1972; Stolley and Schinnar, 1978), and short-acting β2-adrenoceptor agonists (SABAs), such as fenoterol (Crane et al., 1989). At the time, β1-adrenoceptor-mediated cardiotoxicity was thought to be a causal factor (Speizer et al., 1968b). The finding that isoprenaline and fenoterol have high intrinsic activity at cardiac β1-adrenoceptors (Wilson and Lincoln, 1984; Steinfath et al., 1992) that could be activated secondarily to systemic exposure is consistent with that interpretation. Weak selectivity of fenoterol for the β2-adrenoceptor over the β1-subtype (Baker et al., 2015) also supports that idea. However, the discovery that the highly selective LABA salmeterol (Baker et al., 2015) is also associated with a loss of asthma control and an increase in mortality in a subset of patients with asthma (Nelson et al., 2006) casts doubt on cardiovascular toxicity being the major cause. Instead, it seems probable that overuse of β2-adrenoceptor agonists, as a class, masks an underlying inflammation (McIvor et al., 1998) that leads to an increase in disease severity and associated adverse events (Pearce et al., 1991; Cockcroft and Sears, 2013). Accordingly, the Global Initiative for Asthma (GINA) treatment guidelines advocate that SABAs should be used on an as-needed basis for symptoms relief (www.ginasthma.org). GINA also recommends that a LABA should always be administered concurrently with an inhaled corticosteroid (ICS), which has been shown to protect against salmeterol-induced toxicity (Cates et al., 2014). This latter finding is informative because ICSs suppress the immune system, implying that the etiology of SABA- and LABA-induced adverse effects has an inflammatory basis.
Collectively, these data suggest that the consequences of inhaling a β2-adrenoceptor agonist are more complex than originally thought and may involve widespread changes in gene expression. Establishing a genomic effect has additional clinical implications, because it implies that the pulmonary actions of these drugs in asthma are not restricted to ASM. Indeed, many structural elements within the lungs, such as the airway epithelium, express a high density of β2-adrenoceptors that are efficiently coupled to adenylyl cyclase (Penn et al., 1994) and could represent a therapeutically relevant target.
In this study, we assessed whether gene expression changes in human bronchial epithelial cells could contribute to the adverse effects of β2-adrenoceptor agonists in asthma. The prospect that differentially expressed genes (DEGs) could impart therapeutic benefit was also explored. To address these possibilities, the pharmacodynamics of four β2-adrenoceptor agonists (indacaterol, salmeterol, formoterol, and picumeterol) that define the activation of a cAMP-response element (CRE) luciferase reporter transfected into the BEAS-2B human airway epithelial cell line were compared using operational model-fitting (Black and Leff, 1983). The transcriptomic signature of the LABA indacaterol was also determined in BEAS-2B cells by microarray and analyzed bioinformatically, with key gene expression changes being confirmed in human primary bronchial epithelial cells (HBECs).
Materials and Methods
Generation of a Stable CRE Luciferase Reporter in BEAS-2B Cells.
Cells were transfected with 8 μg of plasmid DNA (pADneo2-C6-BGL) using Lipofectamine 2000 (Invitrogen/Thermo Fisher Scientific, Burlington, ON, Canada) to generate 6×CRE BEAS-2B cells as described previously (Meja et al., 2004).
Submersion Culture of BEAS-2B Cells.
Native and 6×CRE BEAS-2B reporter cells were cultured for 3 days under a 5% CO2/air atmosphere at 37°C in 24-well plastic plates (Corning Life Sciences, Lowell, MA) in keratinocyte-containing, serum-free medium (SFM) supplemented with epidermal growth factor (5 ng/ml), bovine pituitary extract (50 μg/ml), penicillin (100 mg/ml), and streptomycin (100 IU/ml), and for a further 24 hours in SFM (Greer et al., 2013). At this time, cultures were confluent and were used to assess reporter activation and gene expression.
Infection of BEAS-2B Cells with an Adenovirus Encoding an Endogenous Inhibitor of cAMP-Dependent Protein Kinase.
Subconfluent (∼70%), BEAS-2B cells were infected [multiplicity of infection (MOI) = 25] with a replication-deficient adenovirus vector (Ad5.CMV.PKIα) containing a 251-bp DNA fragment encoding the complete amino acid sequence of the α-isoform of cAMP-dependent protein kinase (PKA) inhibitor (PKIα) positioned downstream of the constitutively active cytomegalovirus (CMV) immediate early promoter (Meja et al., 2004). The same vector encoding green fluorescent protein (GFP) was used as a control. After 48 hours, cells were exposed to salmeterol (100 nM; 2 hours) and processed for gene expression by real-time polymerase chain reaction (PCR) (vide infra).
Treatment of BEAS-2B Cells.
Native and 6×CRE BEAS-2B reporter cells were treated with the β2-adrenoceptor agonists of interest. Reporter cells were lysed at 6 hours in 1× firefly luciferase lysis buffer (Biotium, Hayward, CA), and luciferase activity was measured by luminometry. Data are expressed as fold increase in luciferase activity using time-matched activity values in vehicle-treated cells as the denominator. RNA was extracted from native cells and subjected to real-time PCR (vide infra).
Submersion Culture of Primary Cells.
HBECs were prepared by proteinase digestion of nontransplanted, normal airways harvested from five healthy, nonasthmatic donors obtained from the International Institute for the Advancement of Medicine (Edison, NJ; see Supplemental Table 1 for demographics). Cells were seeded in 12-well plates (Corning) containing bronchial epithelial cell growth medium (Lonza, Walkersville, MD) supplemented with penicillin (50 μg/ml) and streptomycin (10 μg/ml), and maintained under a 5% CO2/air atmosphere at 37°C until ∼80% confluent (∼14 days; medium changed every 2–3 days). HBECs were cultured for a further 24 hours in supplement-free, basal medium (Lonza) and processed for real-time PCR (vide infra). Ethics approval for the use of human tissues has been granted by the Conjoint Health Research Ethics Board of the University of Calgary.
Microarray and Data Processing.
BEAS-2B cells in keratinocyte-containing SFM without supplements were cultured for 1, 2, 6, and 18 hours with indacaterol (10 nM) or vehicle (N = 4 at each time-point). Total RNA was extracted (vide infra), quantified (NanoDrop 2000; Thermo Fisher Scientific), and the quality of each sample was assessed using the Agilent 2100 Laboratory-on-a-Chip System (Santa Clara, CA) before being processed for gene profiling (Expression Analysis Inc., Durham, NC). Each RNA sample was converted into a biotinylated cRNA target using a 3′-IVT Expression Kit (Affymetrix/Thermo Fisher Scientific) and hybridized to an Affymetrix GeneChip Human Genome U133 Plus 2.0 Array, which provides an analysis of ∼47,400 transcripts from 54,613 probe sets. Chips were stained, washed, and the fluorescence intensity was measured. The microarray images were normalized using the probe logarithmic intensity error (PLIER) algorithm and stored as .chp files. Signals from the four replicates for each probe set were averaged and the relative expression patterning was implemented in Transcriptome Analysis Console (TAC v4.0; Affymetrix). Data were analyzed at each time-point and visualized by generating volcano plots and heat maps. The P statistic was adjusted using the Benjamini and Hochberg false discovery rate (FDR), with step-up, procedure, and significance was set at a value of <0.1. These microarray data have been uploaded to NCBI’s Gene Expression Omnibus and are available through accession code GSE106710. Unless indicated otherwise, genes, mRNAs, and proteins are referred to by the official gene symbol supplied by The National Center for Biotechnology Information (www.ncbi.nlm.nih.gov/). Functional classification of indacaterol-regulated genes (by probe set) including associated gene ontology (GO) terms was performed with the database for visualization and integrated discovery (DAVID) bioinformatics resources (v6.8) at medium stringency (default settings). For all analyses an enrichment score cut-off value of >1.3 was applied. This is a relative probability that represents the geometric mean of all enrichment P values of each annotation term in a given cluster. It is presented on a linear scale where a value of 1.3 is equal to the −log10 of 0.05 (Huang et al., 2009). Pseudogenes, hypothetical genes, noncoding RNAs and uncharacterized sequences lacking annotation were excluded. Results are reported using enriched GO terms that describe biologic process (GOTERM_BP_DIRECT). When this descriptor was absent from a given gene cluster, molecular function (GOTERM_MF_DIRECT), cellular component (GOTERM_CC_DIRECT), UniProt Sequence Feature, InterPro, and/or Kyoto Encyclopedia of Genes and Genomes (KEGG) pathway were used.
RNA Isolation, Reverse Transcription, and Real-Time PCR.
Total RNA was extracted from epithelial cells (RNeasy Mini Kit; Qiagen, Mississauga, ON, Canada) and reverse-transcribed using a qScript cDNA synthesis kit according to the manufacturer’s instructions (Quanta Biosciences, Gaithersburg, MD). Real-time PCR analysis of cDNA was performed using the primers shown in Supplemental Table 2. Reactions (10 μl) were performed using an ABI StepOnePlus instrument (Applied Biosystems/Thermo Fisher Scientific, Foster City, CA) on 2.5 μl of cDNA using Fast SYBR Green chemistry (Invitrogen/Thermo Fisher Scientific), according to the manufacturer’s guidelines. Gene expression levels were determined from a cDNA standard curve (analyzed simultaneously with test samples) and are presented as a ratio to GAPDH. Amplification conditions were as follows: 95°C, 20 seconds; followed by 40 cycles of 95°C, 3 seconds, and 60°C, 30 seconds. Dissociation curves (95°C, 15 seconds; 60°C, 1 minute; 95°C, 15 seconds) were constructed to confirm primer specificity.
Curve-Fitting.
Monophasic E/[A] curves were fit by least-squares, nonlinear, iterative regression to the following form of the Hill equation (eq. 1; Prism 6; GraphPad Software Inc., La Jolla, CA): (1)where E is the effect, Emin and Emax are the basal response and maximum response, respectively, p[A] is the negative log molar concentration of the β2-adrenoceptor agonist of interest, p[A]50 is a location parameter equal to the negative log molar concentration of agonist producing (Emax − Emin)/2 and n is the gradient of the E/[A] curve at the p[A]50 level.
Determination of Agonist Equilibrium Dissociation Constants.
Agonist affinities were estimated by fractional, irreversible, β2-adrenoceptor inactivation. E/[A] curves were generated in cells that had been pretreated (60 minutes) with vehicle or the alkylating agent DCITC (100 nM; Deyrup et al., 1998), and washed in SFM. Each pair of E/[A] curves was fit simultaneously to the operational model of agonism (eq. 2), which describes a theoretical relationship between pharmacological effect (E) and agonist concentration (Black and Leff, 1983). Algebraically, (2)where Em is the theoretical maximum response of the tissue, KA is the agonist equilibrium dissociation constant, n is the slope of the relationship between the concentration of agonist-receptor complexes and response, and τ is the operational efficacy of the agonist, which is the reciprocal of the percentage of agonist-bound receptors required to give half maximal response. In these analyses, only τ was allowed to vary between individual E/[A] curves; for all other parameters (i.e., Em, KA and n) a common value was assumed (Black and Leff, 1983; Leff et al., 1990).
Determination of Receptor Reserve.
Receptor occupancy-response curves were constructed using KA values determined by β2-adrenoceptor depletion. At each concentration of agonist, fractional receptor occupancy was determined, assuming the binding of ligand to the β2-adrenoceptor was a noncooperative process according to eq. 3, where RA and Rt represent the number of agonist-occupied receptors and total number of receptors, respectively.
 (3)
(3)Drugs and Analytical Reagents.
β2A (8-hydroxy-5-((R)-1-hydroxy-2-methylamino-ethyl)-1H-quinolin-2-one) and indacaterol were synthesized by Gilead Sciences (Seattle, WA). Salmeterol was from GlaxoSmithKline (Stevenage, UK), and formoterol and picumeterol were provided by AstraZeneca (Mölndal, Sweden). DCITC (5(2-(((1′-(4′-isothiocyanatephenylamino)thiocarbonyl) amino)-2-methylpropyl)amino-2-hydroxypropoxy)-3,4-dihydrocarbostyril) was a generous gift from Dr. Stephen Baker (University of Florida, Gainesville, FL). All drugs were dissolved in dimethyl sulfoxide (DMSO) and diluted to the required working concentrations in SFM. The highest concentration of DMSO used in these experiments (0.2% v/v) did not affect any output measured.
Statistics.
Data points, bars, and values in the text and figure legends represent the mean ± S.E.M. of N independent determinations. CRE reporter and gene expression data were analyzed by Student’s two-tailed t test or repeated measures, one-way analysis of variance (ANOVA) as indicated. If the ANOVA F-test P value was <0.05, differences between treatment groups were analyzed by Tukey’s multiple comparison test. Rank order correlations were performed using the method of Pearson. The null hypothesis was rejected when P < 0.05.
Results
Effect of LABAs on CRE-Dependent Reporter Activation.
On 6×CRE BEAS-2B reporter cells, indacaterol, formoterol, salmeterol, and picumeterol increased luciferase activity in a concentration-dependent manner. Relative to the reference compound, β2A, which is a well-recognized pharmacophore that confers β2-adrenoceptor agonism (Yoshizaki et al., 1976), all LABAs were full agonists (intrinsic activity [α] values of ∼1) with the following rank order of potency: formoterol > picumeterol > salmeterol > indacaterol (Fig. 1; Table 1).

Effect of LABAs on reporter activation in 6×CRE BEAS-2B cells. E/[A] curves were constructed to formoterol, indacaterol, salmeterol, and picumeterol, from which p[A]50 and intrinsic activity values were derived using β2A as a reference agonist. The horizontal dashed line represents baseline luciferase activity. Data points represent the mean ± S.E.M. of seven or eight independent observations as indicated in Table 1.
Effect of LABAs on CRE-dependent reporter activation in BEAS-2B cells
Parameters were derived from the data in Fig. 1. β2A was used as a reference agonist and assigned a value of 1.
Pharmacodynamics of β2-Adrenoceptor-Mediated, CRE-Dependent Reporter Activation.
Operational model-fitting of E/[A] curve data before and after treatment of 6×CRE BEAS-2B reporter cells with the alkylating agent DCITC determined that the KA values of the four LABAs differed by a factor of 182-fold, with picumeterol and indacaterol having the highest and lowest affinity for β2-adrenoceptor-mediated reporter activation, respectively (Fig. 2, A–D; Table 2). Operational efficacy values also varied; formoterol and indacaterol had ∼10-fold higher efficacy (τ ∼45) than did salmeterol and picumeterol (Table 2). The affinity and operational efficacy of β2A were similar to that of indacaterol (Fig. 2E; Table 2).

Application of fractional, irreversible, β2-adrenoceptor inactivation to estimate pharmacodynamic parameters that define LABA-induced CRE reporter activation. 6×CRE BEAS-2B reporter cells were treated with DCITC (100 nM) or vehicle for 60 minutes, washed in DCITC-free medium, and exposed to formoterol (A), indacaterol (B), salmeterol (C), picumeterol (D), and β2A (E). At 6 hours cells were lysed and luciferase activity was determined, from which E/[A] curves were constructed. The resulting pairs of curves were analyzed by operational model-fitting, from which estimates of KA, τ, n, Em, and p[A]50 (of the control curve) were derived (Table 2). The horizontal dashed lines in panels A to E represent baseline luciferase activity. In (F), the KA values of each agonist were used to calculate the relationship between fractional β2-adrenoceptor occupancy and reporter activation. The diagonal dashed line is the line of identity, at which luciferase activity is a linear function of receptor occupancy. Data represent the mean ± S.E.M. of N independent determinations.
Pharmacodynamic parameters that define β2-adrenoceptor-mediated, CRE-dependent reporter activation in BEAS-2B cells
Agonist E/[A] curves were constructed for cells treated with or without DCITC (100 nM; 60 min) and analyzed simultaneously by operational model-fitting. p[A]50 and p[A′]50 refer to the concentration of agonist that produced half maximum response in the absence and presence of DCITC, respectively. Parameters were derived from the data in Fig. 2.
Using the KA value of each LABA, the relationship between β2-adrenoceptor occupancy and reporter gene activation was determined to be curvilinear and deviated significantly from the line of identity (at which response is a linear function of occupancy; Fig. 2F). Although the proportion of “spare” receptors declined incrementally with increasing agonist concentration, a receptor reserve was evident at most levels of response. Thus, for formoterol and indacaterol, a large β2-adrenoceptor reserve existed for mediating CRE-dependent reporter activation, which is consistent with the high KA/[A]50 ratios (Table 2). The occupancy-response relationships of salmeterol and picumeterol were also similar, but the receptor reserves at all levels of reporter activation were considerably lower. Thus, formoterol and indacaterol required approximately 0.7%, 2.6%, and 11% β2-adrenoceptor occupancy to produce 20%, 50%, and 80% of the maximal response, respectively. In contrast, considerably greater receptor occupancy (10%, 30%, and 65%, respectively) was necessary for salmeterol and picumeterol to produce equivalent levels of reporter activation (Fig. 2F).
Effect of Indacaterol on Global Gene Expression.
Microarray-based expression profiling was used to identify DEGs in BEAS-2B cells that may contribute to the adverse and therapeutic effects of β2-adrenoceptor agonists. The LABA, indacaterol (10 nM), was selected for this purpose because it had high operational efficacy in 6×CRE BEAS-2B reporter cells (Table 2), which should have maximized the number of significant gene expression changes detected using this platform.
Immediate and/or delayed targets of cAMP signaling could contribute to the activity of β2-adrenoceptor agonists. Accordingly, DEGs were identified at 1, 2, 6, and 18 hours after exposure to indacaterol. Of the ∼47,400 probe sets that are present on each gene chip, 458, 881, 1408, and 13 had expression-level changes that were statistically different (FDR P < 0.1) from time-matched, vehicle-treated cells at 1, 2, 6, and 18 hours, respectively. The kinetics of global gene expression changes are shown in Fig. 3 at two thresholds (>1.5-fold induction or <0.67 repression and >3-fold induction or <0.33-fold repression). In BEAS-2B cells exposed to indacaterol for 1 hour, 180 DEGs were identified that were either upregulated (134) or downregulated (46) by a factor of >1.5-fold and <0.67, respectively (Fig. 3). After 2 hours of exposure, the number of DEGs at these same thresholds had increased to 368 (321 induced and 47 repressed), which had declined to a value of 252 (205 induced and 47 repressed) by 6 hours (Fig. 3). At 18 hours, nine genes were upregulated and one gene was downregulated by indacaterol (Fig. 3). Similar kinetics of gene induction were found if no threshold (data not shown) and >3-fold/<0.33-fold thresholds were set for significant gene expression changes, but the number of DEGs was markedly higher and lower, respectively (Fig. 3). Figure 4 shows the expression level of all probe sets as volcano plots at 1, 2, 6 and 18 hours after indacaterol, where red and blue circles indicate >1.5-fold induction and <0.67-fold repression, respectively.
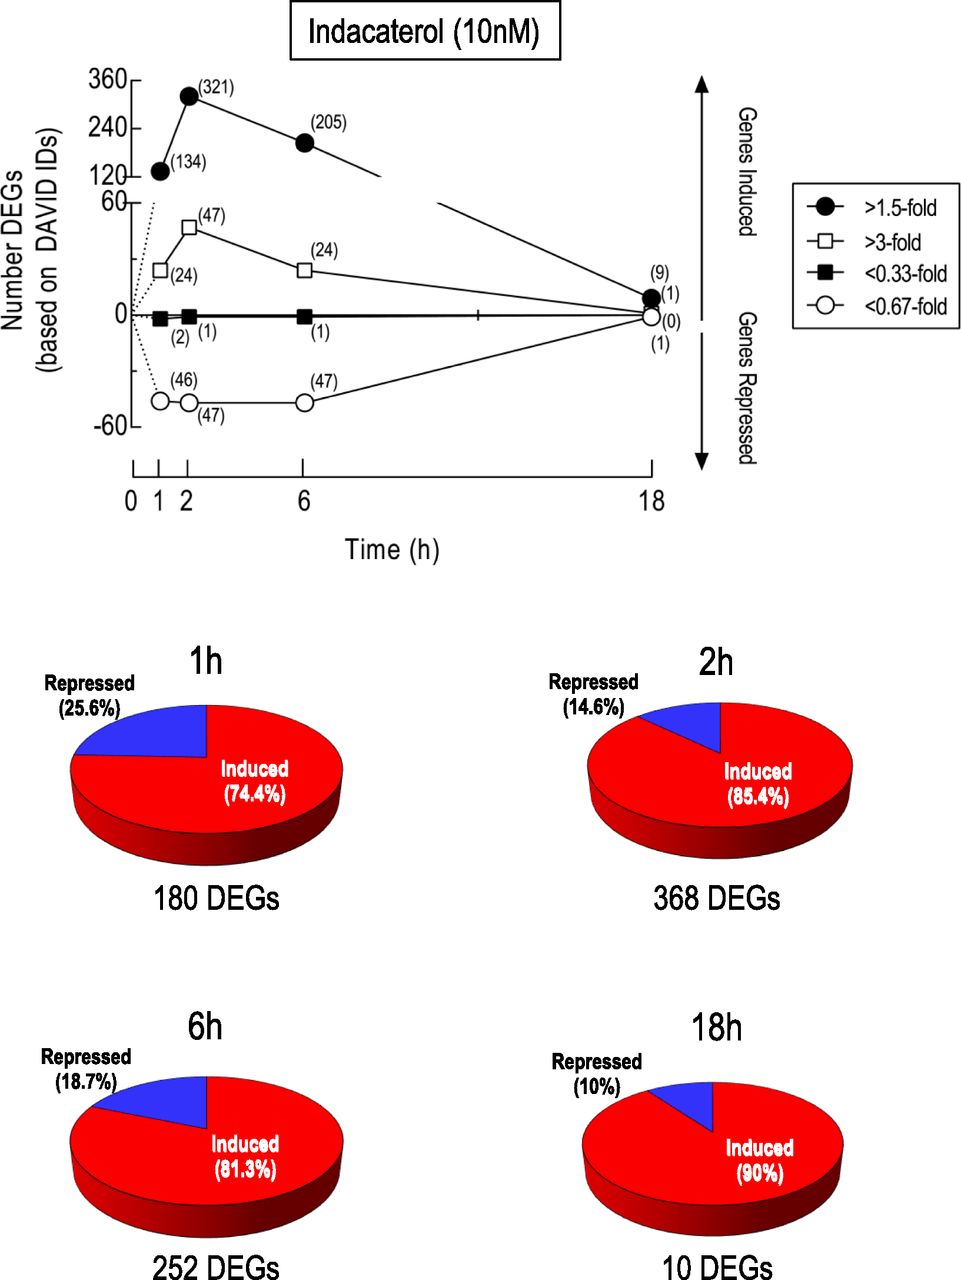
Kinetics of indacaterol-induced gene expression changes. RNA was prepared from BEAS-2B cells treated for 1, 2, 6, and 18 hours with indacaterol (10 nM) or vehicle and subjected to gene expression profiling by microarray. Probe sets meeting the expression criteria (>1.5-fold, >3-fold, <0.67-fold, <0.33-fold) were analyzed using freely available software to identify DEGs that were significantly (FDR P value <0.1) induced or repressed relative to time-matched, vehicle-treated cells. These are based on Entrez Gene and DAVID IDs and the number is shown in parentheses at each time-point. The pie charts represent the proportion of DEGs at each time-point that were induced (red) or repressed (blue). One gene, USP2 (probe set 229337_at), was apparently up- and downregulated by indacaterol, depending on the time of exposure. Note, this work forms part of a larger investigation that examined the effects of indacaterol and a phosphodiesterase 4 inhibitor, GSK 256066, alone and in combination, on gene expression in human airway epithelial cells (see GSE106710). Accordingly, statistical analysis of data sets from all treatment groups was performed concurrently at each time-point.

Preliminary ontological characterization of indacaterol-induced gene expression changes. The relative expression patterning of probe sets at 1, 2, 6, and 18 hours was visualized by generating volcano plots (A–D, respectively). Each probe set is represented by a circle colored gray (transcript changes from >0.67-fold to <1.5-fold), red or blue (corresponding to transcripts that are induced or repressed by >1.5-fold and <0.67-fold, respectively). Yellow circles represent DEGs that were validated by real-time PCR (Fig. 7). The vertical dashed line in each panel indicates baseline gene expression. NCBI Gene, GO, and Gene Cards were used to manually assign each gene to one of six broad groups: 1) transcriptional regulators (red), 2) transporters, ion channels and membrane receptors (orange), 3) metabolic proteins (yellow), 4) general cell signaling components, including translational regulators (green), 5) other functions (blue), and 6) not assigned (purple). These are represented as pie charts shown to the right (induced) and left (repressed) of each volcano plot, respectively.
Preliminary GO analyses at each time-point was performed using six generic descriptors: 1) transcriptional regulators (red), 2) transporters, ion channels, and membrane receptors (orange), 3) metabolic proteins (yellow), 4) general signaling molecules, including translational regulators (green), 5) other functions (blue), and 6) not assigned (purple). The number of genes within each of these terms expressed as a percentage of the total number of significant gene expression changes at each time-point is presented as a pie chart on the left side (repressed genes) and right side (induced genes) of each volcano plot shown in Fig. 4.
Transcriptional regulators represented ∼26% of all induced genes in BEAS-2B cells exposed to indacaterol for 1 and 2 hours, which had declined to 7% and 0% of the total number of genes at the 6- and 18-hour time-points, respectively. The number of genes encoding signaling molecules (11%–18.5%), metabolic proteins (24%–35%), and transporters, ion channels, and membrane receptors (12%–17%) followed similar, but less extreme, induction kinetics (Fig. 5; Supplemental Fig. 1A).

Indacaterol-induced genes in BEAS-2B cells. Probes sets meeting the expression criteria (>1.5-fold induction; FDR P value <0.1) were analyzed using Entrez Gene and the gene identification tool in DAVID to produce 134, 321, 205, and 9 upregulated genes at 1, 2, 6, and 18 hours, respectively. Induced genes that were subjected to independent PCR validation (Fig. 7) are in boldface and underlined. GO, NCBI Gene, and Gene Cards were used to manually assign each induced gene to one of six broad descriptors: 1) Transcriptional regulators, 2) Transporters, ion channels and membrane receptors, 3) Metabolic proteins, 4) General signaling molecules including translational regulators, 5) Other functions, and 6) Not assigned. Note: The following genes were detected with promiscuous probe sets (unannotated genes are not listed in the table): SIK1, LOC102724428 (208078_s_at, 232470_at), CHRNA7, LOC101929970, SLC24A2 (236385_at), AKIP1, NUAK2 (220987_s_at), SLC2A14, SLC2A3 (216236_s_at, 222088_s_at), HRK, LOC283454 (229552_at), ITGB6, LOC100505984 (208083_s_at), FAM87A, FAM87B (1559141_s_at, 1559140_at), CSNK1E, LOC400927-CSNK1E (222015_at, 226858_at), CREB5, LOC401317 (242329_at), RUNX1, LOC100506403 (210805_x_at) and UGT1A8, UGT1A9 (221305_s_at).
Genes encoding transcriptional regulators, signaling molecules and proteins “not assigned” were rapidly, albeit, transiently repressed at 1 and 2 hours in cells treated with indacaterol. The expression of genes in the other three groups followed similar, but slower, kinetics with maximum repression occurring at 6 hours before returning to pre-stimulation levels at 18 hours (Fig. 6; Supplemental Fig. 1B).

Indacaterol-repressed genes in BEAS-2B cells. Probes sets meeting the expression criteria (<0.67-fold repression; FDR P value <0.1) were analyzed using the gene identification tool in DAVID to produce 46, 47, 47, and 1 downregulated genes at 1, 2, 6, and 18 hours, respectively. Repressed genes that were subjected to independent PCR validation (Fig. 7) are in boldface and underlined. GO, NCBI Gene, and Gene Cards were used to manually assign each repressed gene to one of the six broad terms described in Fig. 5. Note: The following genes were detected with promiscuous probe sets (pseudogenes and unannotated genes are not listed in the table): NBPF1, NBPF8, NBPF9, NBPF10, NBPF11, NBPF12, NBPF14, NBPF19, NBPF26, LOC100996763, LOC102724250 (1569519_at), KCTD14, NDUFC2-KCTD14 (219545_at), NPIPB4, NPIPB5, SMG1, SMG1P1, SMG1P2, SMG1P3, SMG1P5, SMG1P7, LOC101060596, LOC105369244, LOC105369278 (244766_at) and TPSAB1, TPSB2 (207134_x_at).
All DEGs are listed in Supplemental Tables 3 and 4 and are assigned a color (right side column) that corresponds to one of the six generic GO terms listed above.
Validation of Gene Expression Changes.
Supplemental Figs. 2 and 3 compare, as heat maps, the expression pattern of indacaterol-regulated genes by probe set ranked highest to lowest at 1, 2, and 6 hours. Thirteen induced genes and two repressed genes were selected from the microarray and validated by real-time PCR using the same RNA (Fig. 7). These are underlined in each heat map and their expression level changes are given in each cell in log2 format (Supplemental Figs. 2 and 3). PCR-validated probe sets that had changed by >1.5- or <0.67-fold are also shown as yellow circles on each volcano plot in Fig. 4. For most genes, changes in expression measured by PCR were of greater magnitude than those determined by the microarray (Fig. 7) and this was confirmed by the finding that the slope of the line of regression (1.15) deviated significantly from unity (Fig. 8A). Nevertheless, a significant rank order correlation was found between the two formats after 2 hours of treatment using the probe set that produced the greatest change in expression per gene (Fig. 8A).

Validation of indacaterol-induced gene expression changes. RNA was extracted from BEAS-2B cells treated for 1, 2, 6, and 18 hours with indacaterol (10 nM) or vehicle and subjected to gene expression profiling by microarray. Panels show the kinetics of 13 induced and two repressed genes and are plotted as fold change on a log2 scale, where a value of 1 indicates baseline gene expression (dashed horizontal lines). The open circles represent data taken directly from the microarray using the probe set that gave the greatest induction or repression relative to vehicle-treated, time-matched controls. These data were validated by PCR using the same RNA (see Supplemental Table 2 for primers) and are presented as a ratio to GAPDH at each time-point (filled black circles). Probe set IDs are shown within each panel. PCR data are the mean ± S.E.M. of four determinations.

Relationships between LABA-induced gene expression changes in BEAS-2B cells. (A) The correlation at 2 hours between changes in the expression of 15 indacaterol-regulated genes in BEAS-2B cells measured by microarray (using the probe set that produced the greatest change relative to vehicle) and PCR. The same RNA was used in both analyses. (B) The correlation of 12 gene expression changes determined by PCR in BEAS-2B cells stimulated for 2 hours with indacaterol (10 nM) and salmeterol (100 nM). Induced and repressed genes are shown as red and blue circles, respectively. Solid and dashed diagonal lines represent linear regression and the line of identity, respectively. In (A), Human Genome Nomenclature Committee gene symbols are shown together with Affymetrix probe set ID numbers from which the microarray data were derived.
Ontological Analysis of Indacaterol-Regulated Genes.
To gain information on the functional roles of genes that were significantly up- and downregulated by indacaterol at 1, 2, and 6 hours, functional annotation clustering was performed using DAVID. These functional clusters were generated from the genes listed in Supplemental Tables 3 and 4, and are provided in Supplemental Tables 5 and 6.
Indacaterol-Induced Genes at 1 Hour.
Functional annotation of the 134 indacaterol-induced genes at 1 hour generated 11 clusters of enriched GO terms (Supplemental Table 5). Clusters 1, 3, 4, 8, and 9 relate predominantly to gene regulation. The broad descriptor nucleus (GO:0005634) associated with 41% of the gene list and the more restricted but enriched terms negative regulation of transcription from RNA polymerase II promoter (GO:0000122), positive regulation of transcription from RNA polymerase II promoter (GO:0045944), and transcription from RNA polymerase II promoter (GO:0006366) comprised 17.2%, 19.4%, and 10.4% of the list, respectively; many of these genes encode sequence-specific transcription factors (e.g., ATF3, CEBPD, FOS2L, KLF2, KLF4, NFIL3, NR4A family members, TSC22D1) as well as several coactivators (e.g., CITED2) and corepressors (e.g., FEZF, PRDM1, BCL6, BHLHE40).
The remaining six clusters include biologic process or molecular function descriptors that relate to inflammation including cellular response to interleukin-1 (GO:0071347), cellular response to tumour necrosis factor (GO:0071356), cell-cell signalling (GO:0007267), response to lipopolysaccharide (GO:0032496), positive regulation of neutrophil chemotaxis (GO:0090023), and positive regulation of ERK1 and ERK2 cascades (GO:0070374) (Supplemental Table 5). Each of these terms is populated with genes that encode signaling molecules with proinflammatory potential (e.g., AREG, BDNF, C5AR1, CTGF, CCL20, CXCL2, CXCL3, EDN1, IL6). Other genes in these clusters (e.g., ID1, MYC, NFIL3, NR4A3, SOX9) encode transcriptional regulators involved in wound healing, repair, airway hyper-responsiveness, and, potentially, remodeling and were annotated with the GO terms positive regulation of epithelial cell proliferation (GO:0050679) and positive regulation of smooth muscle cell proliferation (GO:0048661) (Supplemental Table 5).
Indacaterol-Induced Genes at 2 Hours.
Twenty clusters of enriched terms were produced from the 321 genes that were significantly induced by indacaterol at 2 hours (Supplemental Table 5). The most highly enriched clusters (1–3) and cluster 11 contain terms that relate to DNA binding and transcription. In particular, 53 (16.5%) and 43 (13.4%) upregulated genes were annotated with the GO terms positive regulation of transcription from RNA polymerase II promoter (GO:0045944) and transcription factor activity, sequence-specific DNA binding (GO:0003700), respectively. Many of these genes encode sequence-specific transcriptional activators (e.g., CEBPA, CEBPD, CREB3L2, FOS, FOSB, FOSL2, FOXC1, FOXC2, FOXO1, HOXA5, KLF4, NR4A family members, NR2F2, TFAP2A, TRAP2C), coactivators or corepressors (e.g., CITED4, VGLL2, ZBTB38). Cluster 20 contains the term Iroquois-class homeodomain protein (IPR:003893), which is populated with genes encoding transcription factors (i.e., IRX1, IRX2, IRX4) involved in development.
The general GO terms integral component of plasma membrane (GO:0005887), extracellular space (GO:0005615), and extracellular region (GO:0005576) are present in cluster 6 and associated with 45, 41, and 39 genes, respectively. These genes encode solute carriers as well as many secreted proteins with proinflammatory properties, such as cytokines (e.g., IL6, IL11, IL15), chemokines (e.g., CCL2, CCL20, CXCL2), growth factors (e.g., AREG, CTGF, EDN1, FGF9, HBEGF), the neurotrophin BDNF, and the ephrin receptor tyrosine kinase EFNA1. Enriched GO terms are also associated with genes encoding proteins with therapeutic potential, such as CD200, CRISPLD2, and DMBT1, which have antibacterial, antiviral, and/or anti-inflammatory activity. Clusters 4, 8, 9, 12, 14, and 15 contain many of the same genes present in cluster 6 and are enriched and annotated with a variety of more specific descriptors that are consistent with a proinflammatory phenotype that includes growth factor activity (GO:0008083), neutrophil chemotaxis (GO:0030593), cytokine activity (GO:0005125), TNF signalling pathway” (HSA:04668), monocyte chemotaxis (GO:0002548), and cellular response to transforming growth factor beta stimulus (GO:0071560) (Supplemental Table 5).
The remaining clusters contain genes with diverse activities that are annotated with terms that relate to calcium, sodium, glucose, amino acid, monocarboxylic acid, thiamine, and carnitine transport (Clusters 7, 10 and 19), proteins covalently linked to the plasma membrane (Cluster 13), protein phosphorylation (Cluster 16), endoderm formation, protein dephosphorylation and mitogen-activated protein (MAP) kinase inactivation (Cluster 18) and response to dexamethasone and antibiotics (Cluster 17; Supplemental Table 5).
Indacaterol-Induced Genes at 6 Hours.
Analysis of the 205 indacaterol-induced genes at 6 hours generated eight clusters of enriched terms (Supplemental Table 5). Clusters 1 and 2 contain generic, cellular component descriptors such as extracellular space (GO:0005615), integral component of plasma membrane (GO:0005887), and plasma membrane (GO:0005887), and are populated with 13.2%, 15.6%, and 30.2% of the gene list, respectively. Many genes associated with these terms are consistent with both beneficial and deleterious effects of β2-adrenoceptor agonists in asthma. These include growth factor, tyrosine kinase-linked and G protein-coupled receptors (e.g., ACKR1, ADGRD2, AVPR2, BRKRB2, C5AR1, CNR1, EPHA5, FGFR2, GAS1, GPRC5A, IGF1R, LPAR6), cytokines, chemokines and related proteins (e.g., CCL2, IL20, IL1RAPL1), as well as a variety of secreted factors (e.g., CRISPLD2, CD200, DMBT1, WNT4, WNT5A). Several of these genes (e.g., FGFR2, GAS1, WNT4, WNT5A) are also annotated by the more specific biochemical process GO terms cell fate commitment (GO:0045165) and epithelial to mesenchymal transition (GO:0001837), which are enriched in cluster 3.
Cluster 4 includes genes encoding cyclic nucleotide phosphodiesterases (PDE3A, PDE4D, PDE7B, PDE10A). These are principally involved in cAMP degradation and were annotated with the similar GO terms cAMP catabolic process (GO:0006198) and 3′,5′-cyclic-AMP phosphodiesterase activity (GO:0004115) (Supplemental Table 5).
Two of the remaining four clusters (5 and 7) contain genes (SLC16A6, SLC16A14, SLC22A3, SLC22A4, SLC22A5) that regulate transmembrane monocarboxylic acid and organic cation transport, and were annotated with the GO terms quaternary ammonium group transport (GO:0015697) and symporter activity (GO:0015293). In contrast, the most enriched GO term in cluster 6 was proteinaceous extracellular matrix (GO:0005578). Genes within this group encode proteins with diverse functional roles, including: an LPS-binding protein that can neutralize the pathogenicity of Gram negative bacteria (CRISPLD2); two endogenous agonists (WNT4, WNT5A) of the frizzled receptor (FZR) family of GPCRs; surfactant protein D (SFTPD); a serine proteinase inhibitor (TFPI2) implicated in the regulation of plasmin-mediated matrix remodeling; the α3-chain of type IV collagen (COL4A3); and a hyaluronan-binding protein (VCAN), which may control cell motility, growth, and differentiation. ADAMTSL1, GPC3 and SMOC1 were also part of this gene cluster but have unclear roles in airway epithelia. Genes associated with cluster 8 were annotated by the KEGG term pathways in cancer (HSA:05200) with representation from cell surface receptors (BDKRB2, FGFR2, IGF1R, LPAR6), transcription factors (CEBPA, FOXO1), endogenous FZR agonists (WNT4, WNT5A), an E3 ubiquitin-protein ligase (MDM2), a type IV collagen (COL4A3), a junctional plaque protein (JUP), and an enzyme involved in apoptosis (CASP9).
Indacaterol-Repressed Genes at 1 Hour.
Functional annotation of the 46 indacaterol-repressed genes at 1 hour, generated a single cluster of descriptors (Supplemental Table 6). The most highly enriched GO term was DNA repair (GO:0006281) and comprised three genes (6.5% of the list): CHEK1, a protein kinase necessary for checkpoint-mediated cell cycle arrest and activation of DNA repair; RECQL5, a DNA helicase, which inhibits elongation of stalled transcripts at DNA damage sites; and EID3, a component of a complex involved in the repair of double-strand breaks in DNA.
Indacaterol-Repressed Genes at 2 Hours.
Two clusters of enriched GO terms were generated from the 47 genes that were significantly repressed by indacaterol at 2 hours (Supplemental Table 6). Cluster 1 contains descriptors that relate to mitotic cell division, in particular the GO biochemical process terms cell division (GO:0051301) and mitotic nuclear division (GO:0007067). These were populated with genes that account for 9%–13% of the list, respectively, and include BUB1, BORA, CCNF, HMGA2, PARD6B, and PSRC1.
Cluster 2 contains nine GO terms that are associated with DNA binding and the regulation of gene transcription. The most enriched term in this cluster, transcription, DNA templated (GO:0006351), was populated with 11 genes (23.4% of the list) that encode both established and putative transcription factors (EGR3, KLF7, SIM1, ZNF99, ZNF547, ZNF552, ZNF556, ZNF594, ZNF738), a transcriptional coactivator (MED3L), and an inhibitor of thioredoxin 1 (TXNIP).
Indacaterol-Repressed Genes at 6 Hours.
Functional annotation of the 47 genes repressed at 6 hours generated a cluster of 11 enriched terms that relate to a host’s response to virus infection (Supplemental Table 6). Five genes (IFI44, MX1, OAS1, OAS2, OAS3) were associated with the biochemical process and molecular function GO descriptors type I interferon signaling pathway (GO:0060337), response to virus (GO:0009615), defence response to virus (GO:0051607), and 2′,5′-oligoadenylate synthetase activity (GO:0001730), and encode proteins that block the replication of RNA and some DNA viruses.
Effect of Salmeterol on Gene Expression in BEAS-2B Cells and the Effect of PKIα.
To determine if the genomic effects of indacaterol extended to other LABAs, 15 induced genes were selected from the microarray and their expression level changes (as a ratio to GAPDH) were determined in BEAS-2B cells exposed for 2 hours to a maximally effective concentration of salmeterol (100 nM). Salmeterol was selected for these experiments because it is a clinically relevant, low efficacy LABA (cf., indacaterol; Table 2) and can behave as a partial agonist and antagonist at β2-adrenoceptors depending on the tissue or functional response of interest (Dougall et al., 1991; Rabe et al., 1993; Duringer et al., 2009).
Despite its low operational efficacy, salmeterol increased the expression of all genes studied at 2 hours relative to time-matched, vehicle-treated cells (Fig. 9). Moreover, there was a significant, rank order correlation between the salmeterol-induced genes that were common with the PCR-validated indacaterol results at 2 hours shown in Fig. 7. Linear regression yielded a slope of 0.84, which was not significantly different from unity, indicating that the magnitudes of many gene expression changes induced by both LABAs were comparable (Fig. 8B).

Effect of salmeterol on gene expression in BEAS-2B cells and the effect of PKIα. Cells at ∼70% confluency were infected with Ad5.CMV.PKIα (PKI), Ad5.CMV.GFP (GFP, MOI = 25), or left untreated. After 48 hours, salmeterol (Salm; 100 nM) or vehicle was added for 2 hours and changes in the expression of 15 genes (ordered alphabetically) relative to GAPDH were determined by real-time PCR. Bars represent the mean ± S.E.M. of N independent determinations. The dashed horizontal line in each panel represents baseline gene expression. *P < 0.05; **P < 0.05 indicate significant inhibition by PKIα of gene expression in cells treated with salmeterol and vehicle, respectively and was determined by repeated measures, ANOVA followed by Tukey multiple comparison test.
The role of canonical cAMP signaling in mediating salmeterol-induced gene expression is also shown in Fig. 9. BEAS-2B cells were infected with Ad5.CMV.PKIα (MOI = 25), which encodes a highly selective inhibitor of PKA (Takio et al., 1984; Glass et al., 1986), or a control vector, Ad5.CMV.GFP. Of the 15 genes analyzed, five are proinflammatory (C5AR1, CXCL2, EDN1, IL6 and IL11), eight have putative disease-modifying activity (CD200, CDKN1C, CRISPLD2, DMBT1, DUSP1, GAS1, RGS2, and SOCS3), and the remaining two (NR4A2 and NR4A3) have unclear functions in the airways. Regardless of their (patho)physiologic roles, this intervention prevented the induction of all 15 genes, indicating that signaling downstream of Gsα was the sole regulator of transcription (Fig. 9).
PKIα also significantly reduced the basal expression of several of the 15 genes examined (Fig. 9). This was replicated in cells exposed to salmeterol (100 nM), which suggests that PKA was activated under resting (i.e., serum-free) conditions. The control vector, encoding GFP, was inactive.
Effect of Salmeterol on Gene Expression in HBECs.
The effect of salmeterol (100 nM) on gene expression was determined in HBECs harvested from the upper right or upper left lung lobe of five male subjects who were 18–62 years of age at the time of death (see Supplemental Table 1 for demographics). These genes were randomly selected from the BEAS-2B microarray data as being either significantly induced or repressed by indacaterol at either 2 or 6 hours (FDR P value < 0.1).
Figure 10 shows gene expression (as a ratio to GAPDH) for each donor at baseline and after 2- and 6-hour exposures to salmeterol. Consistent with indacaterol microarray data, the majority of these genes were correspondingly induced or repressed by salmeterol in HBECs at one or both time-points. Indeed, by PCR at 2 hours, changes in the expression of a panel of genes in HBECs and BEAS-2B cells were significantly rank order correlated (Fig. 11A) and the line of regression was not statistically different from a value of 1. This relationship was preserved if the expression levels of the 27 genes in salmeterol-treated HBECs were correlated against the corresponding changes in indacaterol-exposed BEAS-2B cells (Fig. 11B). However, in this comparison, discrepancies were apparent. In particular, the expression of C5AR1, CDKN1C, CRISPLD2, DMBT1, IL11, NR4A1, and NR4A3 was not statistically different from vehicle in HBECs exposed to salmeterol, whereas in BEAS-2B cells they were induced (Fig. 11). Other anomalies included the regulation of CITED4 at 2 hours, which was increased and decreased by salmeterol in BEAS-2B and HBECs, respectively, and TXNIP whose expression was transiently reduced in BEAS-2B cells yet increased in HBECs at 6 hours.

Effect of salmeterol on gene expression in HBECs. Cells from five donors were exposed to vehicle (red circles) or salmeterol (black circles; 100 nM) for 2 and 6 hours (V2h, V6h, S2h and S6h, respectively). cDNA was prepared and subjected to real-time PCR using primers specific for 27 genes selected from the microarray (Supplemental Table 2). Changes in gene expression in cells harvested from each donor are presented relative to GAPDH and are ordered alphabetically. The mean salmeterol-induced fold change is shown at the top of each panel with the range in brackets. *P < 0.05, significant change from vehicle-treated cells, Student paired t test. NS, Not significant.

Concordance of gene expression changes in BEAS-2B cells and HBECs. (A) Relationship between the effects of salmeterol (100 nM for 2 hours) on the expression in HBECs of 20 of the genes shown in Fig. 10 with their counterparts in BEAS-2B cells measured by PCR. (B) A similar plot between all gene expression changes measured in HBECs exposed to salmeterol (Fig. 10) and their indacaterol (10 nM)-stimulated equivalents in BEAS-2B cells (using probe sets that produced the greatest change relative to vehicle). Induced and repressed genes are shown in red and blue, respectively. Solid and dashed diagonal lines represent linear regression and the line of identity, respectively. In (B), Human Genome Nomenclature Committee gene symbols are indicated together with Affymetrix probe set ID numbers from which the microarray data were derived.
Discussion
Inhaled β2-adrenoceptor agonists were introduced for the treatment of asthma in 1968, and since that time ASM relaxation has been assumed to account for their clinical efficacy (Sneader, 2001). The increase in asthma mortality reported in the 1960s and 1970s with isoprenaline and fenoterol given chronically as a monotherapy (Cockcroft and Sears, 2013) can also be attributed to long-lasting bronchodilatation, because the underlying inflammation would have been masked and resulted, theoretically, in a loss of disease control (McIvor et al., 1998). However, the discovery that indacaterol changed the expression of hundreds of genes in BEAS-2B cells suggests that the adverse and beneficial effects of β2-adrenoceptor agonists in asthma may extend beyond ASM relaxation and involve genomic mechanisms that operate in a variety of airway cells including the epithelium. Functional annotation clustering of the indacaterol-regulated transcriptome implicates populations of genes that can exacerbate airway pathology and may contribute to the reported toxicity of regular β2-adrenoceptor agonist monotherapy. Likewise, other genes were identified that may exert therapeutic benefit, especially when used in combination with an ICS (vide infra), by exerting antiviral, antibacterial, anti-inflammatory, and, possibly, anti-airway remodeling activities. The replication of many key gene expression changes in HBECs in response to the low efficacy agonist salmeterol indicates that this genomic effect is not peculiar to the BEAS-2B cell line and may be shared by other clinically used SABAs and LABAs.
Indacaterol-Induced, Adverse-Effect Genes.
A striking feature of the indacaterol-induced transcriptome was that many enriched GO terms, including neutrophil chemotaxis, cellular response to interleukin 1, and response to lipopolysaccharide were populated with genes that can generate a proinflammatory phenotype. Cytokine, chemokine, and growth factor mRNAs were significantly upregulated by indacaterol. These included CCL2, CCL20, CXCL2, and CXCL3, which encode proteins that are chemotactic for neutrophils, hematopoietic stem cells, monocytes, memory T-cells, dendritic cells and lymphocytes (Wolpe et al., 1989; Carr et al., 1994; Xu et al., 1996; Hieshima et al., 1997; Smith et al., 2005; Pelus and Fukuda, 2006). Similarly, BDNF, a neurotrophin that maintains the survival and activation of immune and structural cells in the lung and is elevated in the sputum of subjects with severe asthma (Watanabe et al., 2015), was also induced by indacaterol. This finding is consistent with the ability of salmeterol to upregulate BDNF in the blood of patients with mild asthma (Lommatzsch et al., 2009), implying that SABA and LABA monotherapy may enhance pre-existing inflammation.
More than 40 genes involved in transcriptional control were induced by indacaterol in BEAS-2B cells and annotated with the highly enriched GO term positive regulation of transcription from RNA polymerase II promoter. Although several of these genes encode repressors, the majority are positive regulators of transcription. Thus, several FOS transcripts (FOS, FOSB and FOSL2), whose products dimerize with c-Jun family members to form the transcription factor AP1, were significantly upregulated. The expression of NFIL3 and CEBPD were similarly increased. NFIL3 promotes IgE class switching, airway hyperresponsiveness (Kashiwada et al., 2010), macrophage activation, CD4+ T-cell polarization and the development of natural killer and dendritic cells (Male et al., 2012). In contrast, CEBPD regulates immune and inflammatory responses by promoting the transcription of proinflammatory cytokine genes, including IL6 (Kinoshita et al., 1992), whose expression was also increased in indacaterol-treated BEAS-2B cells.
Indacaterol-Induced Genes with Therapeutic Potential.
The indacaterol-induced transcriptome likewise contains genes with therapeutic potential. Generally, their functions are poorly described and annotated with broad cellular component GO terms such as nucleus, extracellular space, and secreted. Nevertheless, manual curation identified many genes (e.g., DUSP1, SOCS3, CD200) with predicted therapeutic activity on the basis of in vitro observations and studies in preclinical models of inflammation. DUSP1 is a phosphatase that catalyzes the inactivation of the three core MAP kinases: extracellular signal-regulated kinase, p38 MAP kinase, and c-Jun-N-terminal kinase (Liu et al., 2007), which are central regulators of virtually all aspects of inflammatory processes, including gene expression (Kyriakis and Avruch, 2012). SOCS3 negatively regulates IL-6-, IL-12-, and G-CSF-signaling by inhibiting the JAK/STAT pathway (Yoshimura et al., 2007), whereas CD200 interacts with CD200R-bearing cells, such as macrophages, to suppress proinflammatory cytokine generation (Snelgrove et al., 2008); it may also attenuate airway hyperresponsiveness (Lauzon-Joset et al., 2015).
Other genes were identified that could protect against bacteria- and virus-induced exacerbations of asthma. CRISPLD2, which was originally implicated in the etiology of nonsyndromic cleft lip (Chiquet et al., 2007), encodes a secreted, LPS-binding protein in both humans and mice (Wang et al., 2009). Evidence that it can neutralize the pathogenicity of Gram negative bacteria by downregulating TLR4-mediated proinflammatory responses is available (Zhang et al., 2016). Similarly, DMBT1 encodes a multifunctional, secreted protein that is present in human bronchoalveolar lavage fluid (Holmskov et al., 1997). Through its ability to interact with a range of polysulfated and polyphosphorylated ligands, DMBT1 binds Gram positive and Gram negative bacteria and may, therefore, provide a defense against microbial pathogens (Madsen et al., 2010). DMBT1 also inhibits the infectivity of human influenza A and immunodeficiency viruses (Madsen et al., 2010).
Of the indacaterol-induced genes involved in transcriptional control, NR4A1, NR4A2, and NR4A3 were markedly upregulated. There is emerging evidence that these early response genes, which encode ligand-independent transcription factors, function as negative feedback regulators of inflammation (Rodriguez-Calvo et al., 2017). In the immune system, they are implicated in the maturation and/or development of monocytes, regulatory T cells, and CD8+ lymphocytes. Moreover, in Nr4a2-deficient mice, macrophages are polarized toward a proinflammatory M1 phenotype (Rodriguez-Calvo et al., 2017). Currently, the genes under the control of NR4A family members are ill-defined.
Indacaterol-Repressed Genes.
Depending on the time of exposure, 13%–26% of the indacaterol-regulated transcriptome was repressed by <0.67-fold. Notable genes that, when downregulated, may be beneficial include the transcription factor EGR1, which is implicated in the etiology of airway fibrosis, inflammation, and remodeling (Lee et al., 2004; Cho et al., 2006). The ability of indacaterol to reduce the expression of TXNIP may also be favorable. This gene encodes a protein that inhibits the ability of thioredoxin 1 to reduce oxidized proteins. Accordingly, a reduction in TXNIP should enhance thioredoxin 1 activity and may reduce oxidative stress (Nishiyama et al., 1999).
Repressed genes that may lead to undesirable outcomes were also identified. These include OAS1, OAS2, and OAS3, which encode 2′,5′-oligoadenylates that degrade viral RNA and inhibit viral replication by activating latent RNase L (Kristiansen et al., 2011). Two other antiviral genes (IFI44, MX1) were also repressed, suggesting that β2-adrenoceptor agonist monotherapy could compromise the body’s innate response to infection (cf., CRISPLD2 and DMBT1, vide supra).
Gene Regulation in BEAS-2B Cells and HBECs by Low Efficacy LABAs.
Agonist intrinsic efficacy can vary markedly with profound functional consequences in cells expressing a low receptor number or when receptor-effector coupling is weak. The ability of salmeterol to behave as a full agonist on ASM and an antagonist on eosinophils are extreme examples of such behavior (Rabe et al., 1993; Munoz et al., 1995; Aparici et al., 2012). In this study, salmeterol activated the CRE reporter and promoted gene expression changes that were indistinguishable from those of indacaterol, despite the 10-fold difference in operational efficacy, indicating that β2-adrenoceptor density on BEAS-2B cells was not limiting.
Salmeterol also promoted gene expression changes in HBECs. Although many of these were similarly regulated in BEAS-2B cells, discrepancies were apparent. These may be explained by weak statistical power (see DMBT1 and NR4A3 in Fig. 10), intrinsic differences in gene regulation between the two cell types, or dissimilar culture conditions. Even allowing for the inconsistencies, gene expression changes were significantly rank-order correlated and preserved when the salmeterol PCR results in BEAS-2B cells were substituted with the corresponding indacaterol data from the array. Thus, a similar genomic impact of indacaterol and salmeterol on HBECs and BEAS-2B cells is implied.
β2-Adrenoceptor-Mediated Toxicity and the Effect of ICSs.
The results presented herein could explain why regular SABA and LABA monotherapy makes asthma worse. Scrutiny of the gene expression fingerprint of indacaterol in BEAS-2B cells identified hundreds of DEGs. While some of these encode proteins with putative therapeutic benefit, there were arguably many more that could promote, or even exacerbate, airways inflammation (vide supra). Thus, the net effect of regular SABA and LABA monotherapy could increase asthma severity and enhance mortality by preferentially enhancing proinflammatory gene expression. A genomic effect is also germane to the mechanism of action of ICS/LABA combination therapy, because glucocorticoids repress the expression of many of these adverse-effect genes (Newton and Giembycz, 2016) and protect against LABA-induced toxicity in asthmatic subjects (Cates et al., 2014). As a result, an ICS may tip the balance of a LABA away from side effects potentially toward therapeutic benefit.
An ICS can also augment, in an additive or synergistic manner, the expression of many LABA-induced genes that could be therapeutically desirable (Giembycz and Newton, 2015; Newton and Giembycz, 2016). A recent microarray-based study using human airway epithelial cells identified many genes that are regulated in this way, including CRISPLD2, RGS2, and DUSP1 (Rider et al., under review). Collectively, therefore, the ability of an ICS to repress and enhance, respectively, populations of LABA-inducible genes that mediate deleterious and beneficial effects on airway function may help explain why ICS/LABA combination therapy often controls subjects with moderate-to-severe asthma, whereas ICS monotherapy does not (Giembycz and Newton, 2015; Newton and Giembycz, 2016).
Role of Canonical cAMP Signaling.
Previous studies have established that SABA- and LABA-induced gene expression changes in BEAS-2B cells are mediated by the β2-adrenoceptor (Holden et al., 2014; Joshi et al., 2015, 2017; Kaur et al., 2008). The ability of PKIα to prevent the induction of several salmeterol-induced genes that are associated with enriched GO terms related to proinflammatory or therapeutic processes extends those findings and provides evidence that cAMP/PKA signaling is a major regulator of gene transcription. Knowledge that these gene promoters, and many more, feature cis-acting CREs for the transcription factor cAMP response element–binding protein (CREB) (Zhang et al., 2005)—an established substrate for PKA—is consistent with this suggestion. However, interpretation of these data must be weighed against the fact that PKIα was examined on only 15 salmeterol-induced genes. Thus, the role of alternative (e.g., arrestin-dependent) mechanisms of gene regulation cannot be excluded. Indeed, there is evidence that the β2-adrenoceptor can recruit Gs-independent pathways through biased agonism (Rajagopal et al., 2011; van der Westhuizen et al., 2014), suggesting that we may have unintentionally selected genes from the microarray that are transcribed, in response to salmeterol, in a PKA-dependent manner.
Limitations of the Work.
A shortcoming that should be addressed in future studies is to establish the extent to which the LABA-regulated transcriptome in submerged epithelial cell cultures (reported here) is replicated in a differentiated in vitro model, such as epithelial cells grown at an air-liquid interface or, preferably, the airway epithelium harvested from asthmatic subjects given a β2-adrenoceptor agonist by inhalation. The in vivo investigation is particularly important because it will reveal the genomic capacity of these drugs at therapeutically relevant doses on a background of airway inflammation. It will also identify DEGs that are regulated in a similar way in cells grown in culture. Although such studies are lacking, a genomic effect is possible given that SABAs and LABAs increase the levels of proinflammatory mediators in the lungs of human subjects, promote pulmonary eosinophilia and enhance the late phase asthmatic response (Manolitsas et al., 1995; Gauvreau et al., 1997; Aldridge et al., 2000; Gordon et al., 2003; Lommatzsch et al., 2009; O’Kane et al., 2009; Watanabe et al., 2015).
Conclusions.
The results presented here suggest that widespread changes in gene expression may contribute to the adverse and therapeutic effects of inhaled β2-adrenoceptor agonists in asthma. Large scale observational studies and clinical trials identified the toxicity associated with SABA and LABA monotherapy many years ago, but its mechanistic basis still remains unclear. If a proinflammatory, genomic effect of these compounds is established in the airways of asthmatic subjects and is prevented by an ICS, then this could influence treatment guidelines and clinical practice leading to better asthma management. Likewise, the identification of distinct populations of LABA-induced genes with biologic activities that are beneficial in asthma and that are enhanced by an ICS would inform physicians of the mechanistic rationale and advantages of prescribing ICS/LABA combination therapy.
In this study, GO analyses were restricted to transcripts that were changed by either >1.5-fold or <0.67-fold. These arbitrary cut-off levels involved an evaluation of, maximally, 321 DEGs. However, if a threshold had not been imposed, many more DEGs would have formed the basis of all analyses. Although a small (e.g., 1.25-fold) induction or repression of a single gene may be clinically unimportant, changes of this magnitude in the expression of hundreds of genes could have a profound impact on respiratory pathophysiology. Thus, expression of the LABA-regulated transcriptome, and its modulation by glucocorticoids, may have functional implications that are greater than what is suggested here.
Acknowledgments
The authors acknowledge Sylvia Wilson for generating the samples used for gene expression profiling.
Authorship Contributions
Participated in research design: Giembycz, Hamed, T. Joshi, Newton, Yan.
Conducted experiments: Hamed, Jamieson, R. Joshi, T. Joshi, Yan.
Performed data analysis: Giembycz, Hamed, R. Joshi, Mostafa, Yan.
Wrote or contributed to the writing of the manuscript: Giembycz, Hamed, Jamieson, T. Joshi, R. Joshi, Mostafa, Newton, Yan.
Footnotes
- Received March 22, 2018.
- Accepted April 11, 2018.
↵1 Current affiliation: Global Development Operations, Novartis Healthcare Pvt. Ltd, Salarpuria-Sattva Knowledge City, Raidurg, Hyderabad, India.https://doi.org/10.1124/jpet.118.249292.
This study was supported by a project grant from the Canadian Institutes for Health Research (PJT 152904), The Lung Association, Alberta & NWT, and an unrestricted research grant from Gilead Sciences Inc., Seattle, WA. K.C.J., M.M.M., O.H., and T.J. are recipients of studentships awarded by The Lung Association, Alberta & NWT. D.Y. is supported by Alberta Innovates. K.C.J. is a recipient of a University of Calgary Eyes High Doctoral Recruitment Scholarship. Real-time PCR was facilitated by an equipment and infrastructure grant from the Canadian Fund of Innovation and the Alberta Science and Research Authority. The authors state no conflict of interest.
↵
 This article has supplemental material available at jpet.aspetjournals.org.

Abbreviations
- ANOVA
- analysis of variance
- ASM
- airway smooth muscle
- β2A
- 8-hydroxy-5-((R)-1-hydroxy-2-methylaminoethyl)-1H-quinolin-2-one
- CMV
- cytomegalovirus
- CRE
- cAMP response element
- CREB
- cAMP response element–binding protein
- DAVID
- database for visualization and integrated discovery
- DCITC
- (5(2-(((1′-(4′-isothiocyanatephenylamino)thiocarbonyl)amino)-2-methylpropyl)amino-2-hydroxypropoxy)-3,4-dihydrocarbostyril
- DEGs
- differentially expressed genes
- FDR
- false discovery rate
- FZR
- frizzled receptor
- GFP
- green fluorescent protein
- GINA
- global initiative for asthma
- GO
- gene ontology
- HBECs
- human bronchial epithelial cells
- ICS
- inhaled corticosteroid
- KEGG
- Kyoto encyclopedia of genes and genomes
- LABA
- long-acting β2-adrenoceptor agonist
- MAP
- mitogen-activated protein
- MOI
- multiplicity of infection
- PCR
- polymerase chain reaction
- PKA
- cAMP-dependent protein kinase
- PKI
- protein kinase inhibitor
- RGS2
- regulator of protein signaling 2
- SABA
- short-acting β2-adrenoceptor agonist
- SFM
- serum-free medium
- Copyright © 2018 by The American Society for Pharmacology and Experimental Therapeutics


